. 2022 Aug 16;40(7):111179.
doi: 10.1016/j.celrep.2022.111179.

A cytoskeletal vortex drives phage nucleus rotation during jumbo phage replication in E. coli

Affiliations

A cytoskeletal vortex drives phage nucleus rotation during jumbo phage replication in E. coli

Erica A Birkholz et al. Cell Rep. .

Abstract

Nucleus-forming jumbo phages establish an intricate subcellular organization, enclosing phage genomes within a proteinaceous shell called the phage nucleus. During infection in Pseudomonas, some jumbo phages assemble a bipolar spindle of tubulin-like PhuZ filaments that positions the phage nucleus at midcell and drives its intracellular rotation. This facilitates the distribution of capsids on its surface for genome packaging. Here we show that the Escherichia coli jumbo phage Goslar assembles a phage nucleus surrounded by an array of PhuZ filaments resembling a vortex instead of a bipolar spindle. Expression of a mutant PhuZ protein strongly reduces Goslar phage nucleus rotation, demonstrating that the PhuZ cytoskeletal vortex is necessary for rotating the phage nucleus. While vortex-like cytoskeletal arrays are important in eukaryotes for cytoplasmic streaming and nucleus alignment, this work identifies a coherent assembly of filaments into a vortex-like structure driving intracellular rotation within the prokaryotic cytoplasm.

Keywords: CP: Microbiology; bacterial cell biology; bacterial cytoskeleton; bacteriophage; bacteriophage replication; phage nucleus; phage tubulin.


Conflict of interest statement

Declaration of interests The authors declare no competing interests.

Figures
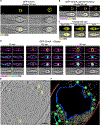
Figure 1.
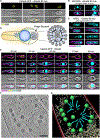
Figure 1.. Goslar builds a phage nucleus separating DNA from translation and metabolism
(A–F) Goslar infecting E. coli MG1655 expressing fluorescent protein fusions (A–D) or APEC (E and F) for the indicated time. White scale bars represent 1 μm. All fluorescent protein fusion expression was induced at 0.2 mM IPTG. Cells were stained with FM4–64 (4 μg/mL, membrane, magenta) and DAPI (2 μg/mL, DNA, cyan) (C and D). Fluorescence images were deconvolved using SoftWoRx 6.5.2. GFP-ChmA images are representative of at least five independent experiments. (A) GFP-ChmA (gp189, yellow) 90 mpi. (B) GFP-ChmA and gp193-mCherry 60 mpi. (C) 50S ribosomal protein L20 (RplT)-GFP, thymidylate kinase (TMK)-GFP, and soluble GFP, 60 min. (D) GFP-ChmA, 30, 60, or 90 mpi. (E) Slice through a deconvolved tomogram of a phage nucleus in a 90 mpi Goslar-infected APEC cell. Inset scale bar represents 250 nm (1, empty capsid; 2, partially filled capsid; 3, nearly full capsid). This tomogram is representative of 12 independent tomograms. (F) Annotation of the tomogram shown in (E). Outer (red) and inner (pink) host cell membranes; phage nucleus shell (blue), capsids (green), tails (cyan), 70S ribosomes (yellow).
Figure 2.
Figure 2.. Goslar PhuZ forms a vortex-like cytoskeletal array
E. coli (MG1655) expressing GFP-PhuZ at 0.2 mM IPTG and infected with Goslar. Scale bars represent 1 μm. GFP-PhuZ images are representative of at least five independent experiments. (A) Cells at 30, 60, or 90 mpi prior to staining with FM4–64 and DAPI for 10 min. (B) Cells at 90 and 120 mpi. (C) Percentage of 30 mpi (n = 75) or 60 mpi (n = 114) cells with a GFP-PhuZ filament over 0.3 μm. (D) Model of the PhuZ cytoskeletal vortex. PhuZ filaments (green) extend radially from the phage nucleus (blue) to the cell membrane (gold).
Figure 3.
Figure 3.. Colocalization experiments show the PhuZ cytoskeletal vortex wraps around the proteinaceous phage nucleus
(A–C) E. coli (MG1655) co-expressing indicated fluorescent proteins induced with 0.2 mM IPTG and infected with Goslar. Scale bars represent 1 μm. GFP-PhuZ images are representative of at least three independent experiments. Results are representative of at least two independent experiments. (A) GFP-ChmA (yellow) and mCherry-PhuZ (magenta) in 90 mpi cells. (B) mCherry-ChmA (magenta) and GFP-PhuZ (yellow) in 90 mpi cells. (C) GFP-ChmA (yellow) and mCherry-PhuZ (magenta) in cells infected for 30, 60, or 90 min then dyed with DAPI (cyan). (D) Distribution of DIC phage nuclei positions along the length of the cell (MG1655), in 0.05 fraction of the cell length bins (30 mpi, n = 35; 60 mpi, n = 115; 90 mpi, n = 122). (E) 2D area of the DAPI-stained phage nucleus in MG1655 at 30 mpi (n = 50), 60 mpi (n = 114), and 90 mpi (n = 121). (F) Distribution of DIC phage nuclei positions along the length of the APEC cell, in 0.05 fraction of cell length bins (30 mpi, n = 96; 60 mpi, n = 105; 90 mpi, n = 114). (G) 2D area of the DAPI-stained phage nucleus in APEC at 30 mpi (n = 115), 60 mpi (n = 120), and 90 mpi (n = 145).
Figure 4.
Figure 4.. The Goslar phage nucleus rotates
E. coli (MG1655) expressing the indicated fusion protein induced with 0.2 mM IPTG and infected with Goslar. Scale bars represent 1 μm. (A) Time lapse of the phage nucleus every 4 s for 20 s in cells expressing GFP-ChmA (white) at 65 mpi. Yellow arrowhead and bracket are markers for following rotation. Also see Video S1. (B) DIC time lapse every 4 s for 20 s in 60 mpi cells. Results are representative of at least three independent experiments. Also see Video S2. (C) Linear velocity of nucleus rotation measured from DIC time lapse, averaging 50 nm/s (n = 20), red dotted line, individual measurements shown as gray lines. (D) Model of ΦKZ phage nucleus rotation by bipolar PhuZ spindle (top) and Goslar phage nucleus rotation by PhuZ cytoskeletal vortex (bottom). Arrows indicate the direction of forces applied to the phage nucleus and direction of rotation. (E) GFP imaging coupled with DIC time lapse every 4 s on cells expressing GFP-PhuZ (yellow, left); yellow arrowhead indicates DIC density to follow for rotation, red curved arrows in final panels indicate direction of rotation (counter-clockwise [CCW] top cell, clockwise [CW] bottom cell). Results are representative of two independent experiments.
Figure 5.
Figure 5.. Mutant PhuZ(D202A) disrupts filament formation and nucleus rotation
(A) E. coli expressing GFP-PhuZ(D202A) at 0.2 mM IPTG and infected by Goslar for 60 min before being stained with FM4–64 and DAPI. Scale bar represents 1 μm. (B) DIC time lapse every 4 s for 36 s on E. coli expressing GFP-PhuZ(D202A) at 0.2 mM IPTG and infected by Goslar for 60 min. Same scale as (A). Results of (A) and (B) are representative of three independent experiments. Also see Videos S3 and S4. (C) Percentage of the infected cells at 60 mpi that had a rotating nucleus with any amount of progressive movement imaged by DIC time lapse for E. coli with no plasmid (MG1655, n = 105) or cells expressing GFP-PhuZ (n = 164) or GFP-PhuZ(D202A) (n = 101) (unpaired t test, *p = 0.04, ****p < 0.0001). (D) Linear velocity of the most progressively rotating nuclei at 60 mpi by DIC time lapse for E. coli with no plasmid (MG1655, n = 20) or cells expressing GFP-PhuZ (n = 20) or GFP-PhuZ(D202A) (n = 23). Violin plot generated and unpaired t tests performed using GraphPad Prism 9 (unpaired t test; ns, p > 0.05, ****p < 0.0001).
Figure 6.
Figure 6.. Goslar capsids migrate from the cytoplasm, surround the phage nucleus, and form phage bouquets
(A–G) Goslar infecting E. coli MG1655 (B) or MG1655 expressing the putative capsid protein (gp41) fused to GFP (yellow) (A–E) or APEC (C–G) for the indicated time. White scale bars represent 1 μm. All fluorescent protein fusion expression was induced at 0.2 mM IPTG. Results are representative of at least three independent experiments. (A) Infected cells at 90 mpi. Bouquets are found around the phage nucleus (left), in adjacent bouquets (middle), and filling more of the cytoplasm (right). (B) The 90 mpi MG1655 cells stained with 10 μg/mL DAPI for 30 min at room temperature. White arrowheads indicate faint bouquets. (C) APEC grown with 200 ng/mL DAPI for 90 min then infected with Goslar for 90 min. Large, brightly fluorescent phage bouquets are formed. See Videos S5 and S6 for 3D reconstructions of left panels. (D) Model of Goslar phage bouquet organization with tails packed together. (E) MG1655 expressing capsid-GFP (yellow) and infected with Goslar for 30, 40, 50, 60, 70, or 90 min before being stained with FM4–64 (magenta) and DAPI (cyan). Also see Video S7. (F) Slice through a deconvolved tomogram of a phage bouquet in a Goslar-infected APEC cell at 90 mpi. Inset scale bar represents 250 nm. (G) Annotation of the tomogram shown in (F). Outer (red) and inner (pink) host cell membranes, phage nucleus shell (blue), capsids (green), tails (cyan), 70S ribosomes (yellow).
Figure 7.
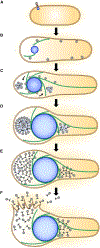
Figure 7.. Model of the Goslar infection cycle
(A) The Goslar phage injects its DNA into an E. coli cell and the formation of a shell begins. (B) The shell grows in size as DNA replicates inside and the PhuZ vortex begins to form. Capsids form near the periphery of the cell and migrate toward the phage nucleus, possibly by trafficking along PhuZ filaments as we have demonstrated for Pseudomonas phages (Chaikeeratisak et al., 2019). (C) The PhuZ vortex is fully formed, wrapping around and rotating the phage nucleus. Capsids dock on the nuclear shell to be filled with DNA prior to localizing to the adjacent bouquets. (D) Large bouquets form with internally localized capsids on either one side or both sides of the phage nucleus. (E) Final assembly of the progeny virions is completed as they fill the cell in a more disordered fashion. (F) Lysis of the E. coli cell is achieved, releasing the progeny virions to find the next host.

Similar articles

Cited by

References

    1. Aylett CH, Izoré T, Amos LA, and Löwe J. (2013). Structure of the tubulin/FtsZ-like protein TubZ from Pseudomonas bacteriophage ΦKZ. J. Mol. Biol 425, 2164–2173. - PMC - PubMed
    1. Bharat TAM, and Scheres SHW (2016). Resolving macromolecular structures from electron cryo-tomography data using subtomogram averaging in RELION. Nat. Protoc 11, 2054–2065. - PMC - PubMed
    1. Burt A, Gaifas L, Dendooven T, and Gutsche I. (2021). Tools enabling flexible approaches to high-resolution subtomogram averaging. Preprint at bio-Rxiv. 10.1101/2021.01.31.428990. - DOI
    1. Castaño-Díez D, Kudryashev M, Arheit M, and Stahlberg H. (2012). Dynamo: a flexible, user-friendly development tool for subtomogram averaging of cryo-EM data in high-performance computing environments. J. Struct. Biol 178, 139–151. - PubMed
    1. Castaño-Díez D, Kudryashev M, and Stahlberg H. (2017). Dynamo Catalogue: geometrical tools and data management for particle picking in subtomogram averaging of cryo-electron tomograms. J. Struct. Biol 197, 135–144. - PubMed

Publication types