. 2022 Aug 16;40(7):111230.
doi: 10.1016/j.celrep.2022.111230.

Spatially resolved deconvolution of the fibrotic niche in lung fibrosis

Affiliations

Spatially resolved deconvolution of the fibrotic niche in lung fibrosis

Michael Eyres et al. Cell Rep. .

Abstract

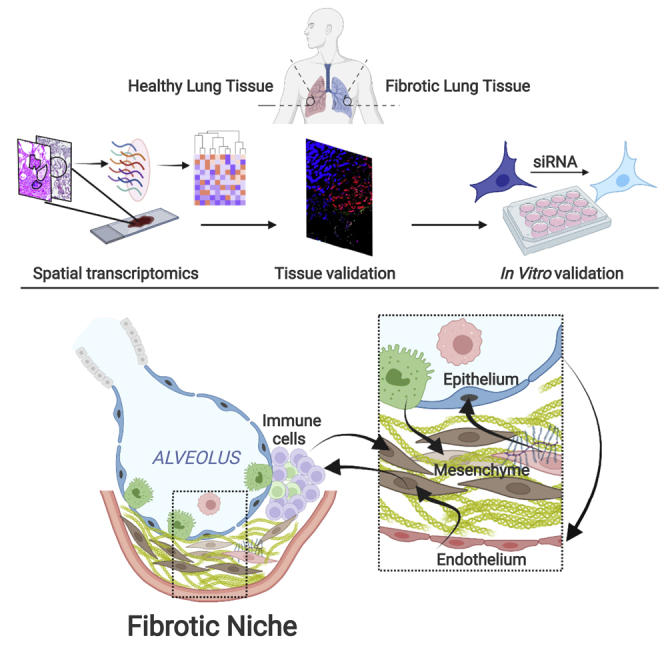
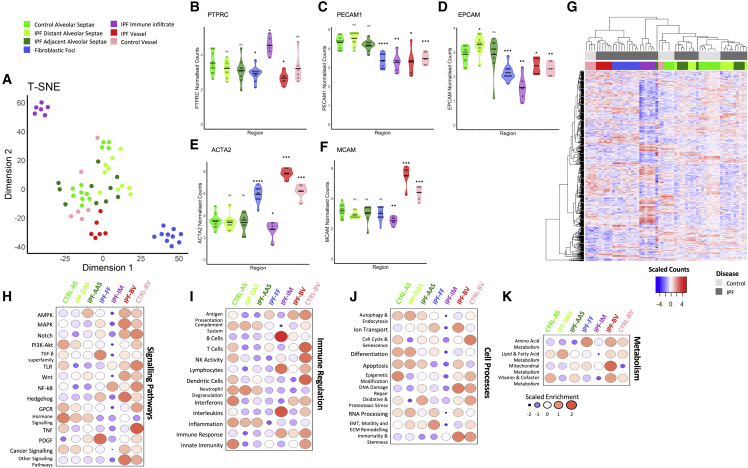
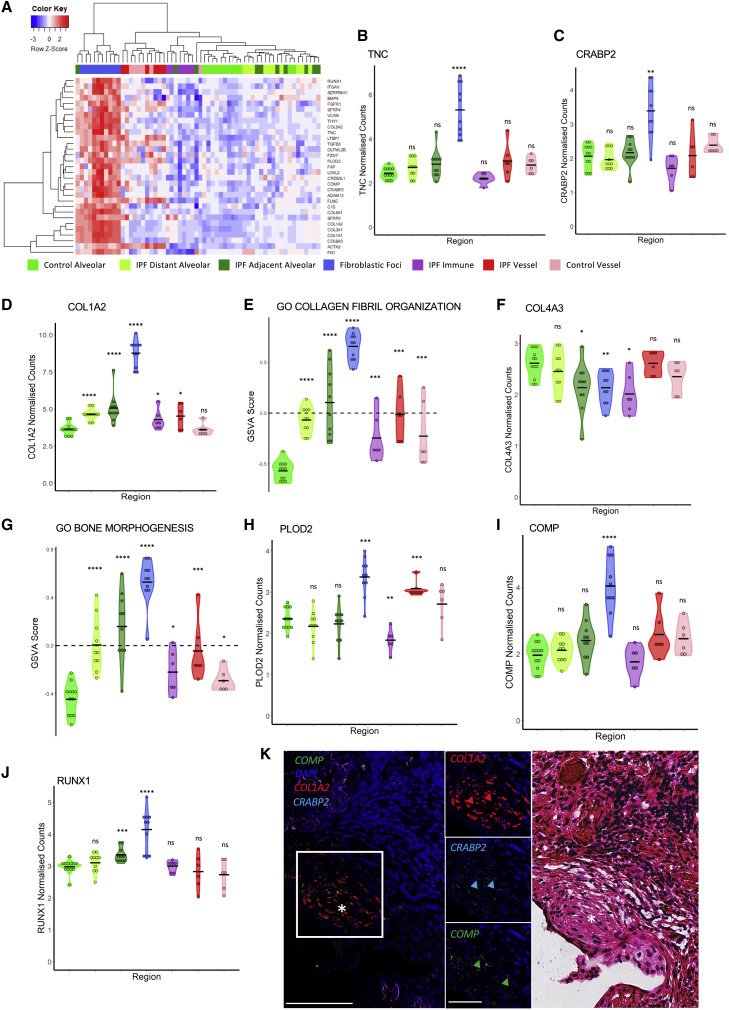
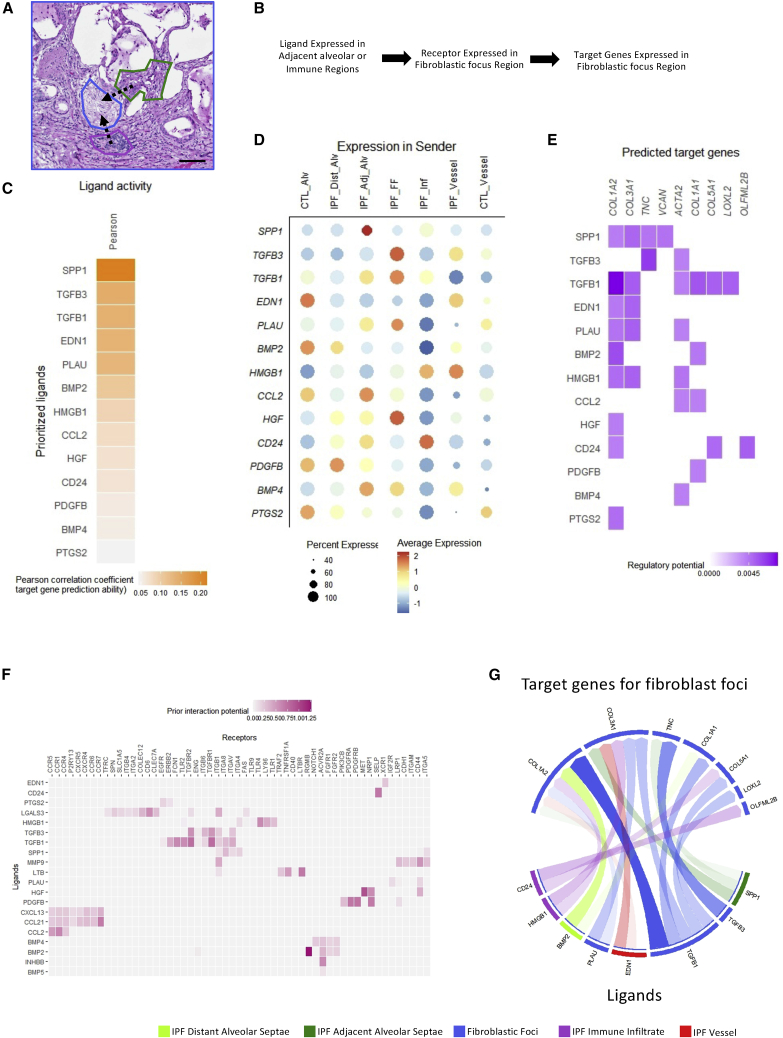
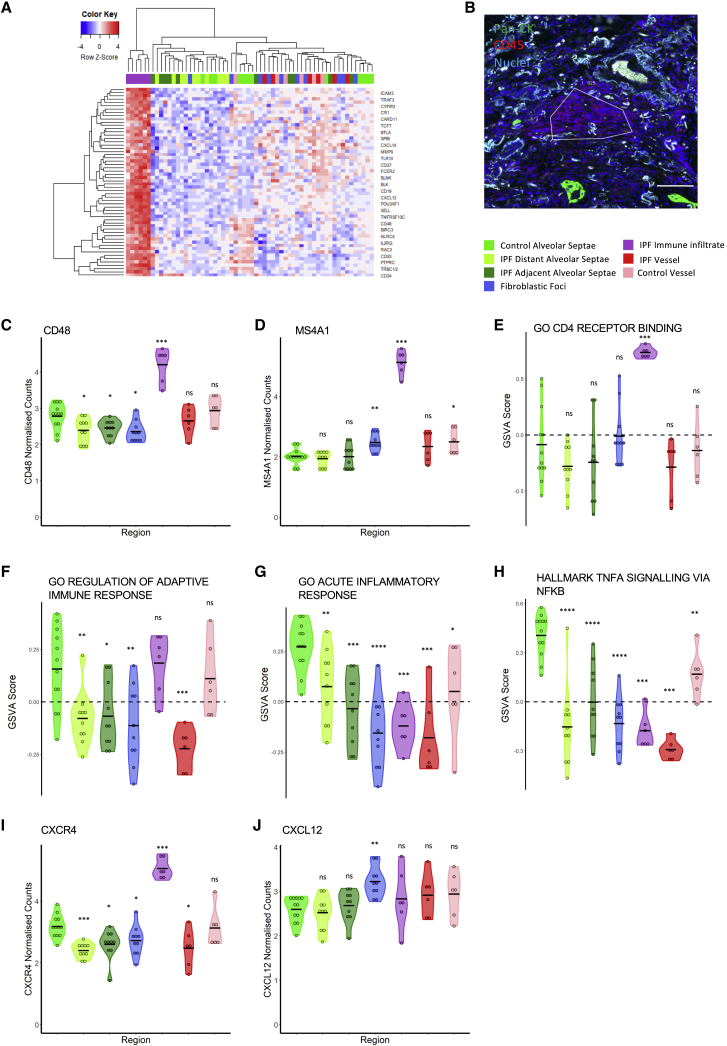
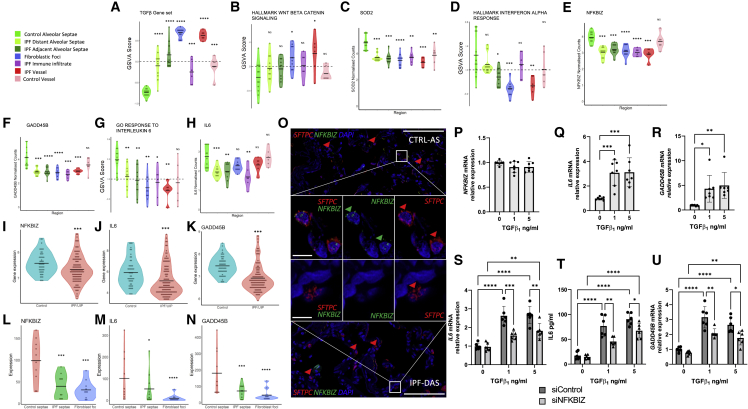
A defining pathological feature of human lung fibrosis is localized tissue heterogeneity, which challenges the interpretation of transcriptomic studies that typically lose spatial information. Here we investigate spatial gene expression in diagnostic tissue using digital profiling technology. We identify distinct, region-specific gene expression signatures as well as shared gene signatures. By integration with single-cell data, we spatially map the cellular composition within and distant from the fibrotic niche, demonstrating discrete changes in homeostatic and pathologic cell populations even in morphologically preserved lung, while through ligand-receptor analysis, we investigate cellular cross-talk within the fibrotic niche. We confirm findings through bioinformatic, tissue, and in vitro analyses, identifying that loss of NFKB inhibitor zeta in alveolar epithelial cells dysregulates the TGFβ/IL-6 signaling axis, which may impair homeostatic responses to environmental stress. Thus, spatially resolved deconvolution advances understanding of cell composition and microenvironment in human lung fibrogenesis.

Keywords: CP: molecular biology; alveolar epithelial cell homeostasis; cellular deconvolution; fibrosis; lung; spatial transcriptomics.


Conflict of interest statement

Declaration of interests D.E.D. is co-founder of, shareholder in, and consultant to Synairgen Research Ltd. D.E.D., M.G.J., and Y.W. acknowledge grants from Boehringer Ingelheim.

Figures

None
Graphical abstract
Figure 1
Figure 1
Overview of study and analytical workflow pathway (A) Schematic showing workflow. (B) Overview of IPF tissue stained for pan-cytokeratin, CD45, and nuclei with areas containing regions of interest highlighted. (C–E) Insets from (B) showing different ROIs. Border colors denote area of (B) taken from, with subsequent hematoxylin and eosin (H&E) staining of the tissue section used for DSP. (F) Control lung tissue with areas containing ROIs highlighted. (G and H) Insets from (F) showing ROIs from control lung tissue, with corresponding H&E staining. Scale bars (B and F), 1 mm. Scale bars (C and D), 100 μm. Scale bars (E and H), 200 μm. Scale bar (G), 500 μm.
Figure 2
Figure 2
Distinct gene expression signatures in spatially resolved regions of lung tissue (A) t-Stochastic nearest neighbor embedding (t-SNE) dimensional reduction plot of each region of interest (ROI). (B–F) Violin plots of gene expression values of cell population marker genes. Statistical comparisons are relative to control alveolar septae. p < 0.05, ∗∗p < 0.01, ∗∗∗p < 0.001, ∗∗∗∗p < 0.0001 by Wilcoxon test with Benjamini-Hochberg multiple test correction. (G) Heatmap showing differentially expressed genes (as measured by a Kruskal-Wallis test; p < 0.05) across dataset, showing clustering of different ROI groups. (H–K) Bubble plots for control and IPF ROIs showing scaled enrichment scores for (H) signaling pathways gene sets, (I) immune regulation gene sets, (J) cell processes gene sets, and (K) metabolism gene sets.
Figure 3
Figure 3
Spatially resolved cell populations in lung fibrosis and control lung tissue (A) Bubble plot showing proportion of cell types in each ROI calculated by spatial deconvolution. (B–E) Proportions of epithelial, endothelial, immune, and mesenchymal cell populations in different ROIs. Representative H&E images are higher magnification of regions visualized in Figure 1. Scale bars, 100 μM.
Figure 4
Figure 4
Gene expression within fibroblast foci (A) Heatmap showing top differentially expressed genes between IPF fibroblastic foci and all other ROIs. (B) TNC expression. (C) CRABP2 expression. (D) COL1A2 expression. (E) COMP expression. (F) Collagen fibril organization GSVA scores. (G) COL4A3 expression. (H) Bone morphogenesis GSVA scores. (I) PLOD2 expression. (J) RUNX1 expression. Statistical comparisons are relative to control alveolar septae. p < 0.05, ∗∗p < 0.01, ∗∗∗p < 0.001, ∗∗∗∗p < 0.0001 by Wilcoxon test with Benjamini-Hochberg multiple test correction. (K) Representative multiplexed RNA in situ hybridization for COMP, COL1A2, and CRABP2 expression with a fibroblastic focus identified by , with the corresponding fibroblast focus () identified by H&E staining on the same tissue section. Scale bar, 100 μm. Inset scale bar, 50 μm.
Figure 5
Figure 5
Ligand-receptor interactions within the fibrotic niche (A) Representative H&E stained IPF lung tissue section of a fibroblast focus, immune infiltrate, and adjacent alveolar septae within the fibrotic niche following digital spatial profiling. Scale bar, 100 μm. (B) Schematic of NicheNet workflow. Nichenet predicts communications based on ligand expression in sender regions, receptor expression in receiver regions, and signaling within the sender regions. (C) Pearson correlation coefficients of ligands and target genes in adjacent ROIs. (D) Dot blot showing mean ligand expression in different ROIs. (E) Regulatory potential of predicted target genes in IPF fibroblastic foci. (F) Receptors expressed within fibrotic foci regions that can potentially bind to ligands found in (C). Heatmap shows the regulatory potential for ligand-receptor pairs based on prior interaction knowledge. (G) Results from (C)–(E) summarized in a circus plot. Arrow transparency indicates regulatory potential between ligand and target gene. Arrows are colored depending on the region in which the ligand is most highly expressed.
Figure 6
Figure 6
Gene expression within immune infiltrates (A) Heatmap showing top differentially expressed genes between IPF immune infiltrates and all other ROIs. (B) Immunofluoresent staining (pan-cytokeratin, CD45, and nuclei) of IPF tissue with an immune infiltrate ROI highlighted. Scale bar, 100 μm. (C and D) Gene expression in ROIs for CD48 (C) and MS4A1 (D). (E–H) Gene set variation analysis (GSVA) scores for ROIs for GO CD4 receptor binding (E), GO regulation of adaptive immune response (F), GO acute inflammatory response (G), and Hallmark TNFA signaling via NFKB (H). (I–J) Expression in ROIs for CXCR4 (I) and CXCL12 (J). Statistical comparisons are relative to control alveolar septae. p < 0.05, ∗∗p < 0.01, ∗∗∗p < 0.001, ∗∗∗∗p < 0.0001 by Wilcoxon test with Benjamini-Hochberg multiple test correction.
Figure 7
Figure 7
Loss of NFKBIZ dysregulates the IL-6 axis (A and B) GSVA scores for TGFβ or WNT signaling as indicated for different ROIs. (C) Expression in ROIs for SOD2. (D) GSVA scores for different ROIs for hallmark interferon alpha response. (E and F) Expression in ROIs for NFKBIZ (E) and GADD45B (F). (G) GSVA scores for different ROIs for GOresponse to interleukin 6. (H) Expression in ROIs for IL6. (I–K). Expression of NFKBIZ (I), IL6 (J), and GADD45B (K) in GSE32537. (L–N) Expression of NFKBIZ (L), IL6 (M), and GADD45B (N) in GSE169500. Statistical comparisons are relative to control alveolar septae. p < 0.05, ∗∗p < 0.01, ∗∗∗p < 0.001, ∗∗∗∗p < 0.0001 by Wilcoxon test with Benjamini-Hochberg multiple test correction. (O) Representative multiplexed RNA in situ hybridization for SFTPC and NFKBIZ expression in control alveolar septae and IPF distal alveolar septae. Scale bar, 100 μm; inset scale bar, 10 μm. (P–R) Type 2 alveolar epithelial cells were treated with TGFβ or vehicle control as indicated for 24 hr. Relative gene expression of NFKBIZ (P), IL6 (Q), and GADD45B (R) determined by qRT-PCR and analyzed using ΔΔCt method. Data are mean ± SD; n = 7 across three independent experiments. p < 0.05, ∗∗p < 0.01, ∗∗∗p < 0.001 by two-way ANOVA with Tukey’s multiple comparison test. (S–U) Type 2 alveolar epithelial cells were transfected with NFKBIZ targeting siRNA or control siRNA for 48 hr followed by treatment for 24 hr with TGFβ or vehicle control as indicated. (S) Relative gene expression of IL6 measured as in (Q). (T) IL-6 protein in conditioned media quantified by ELISA. (U) Relative gene expression of GADD45B measured as in (T). Data are mean ± SD; n = 6 across three independent experiments. p < 0.05, ∗∗p < 0.01, ∗∗∗p < 0.001, ∗∗∗∗p < 0.0001 by two-way ANOVA with Tukey’s multiple comparison test.

References

    1. Adams T.S., Schupp J.C., Poli S., Ayaub E.A., Neumark N., Ahangari F., Chu S.G., Raby B.A., DeIuliis G., Januszyk M., et al. Single-cell RNA-seq reveals ectopic and aberrant lung-resident cell populations in idiopathic pulmonary fibrosis. Sci. Adv. 2020;6 doi: 10.1126/sciadv.aba1983. - DOI - PMC - PubMed
    1. Ahn J.-H., Cho J., Kwon B.-E., Lee G.-S., Yoon S.I., Kang S.G., Kim P.-H., Kweon M.-N., Yang H., Vallance B.A., et al. IκBζ facilitates protective immunity against Salmonella infection via Th1 differentiation and IgG production. Sci. Rep. 2019;9:8397. doi: 10.1038/s41598-019-44019-3. - DOI - PMC - PubMed
    1. Ali M.N., Mori M., Mertens T.C.J., Siddhuraj P., Erjefält J.S., Önnerfjord P., Hiemstra P.S., Egesten A. Osteopontin expression in small airway epithelium in copd is dependent on differentiation and confined to subsets of cells. Sci. Rep. 2019;9 doi: 10.1038/s41598-019-52208-3. - DOI - PMC - PubMed
    1. Arriazu E., Ge X., Leung T.-M., Magdaleno F., Lopategi A., Lu Y., Kitamura N., Urtasun R., Theise N., Antoine D.J., Nieto N. Signalling via the osteopontin and high mobility group box-1 axis drives the fibrogenic response to liver injury. Gut. 2017;66:1123–1137. doi: 10.1136/gutjnl-2015-310752. - DOI - PMC - PubMed
    1. Aspal M., Zemans R.L. Mechanisms of ATII-to-ATI cell differentiation during lung regeneration. Int. J. Mol. Sci. 2020;21:E3188. doi: 10.3390/ijms21093188. - DOI - PMC - PubMed

Publication types