. 2022 Aug 16;40(7):111228.
doi: 10.1016/j.celrep.2022.111228.

Striatonigrostriatal circuit architecture for disinhibition of dopamine signaling

Affiliations

Striatonigrostriatal circuit architecture for disinhibition of dopamine signaling

Priscilla Ambrosi et al. Cell Rep. .

Abstract

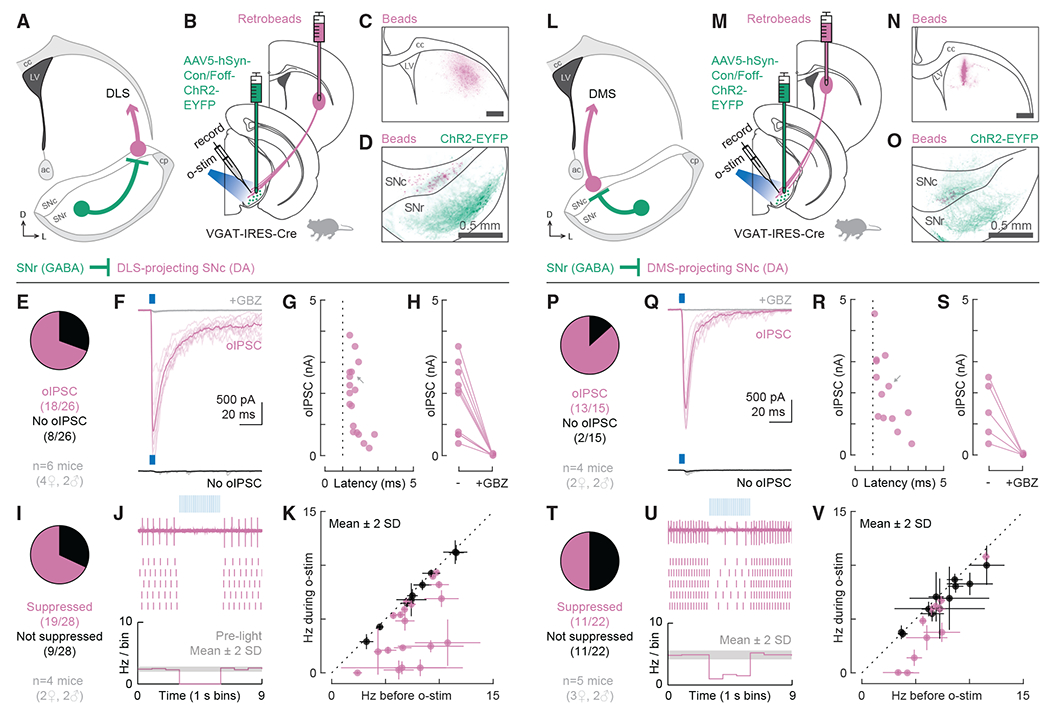
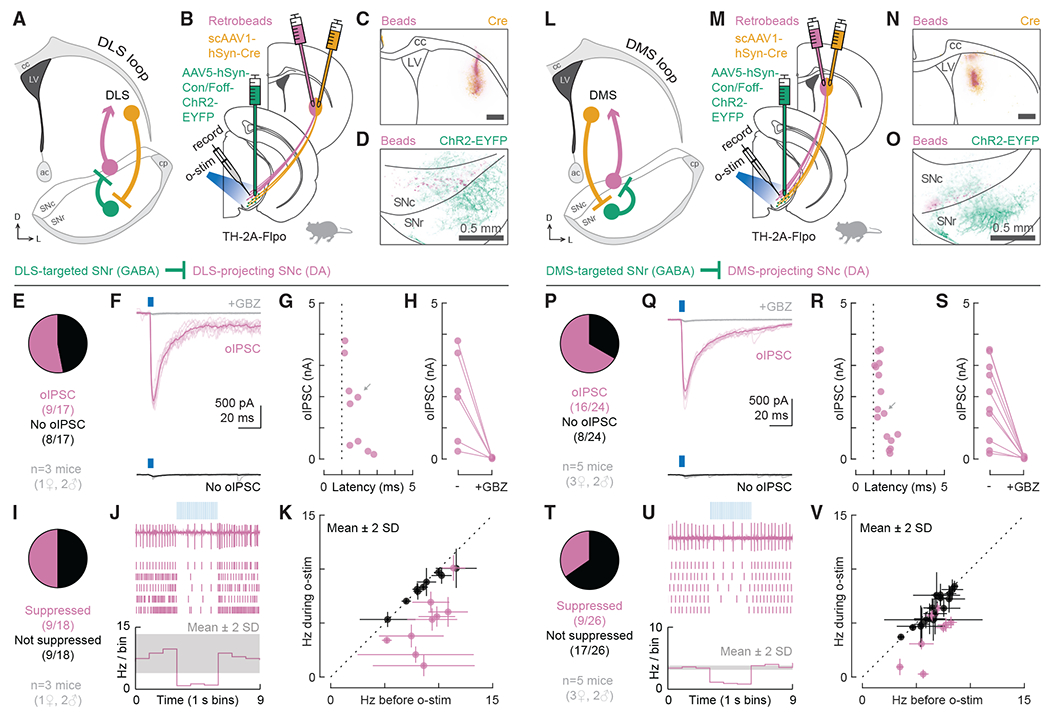
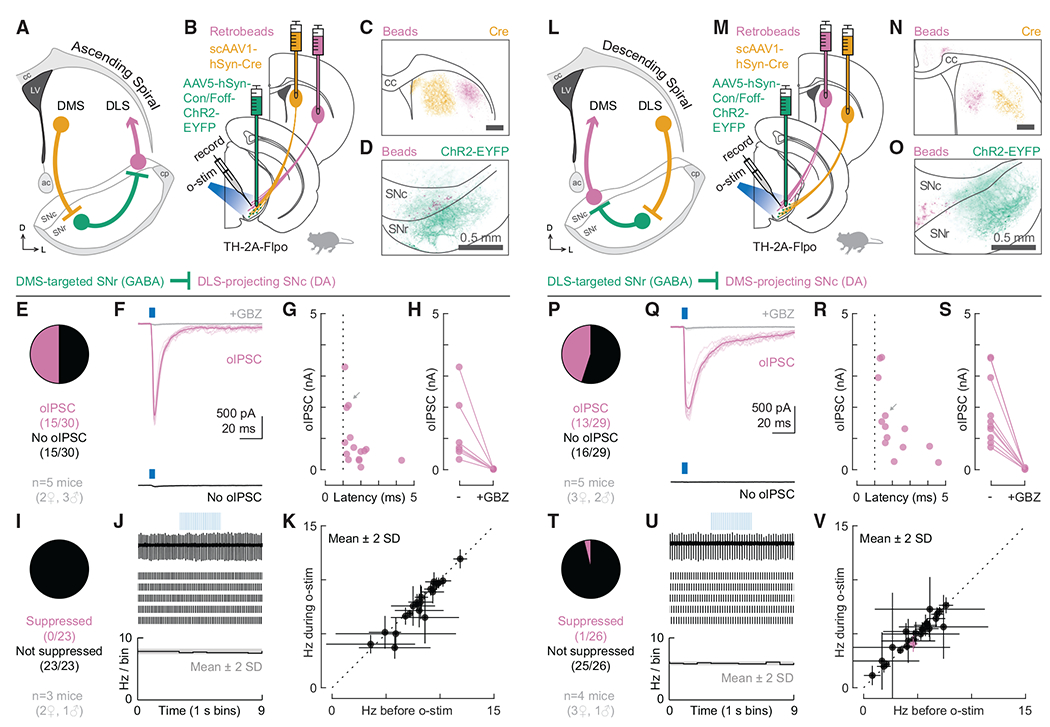
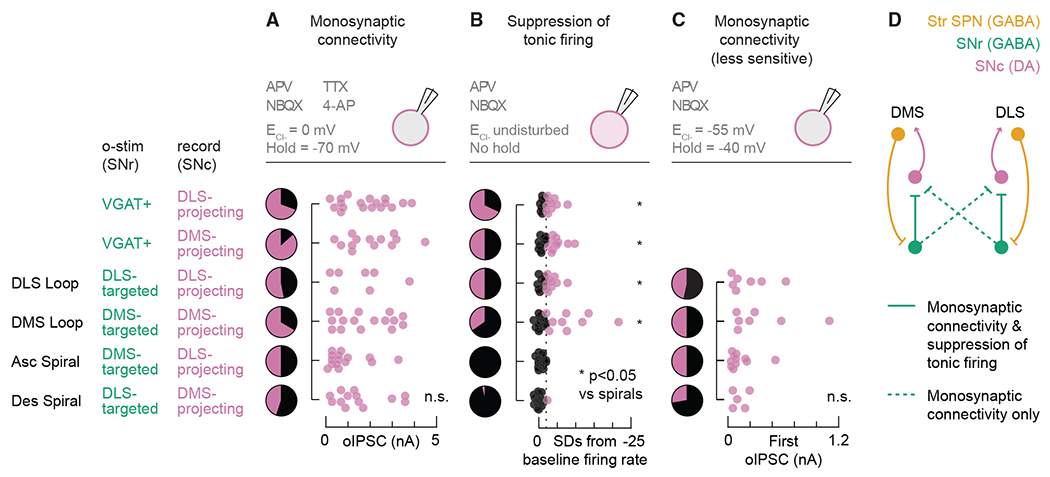
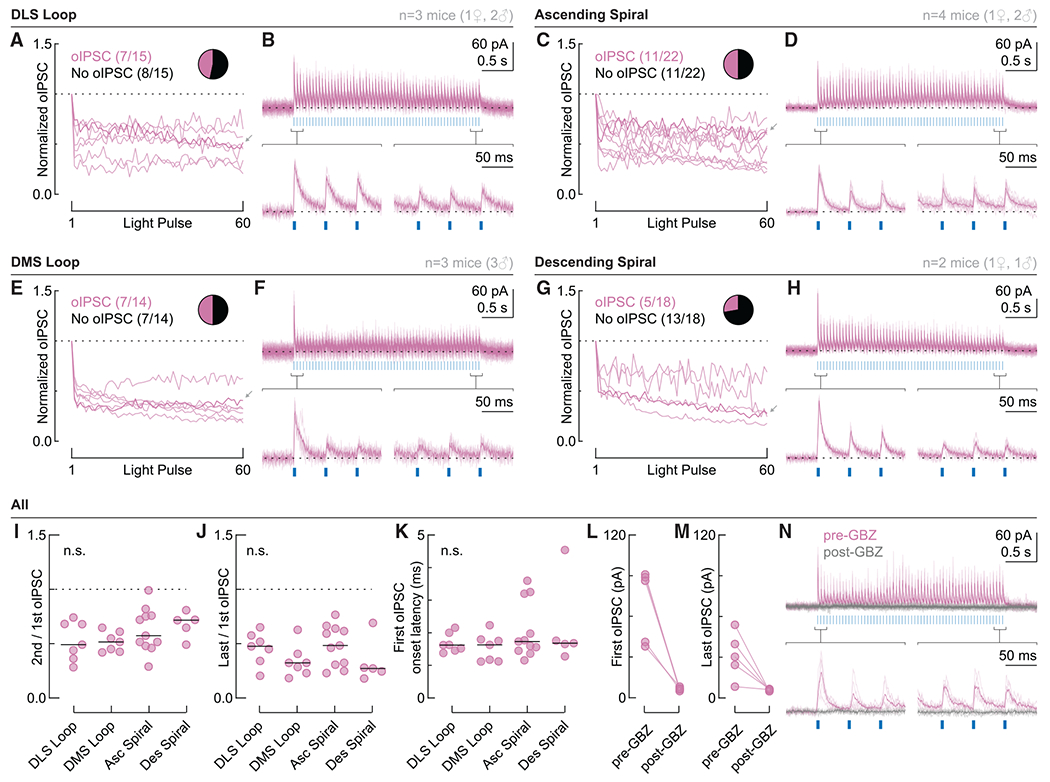
The basal ganglia operate largely in closed parallel loops, including an associative circuit for goal-directed behavior originating from the dorsomedial striatum (DMS) and a somatosensory circuit important for habit formation originating from the dorsolateral striatum (DLS). An exception to this parallel circuit organization has been proposed to explain how information might be transferred between striatal subregions, for example, from the DMS to the DLS during habit formation. The "ascending spiral hypothesis" proposes that the DMS disinhibits dopamine signaling in the DLS through a tri-synaptic, open-loop striatonigrostriatal circuit. Here, we use transsynaptic and intersectional genetic tools to investigate both closed- and open-loop striatonigrostriatal circuits. We find strong evidence for closed loops, which would allow striatal subregions to regulate their own dopamine release. We also find evidence for functional synapses in open loops. However, these synapses are unable to modulate tonic dopamine neuron firing, questioning the prominence of their role in mediating crosstalk between striatal subregions.

Keywords: CP: Neuroscience; ascending spiral; disinhibition; dopamine; striatonigrostriatal; striatum; substantia nigra.


Conflict of interest statement

Declaration of interests The authors declare no competing interests.

Figures

Figure 1.
Figure 1.. VGAT+ cells in SNr monosynaptically inhibit DLS- and DMS-projecting DA neurons in SNc and suppress their tonic firing
(A) Schematic of the tested circuit. Anatomical landmarks: corpus callosum (cc), lateral ventricle (LV), anterior commissure (ac), cerebral peduncle (cp). (B) Experimental design for probing the connection between VGAT+ cells in the SNr and DLS-projecting DA neurons in the SNc. In VGAT-IRES-Cre mice, AAV5-hSyn-Con/Foff-ChR2-EYFP was injected into the SNr to deliver the excitatory opsin ChR2 to VGAT+ cells. Retrobeads were injected into the DLS to label DLS-projecting DA neurons in the SNc for recording. Optogenetic stimulation (o-stim) was delivered via the objective (475 nm, ~10 mW/mm2). (C) Distribution of retrobeads (magenta) in a representative striatum slice. Scale bar: 0.5 mm. (D) Distribution of bead-labeled somas (magenta) and ChR2-EYFP-labeled neuropil (green) in a representative midbrain slice. The SNc was outlined based on TH immunolabeling. (E) Proportion of DLS-projecting neurons that did (magenta, n = 18) or did not (black, n = 8) respond to o-stim with an optogenetically evoked inhibitory post-synaptic current (oIPSC; n = 26 cells from 6 mice). (F) Example cells for (E). The oIPSC was absent after gabazine (GBZ) perfusion (gray). Thin lines: individual sweeps. Thick lines: average across sweeps. (G) oIPSC amplitude and onset latency for all responding cells (dotted line = 1 ms). Gray arrow: oIPSC shown in (F). (H) oIPSC amplitude before and after GBZ perfusion for all tested cells. (I) Proportion of DLS-projecting neurons that did (magenta, n = 19) or did not (black, n = 9) have their tonic firing suppressed by o-stim (n = 28 cells from 4 mice). (J) Example recordings for (I). Top: data from a single sweep. Middle: raster plot showing action potentials from 5 sweeps. Bottom: histogram of the average firing rate across all sweeps. The gray shaded area indicates mean ± 2 SDs of the baseline firing rate. (K) Average firing rate during versus before o-stim for all cells from (I) (suppressed cells: magenta; not suppressed: black). Error bars represent ± 2 SDs. Dotted line: unity. (L–V) Same as (A)–(K) but for testing the connection between VGAT+ cells in the SNr and DMS-projecting DA neurons in the SNc. (P–S) 15 cells from 4 mice. (T–V) 22 cells from 5 mice. See also Figure S1.
Figure 2.
Figure 2.. Viral strategy used for polysynaptic circuit dissection
(A) Experimental design for labeling DMS-targeted non-dopaminergic neurons in the SNr. scAAV1-hSyn-Cre injected into the DMS moves trans-synaptically in the anterograde direction to deliver Cre to DMS-targeted neurons. AAV5-hSyn-Con/Foff-EYFP is injected into the SNr to deliver EYFP to cells that are both Cre+ and Flp−. (B) Schematic of the resulting EYFP labeling in a WT mouse (all cells are Flp−; both GABA and DA cells may be Cre+). (C) Schematic of the resulting EYFP labeling in a TH-2A-Flpo mouse (DA cells are Flp+; only DMS-targeted, non-DA cells are Flp− and Cre+). (D and E) Example histology from the striatum (top row) and the SN (bottom row) after injections in WT (D) and TH-2A-Flpo (E) mice. Scale bar: 0.5 mm. See also Figure S2.
Figure 3.
Figure 3.. DLS- and DMS-targeted GABAergic cells in SNr monosynaptically inhibit DLS- and DMS-projecting DA neurons in SNc, respectively, and suppress their tonic firing
(A) Schematic of the DLS loop. (B) Experimental design for probing the connection between DLS-targeted GABAergic cells in the SNr and DLS-projecting DA neurons in the SNc. In TH-2A-Flpo mice, scAAV1-hSyn-Cre was injected into the DLS to label DLS-targeted cells with Cre. AAV5-hSyn-Con/Foff-ChR2-EYFP was injected into the SNr to deliver ChR2 to cells carrying Cre but not Flp. Retrobeads were injected into the DLS to label DLS-projecting DA neurons in the SNc for recording. (C) Distribution of retrobeads (magenta) and Cre (yellow) in a representative striatum slice. Scale bar: 0.5 mm. (D) Distribution of bead-labeled somas (magenta) and ChR2-EYFP-labeled neuropil (green) in a representative midbrain slice. (E) Proportion of DLS-projecting neurons that did (magenta, n = 9) or did not (black, n = 8) respond to o-stim with an oIPSC (n = 17 cells from 3 mice). (F) Example cells for (E). (G) oIPSC amplitude and onset latency for all responding cells. Gray arrow: oIPSC shown in (F). (H) oIPSC amplitude before and after GBZ perfusion. (I) Proportion of DLS-projecting neurons that did (magenta, n = 9) or did not (black, n = 9) have their tonic firing suppressed by o-stim (n = 18 cells from 3 mice). (J) Example cell for (I). Top: data from a single sweep. Middle: raster plot showing action potentials from 5 sweeps. Bottom: average firing rate across all sweeps. The gray shaded area indicates mean ± 2 SDs of the baseline firing rate. (K) Average firing rate during versus before o-stim for all cells from (I). Error bars represent ± 2 SDs. Dotted line: unity. (L–V) Same as (A)–(K) but for testing the DMS loop. (P–S) 24 cells from 5 mice. (T–V) 26 cells from 5 mice. See also Figure S3.
Figure 4.
Figure 4.. DMS- and DLS-targeted GABAergic cells in SNr monosynaptically inhibit DLS- and DMS-projecting DA neurons in SNc, respectively, but do not suppress their tonic firing
(A) Schematic of the ascending spiral. (B) Experimental design for probing the connection between DMS-targeted GABAergic cells in the SNr and DLS-projecting DA neurons in the SNc. (C) Distribution of retrobeads (magenta) and Cre (yellow) in a representative striatum slice. Scale bar: 0.5 mm. (D) Distribution of bead-labeled somas (magenta) and ChR2-EYFP-labeled neuropil (green) in a representative midbrain slice. (E) Proportion of DLS-projecting neurons that did (magenta, n = 15) or did not (black, n = 15) respond to o-stim with an oIPSC (n = 30 cells from 5 mice). (F) Example cells for (E). (G) oIPSC amplitude and onset latency for all responding cells. Gray arrow: oIPSC shown in (F). (H) oIPSC amplitude before and after GBZ perfusion. (I) Proportion of DLS-projecting neurons that did (magenta, n = 0)or did not (black, n = 23) have their tonic firing suppressed by o-stim (n = 23 cells from 3 mice). (J) Example cell for (I). Top: data from a single sweep. Middle: raster plot showing action potentials from 5 sweeps. Bottom: average firing rate across all sweeps. The gray shaded area indicates mean ± 2 SDs of the baseline firing rate. (K) Average firing rate during versus before o-stim for all cells from (I). Error bars represent ± 2 SDs. Dotted line: unity. (L–V) Same as (A)–(K) but for testing the descending spiral. (P–S) 29 cells from 5 mice. (T–V) 26 cells from 4 mice. See also Figure S4.
Figure 5.
Figure 5.. Closed loops are supported by monosynaptic connectivity and suppression of tonic firing, while open spirals are supported by monosynaptic connectivity only
(A–C)Top: recording configuration. Pie charts: proportion of bead-labeled neurons that did (magenta) or did not (black) respond to o-stim. Scatterplots: (A and C) oIPSC amplitude or (B) change in tonic firing rate from baseline. Dotted line: −2 SDs. n.s., not significant. *p < 0.05 versus ascending spiral and versus descending spiral. (A and B) Data reproduced from Figures 1, 3, and 4. (C) For cell and mouse numbers, see Figure 6. (D) Circuit diagram supported by the data.
Figure 6.
Figure 6.. Pre-synaptic release probability does not explain differences between closed loops and open spirals
(A and B) DLS loop dataset. (A) Normalized oIPSC amplitude for bead-labeled neurons that responded to o-stim (20 Hz, 3 s; n = 7 cells from 3 mice). Dotted line: 1. Insert: proportion of bead-labeled neurons that did (magenta, n = 7) or did not (black, n = 8) respond to o-stim. Gray arrow: example cell shown in (B). (B) Example cell with a zoom in of the first and last three oIPSCs. Thin lines: individual sweeps. Thick lines: average across sweeps. Dotted line: baseline. (C and D) Same as (A) and (B) but for the ascending spiral (n = 22 cells–11 responding to o-stim–from 4 mice). (E and F) Same as (A) and (B) but for the DMS loop (n = 14 cells–7 responding to o-stim–from 3 mice). (G and H) Same as (A) and (B) but for the descending spiral (n = 18 cells–5 responding to o-stim–from 2 mice). (I) Ratio between the second and first oIPSC. (J) Ratio between the last and first oIPSC. (K) Onset latency of the first oIPSC. Black bars in (I)–(K) indicate the median. n.s., not significant. (L and M) First (L) and last (M) oIPSC amplitude before and after GBZ perfusion for all tested cells. (N) Example recording before (magenta) and after (gray) GBZ perfusion.

Similar articles

Cited by

References

    1. Alexander GE, DeLong MR, and Strick PL (1986). Parallel organization of functionally segregated circuits linking basal ganglia and cortex. Annu. Rev. Neurosci 9, 357–381. 10.1146/annurev.ne.09.030186.002041. - DOI - PubMed
    1. Aoki S, Smith JB, Li H, Yan X, Igarashi M, Coulon P, Wickens JR, Ruigrok TJ, and Jin X (2019). An open cortico-basal ganglia loop allows limbic control over motor output via the nigrothalamic pathway. Elife 8, e49995. 10.7554/eLife.49995. - DOI - PMC - PubMed
    1. Belin D, and Everitt BJ (2008). Cocaine seeking habits depend upon dopamine-dependent serial connectivity linking the ventral with the dorsal striatum. Neuron 57, 432–441. 10.1016/j.neuron.2007.12.019. - DOI - PubMed
    1. Brown HD, McCutcheon JE, Cone JJ, Ragozzino ME, and Roitman MF (2011). Primary food reward and reward-predictive stimuli evoke different patterns of phasic dopamine signaling throughout the striatum. Eur. J. Neurosci 34, 1997–2006. 10.1111/j.1460-9568.2011.07914.x. - DOI - PMC - PubMed
    1. Burke DA, Rotstein HG, and Alvarez VA (2017). Striatal local circuitry: a new framework for lateral inhibition. Neuron 96, 267–284. 10.1016/j.neuron.2017.09.019. - DOI - PMC - PubMed

Publication types