. 2022 Aug 16;40(7):111187.
doi: 10.1016/j.celrep.2022.111187.

Multiomics assessment of dietary protein titration reveals altered hepatic glucose utilization

Affiliations

Multiomics assessment of dietary protein titration reveals altered hepatic glucose utilization

Michael R MacArthur et al. Cell Rep. .

Abstract

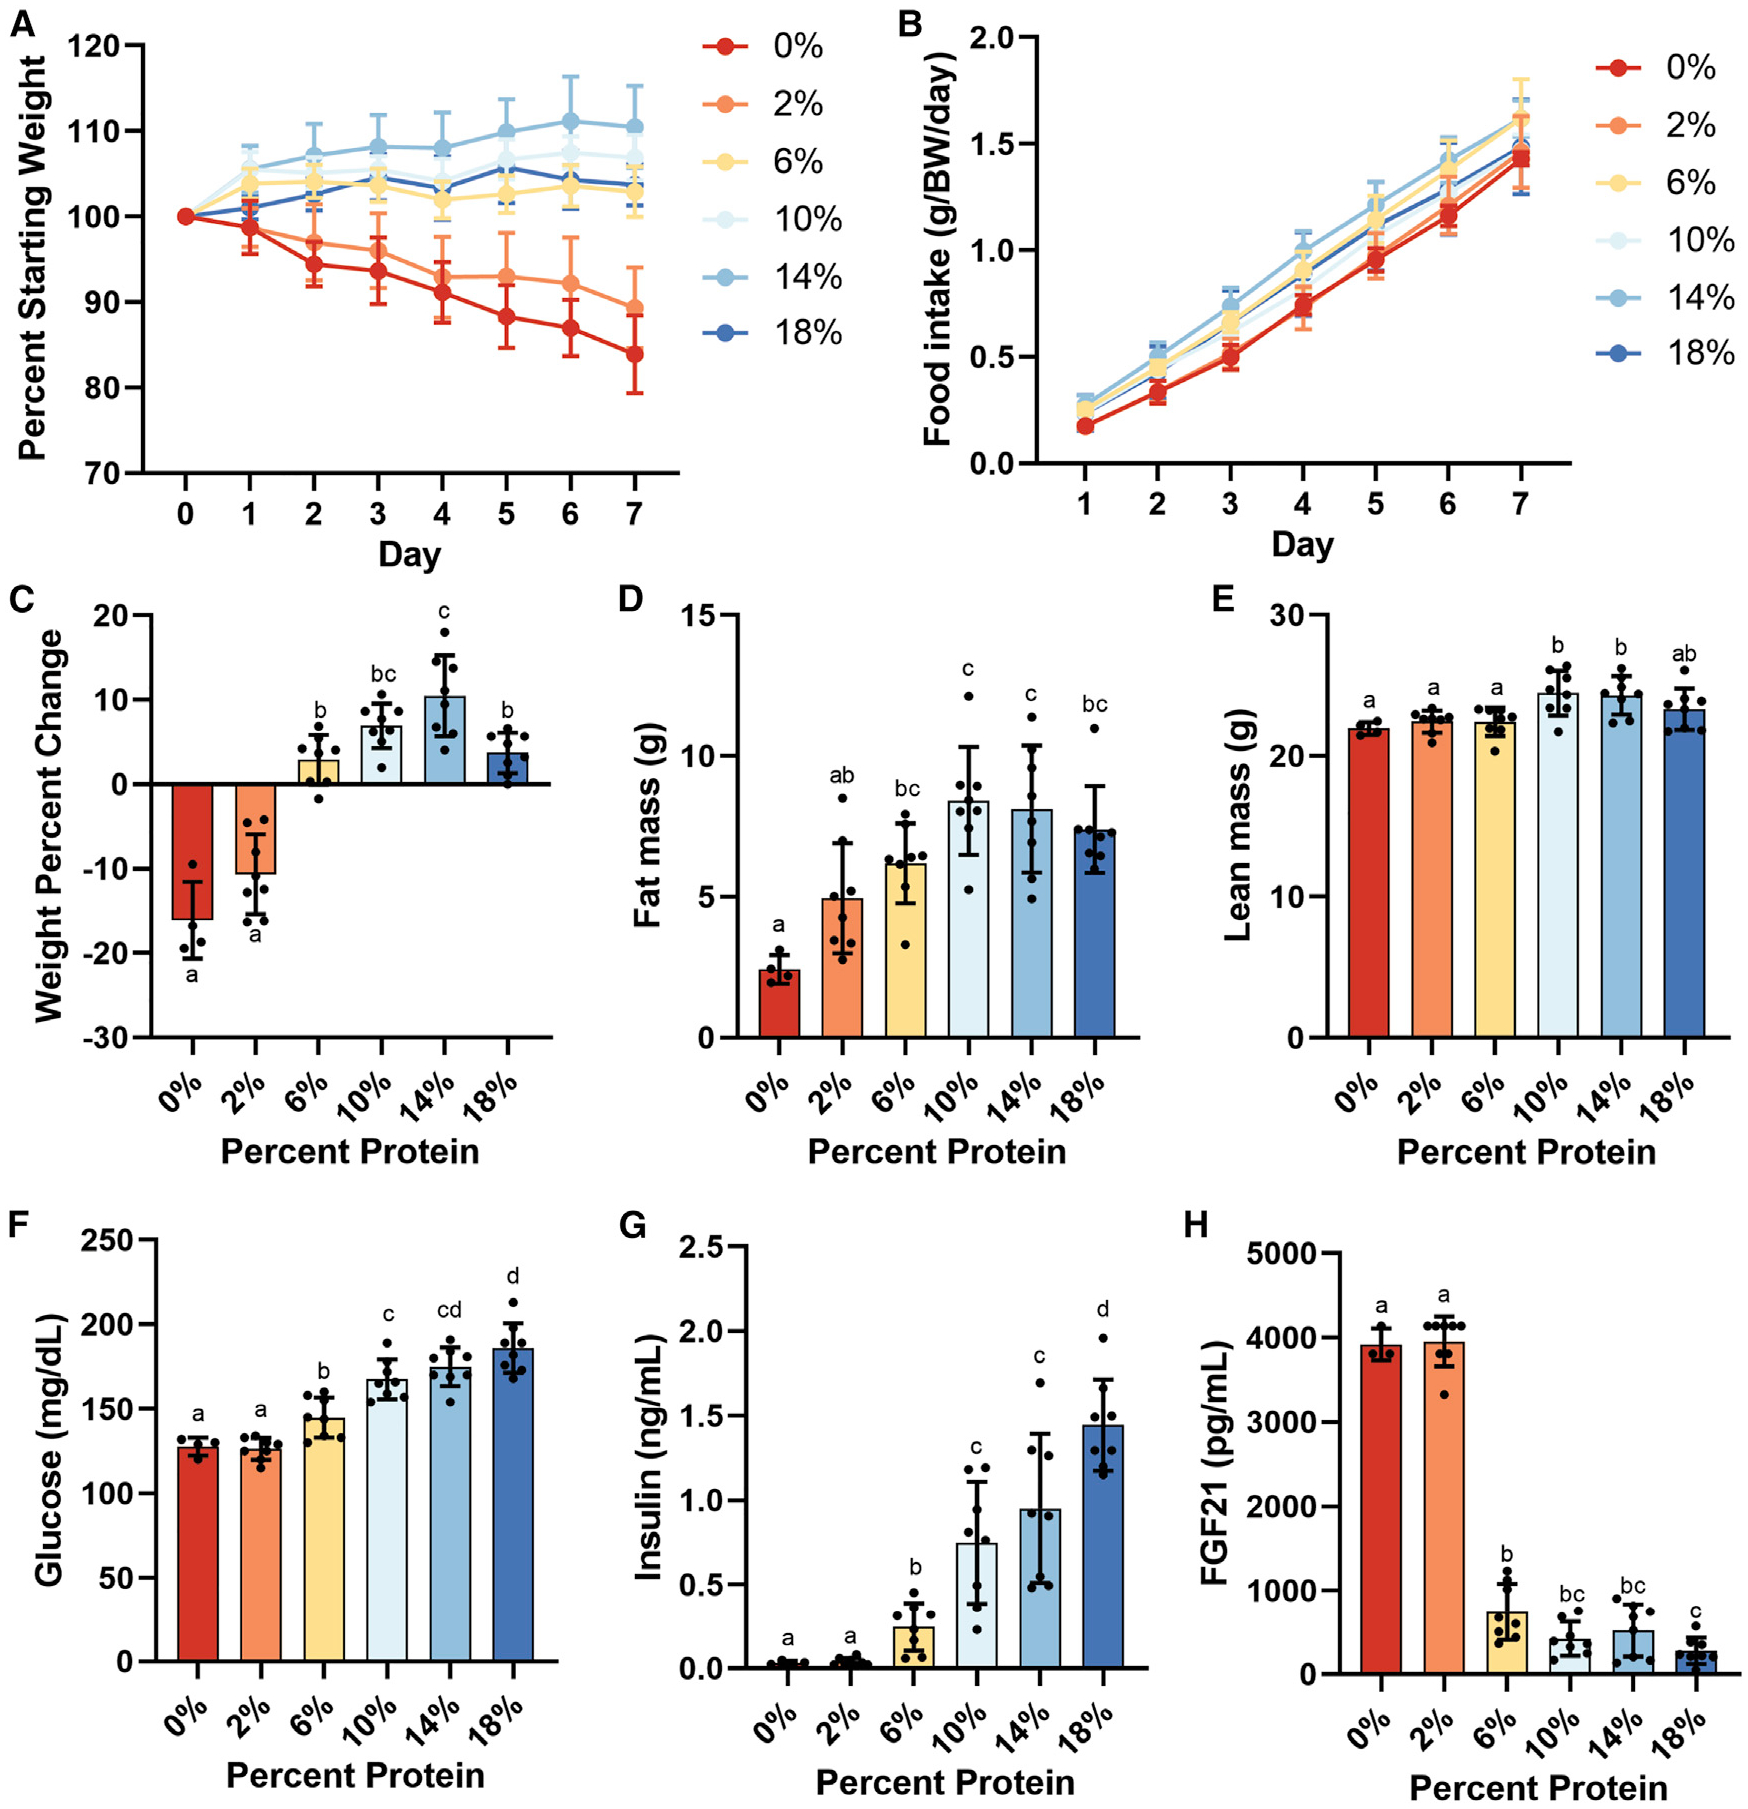
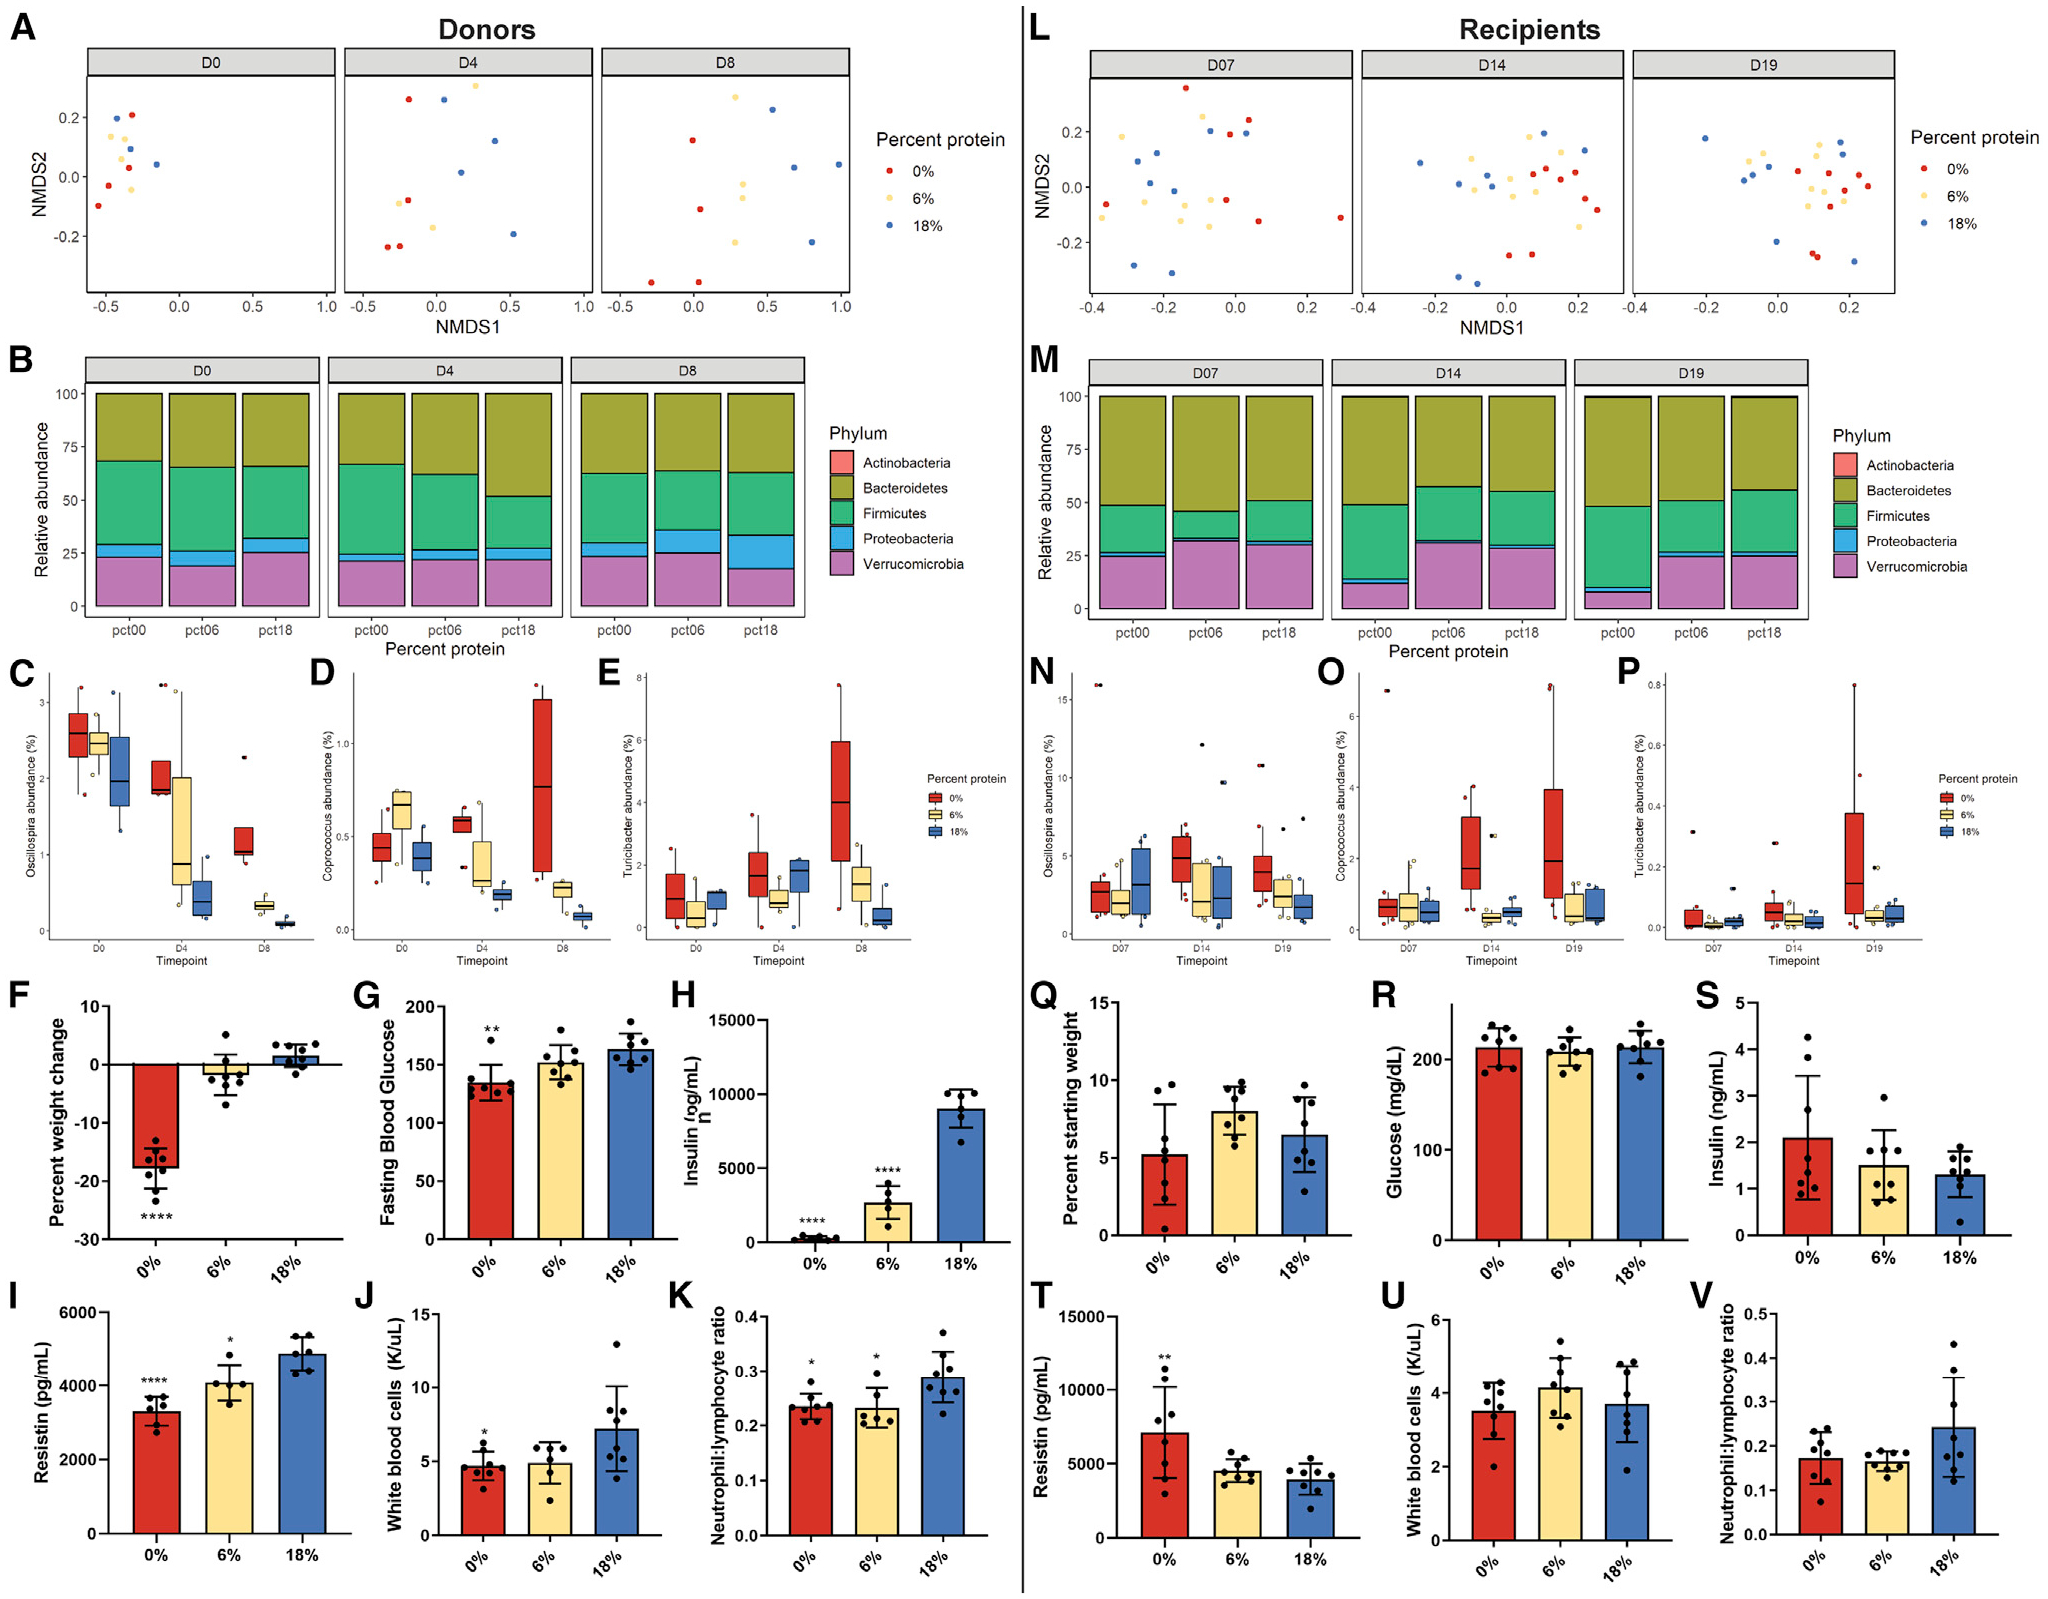
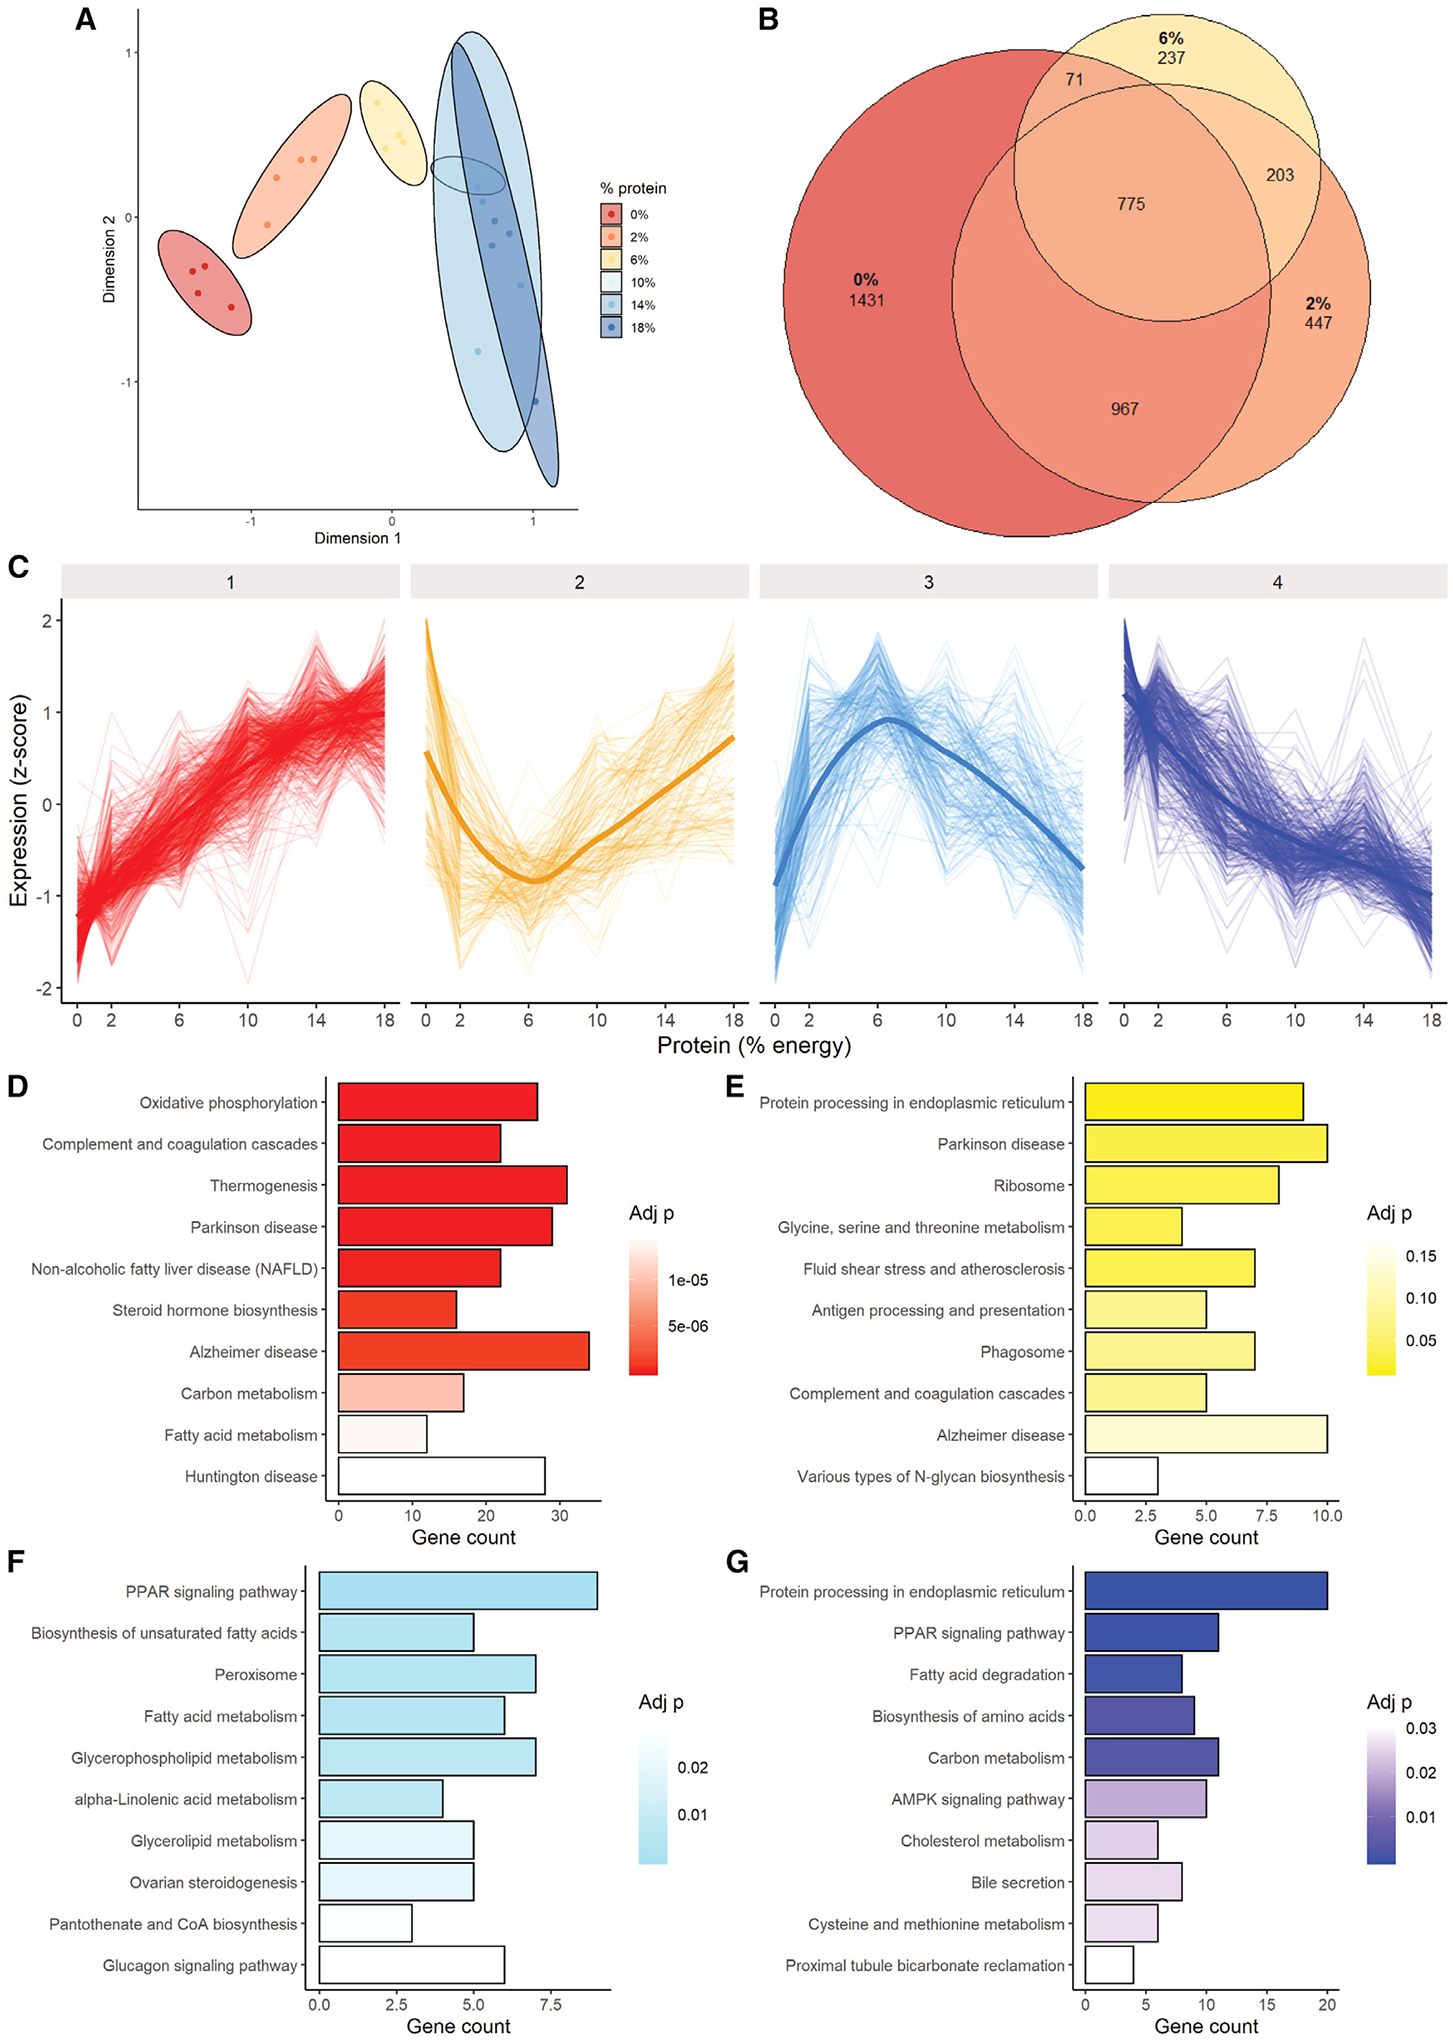
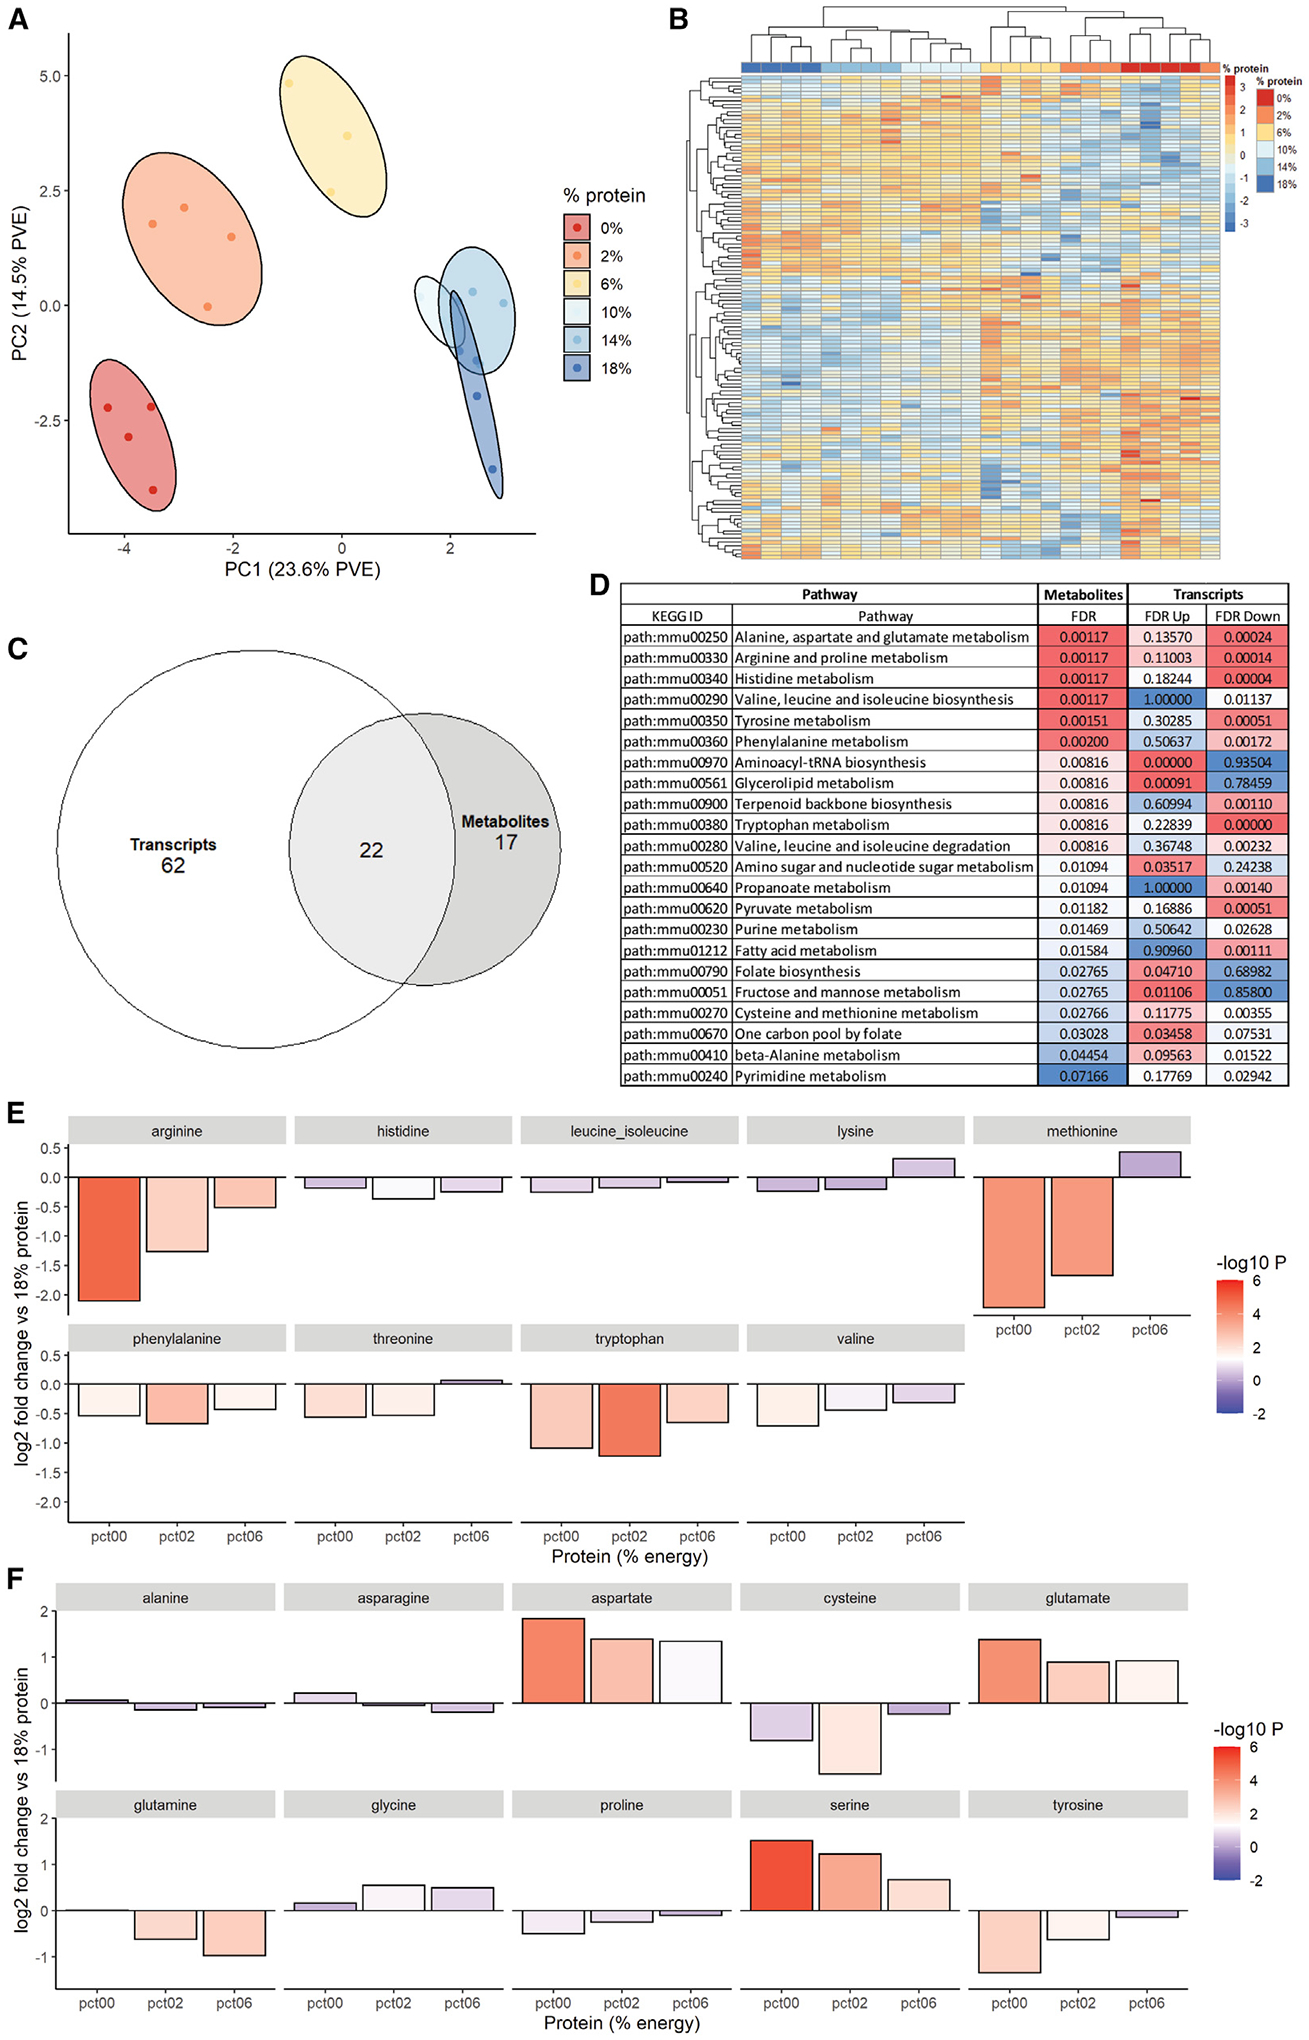
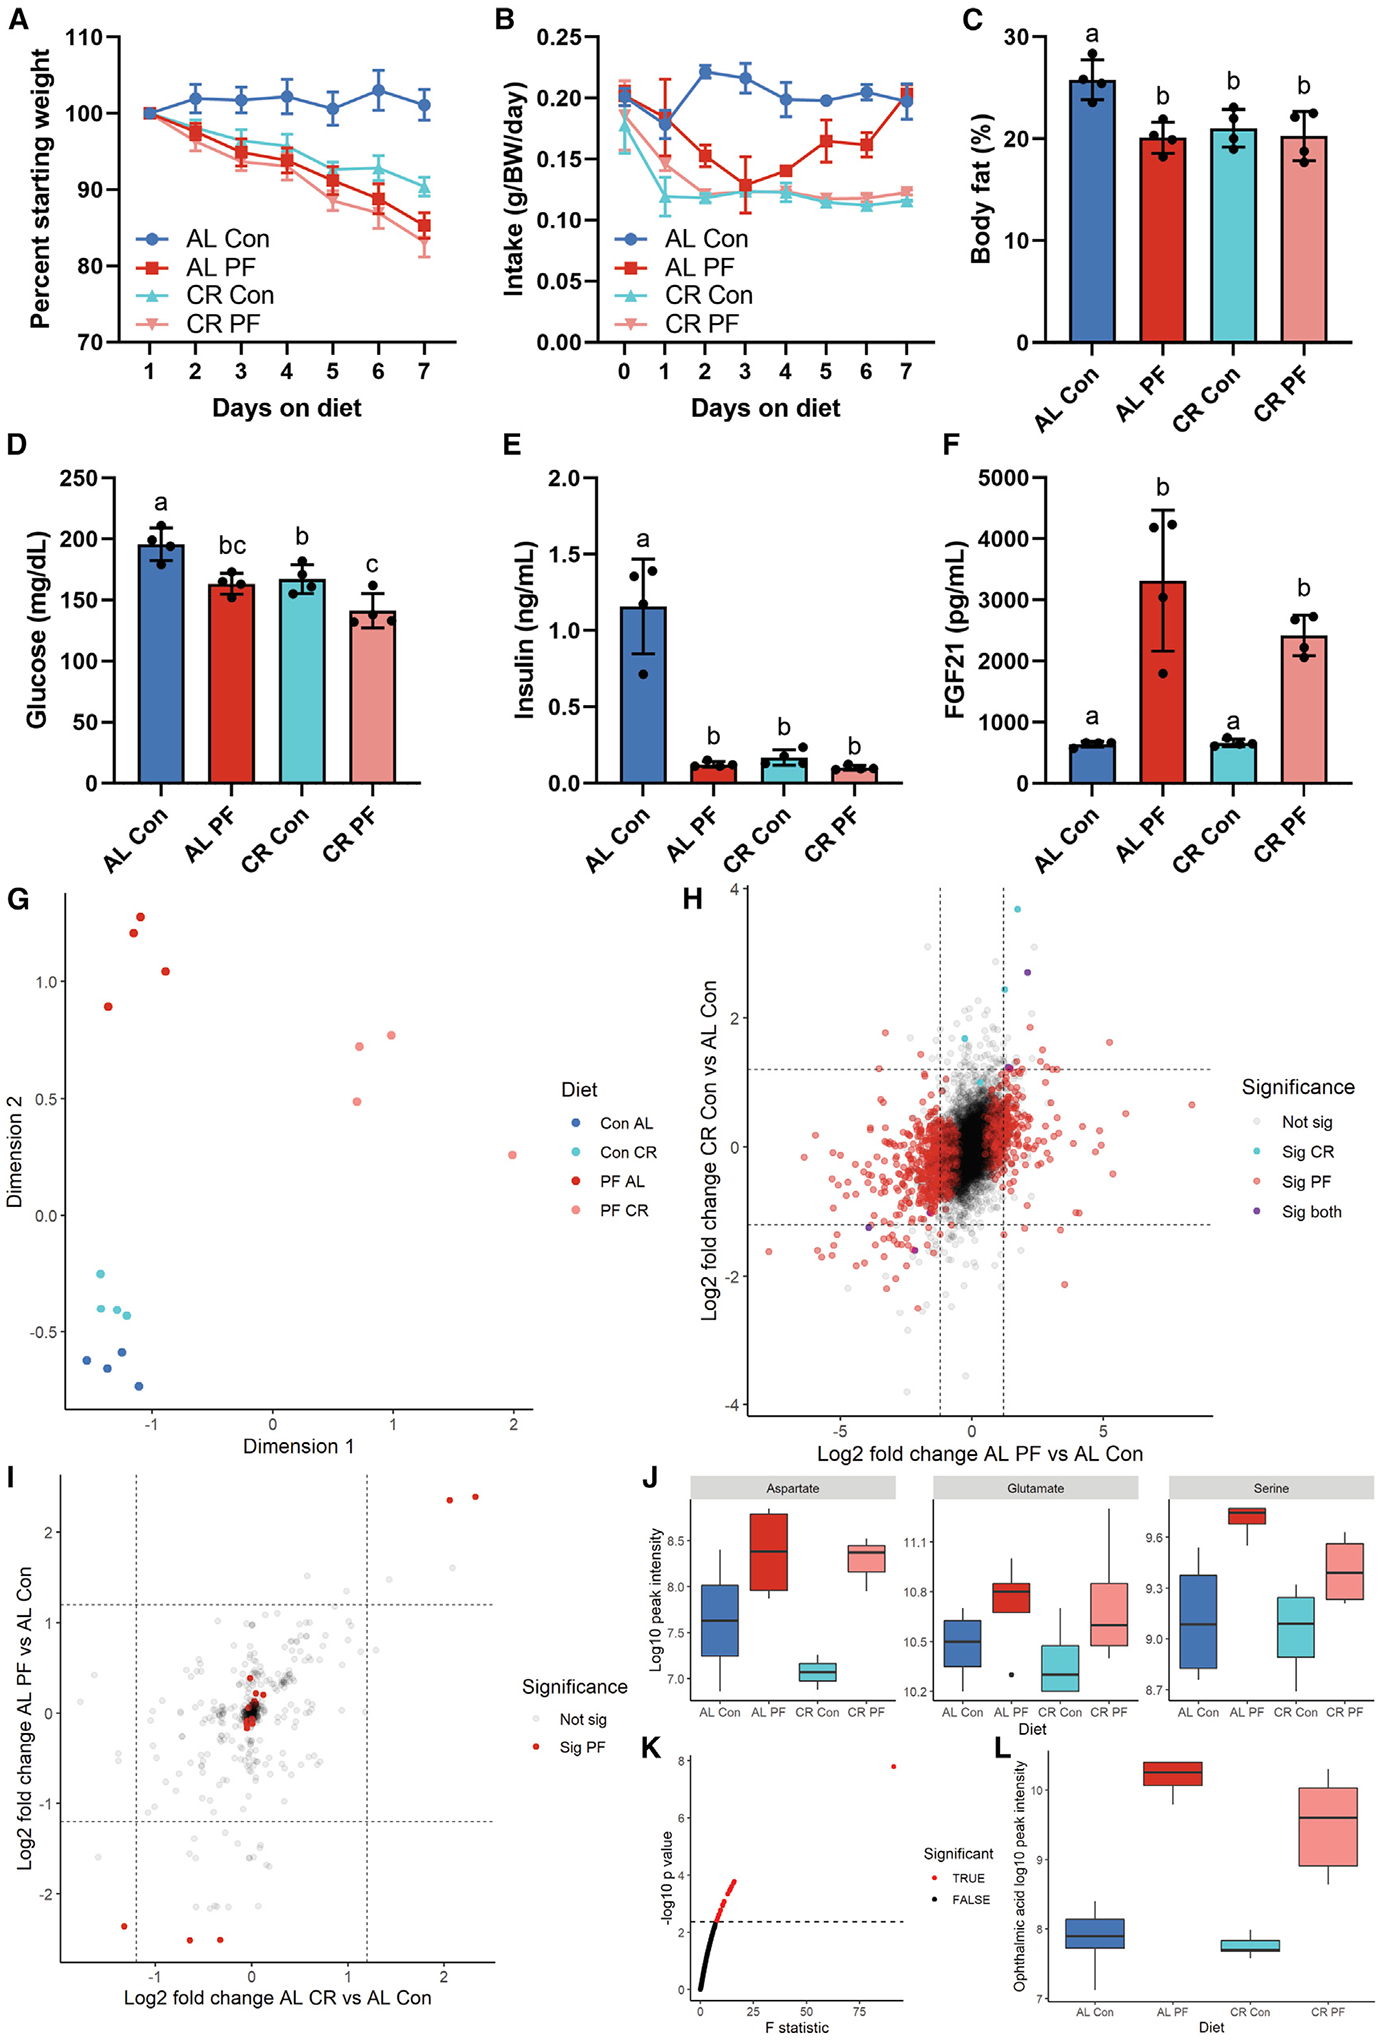
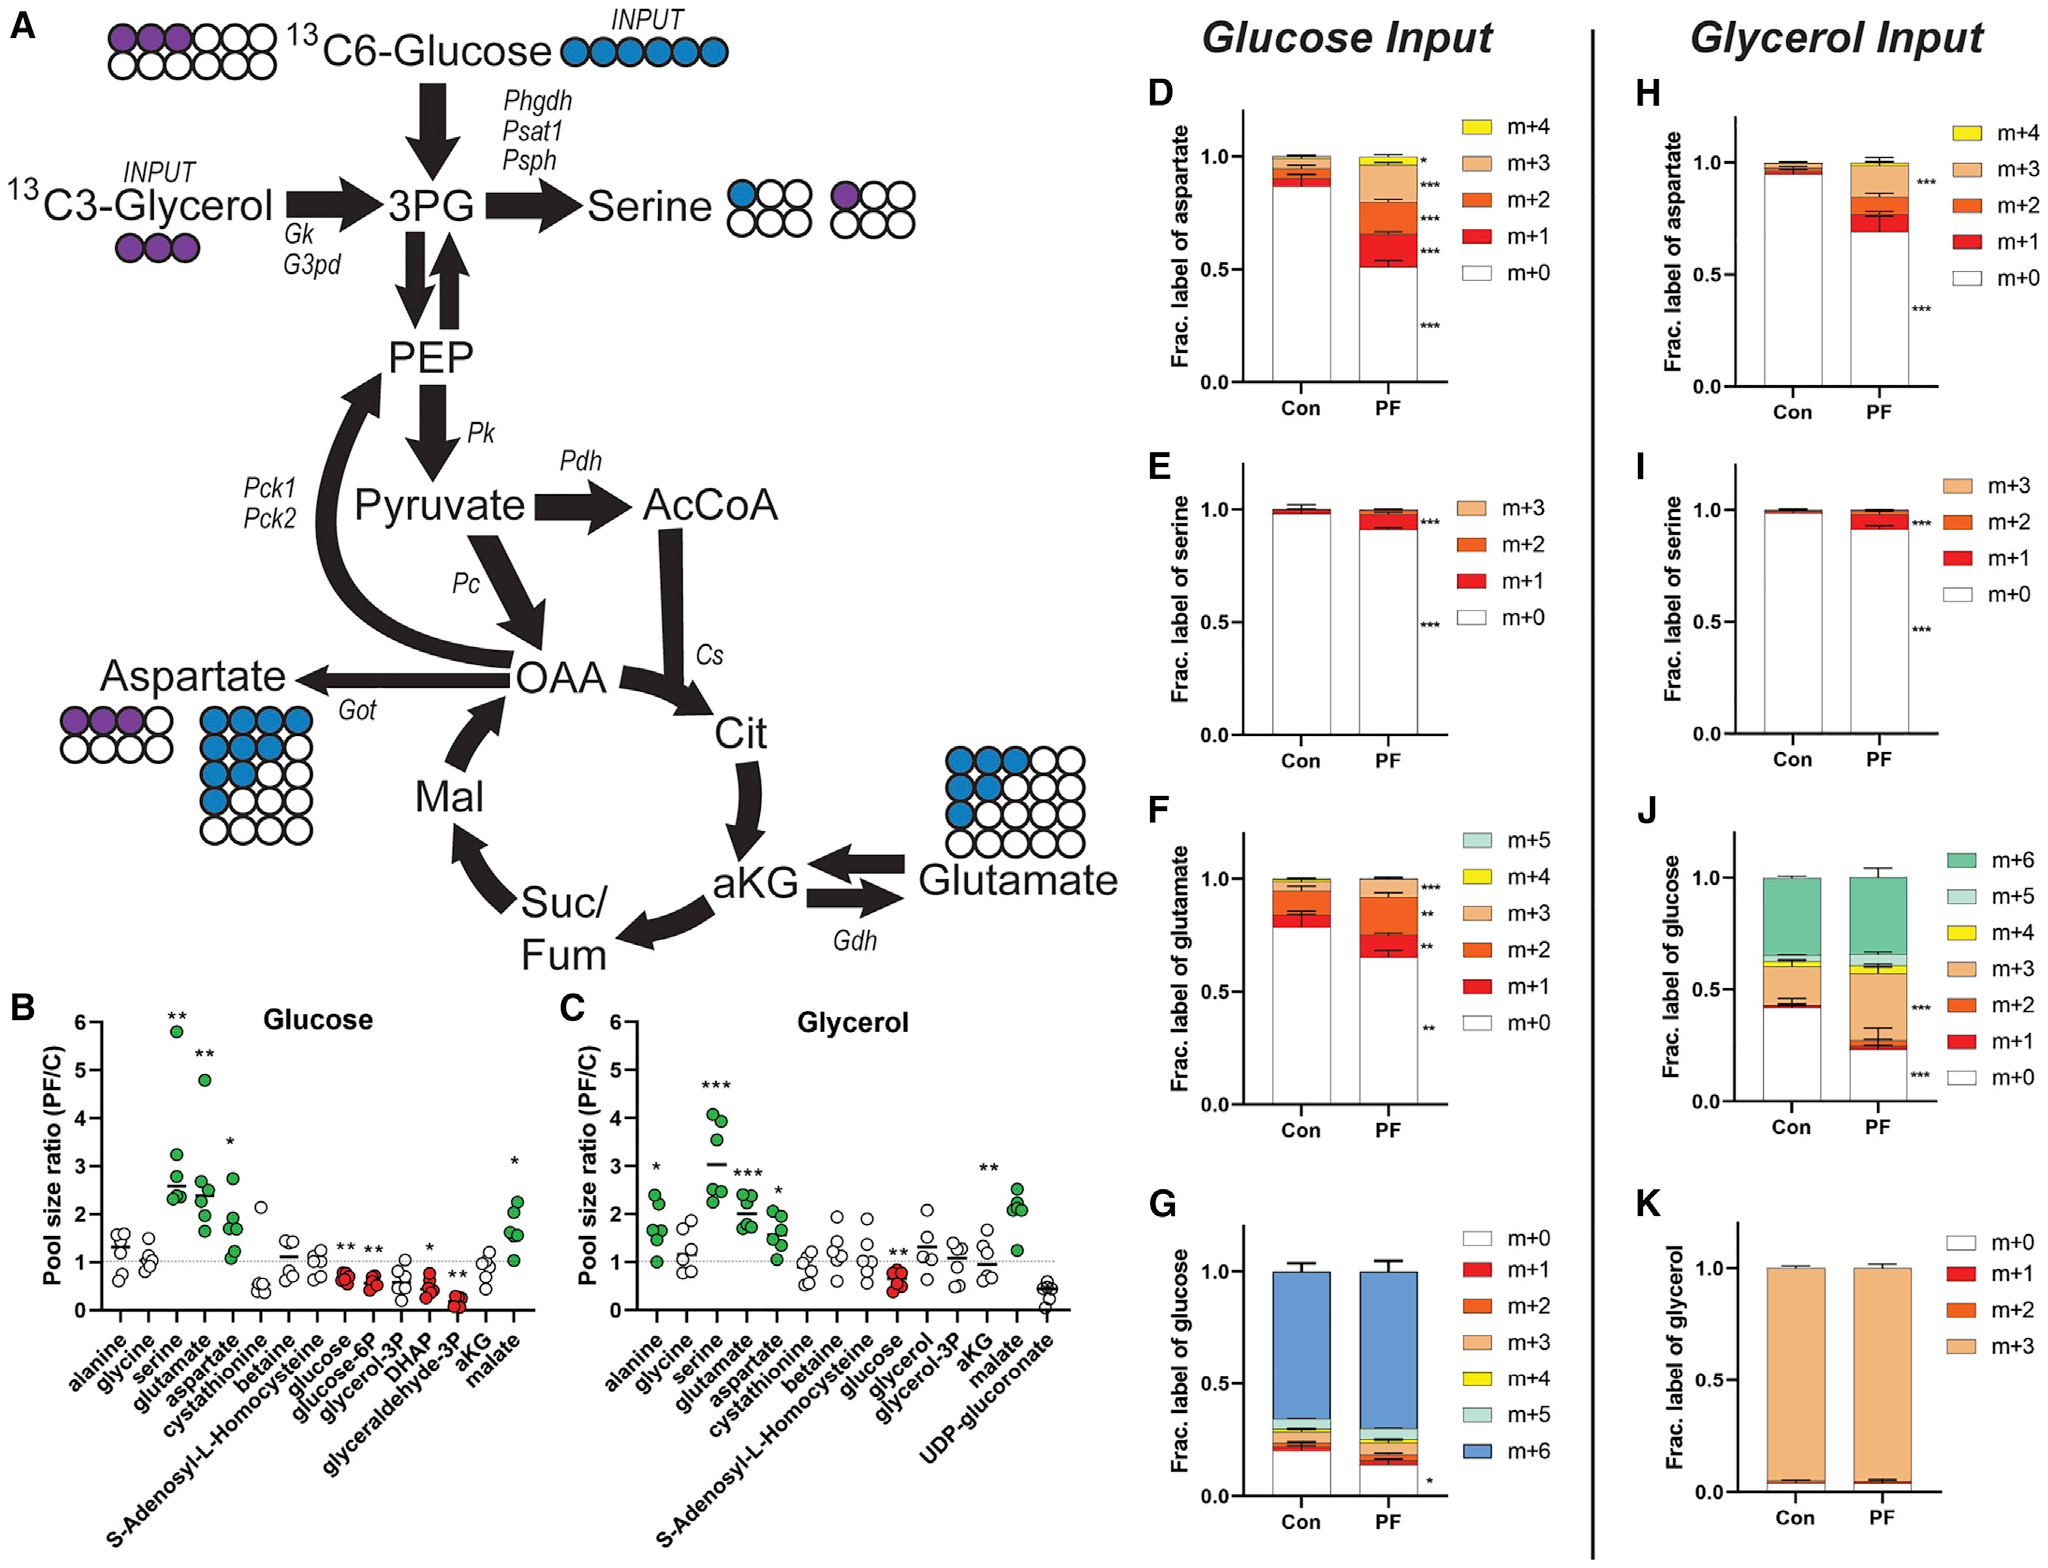
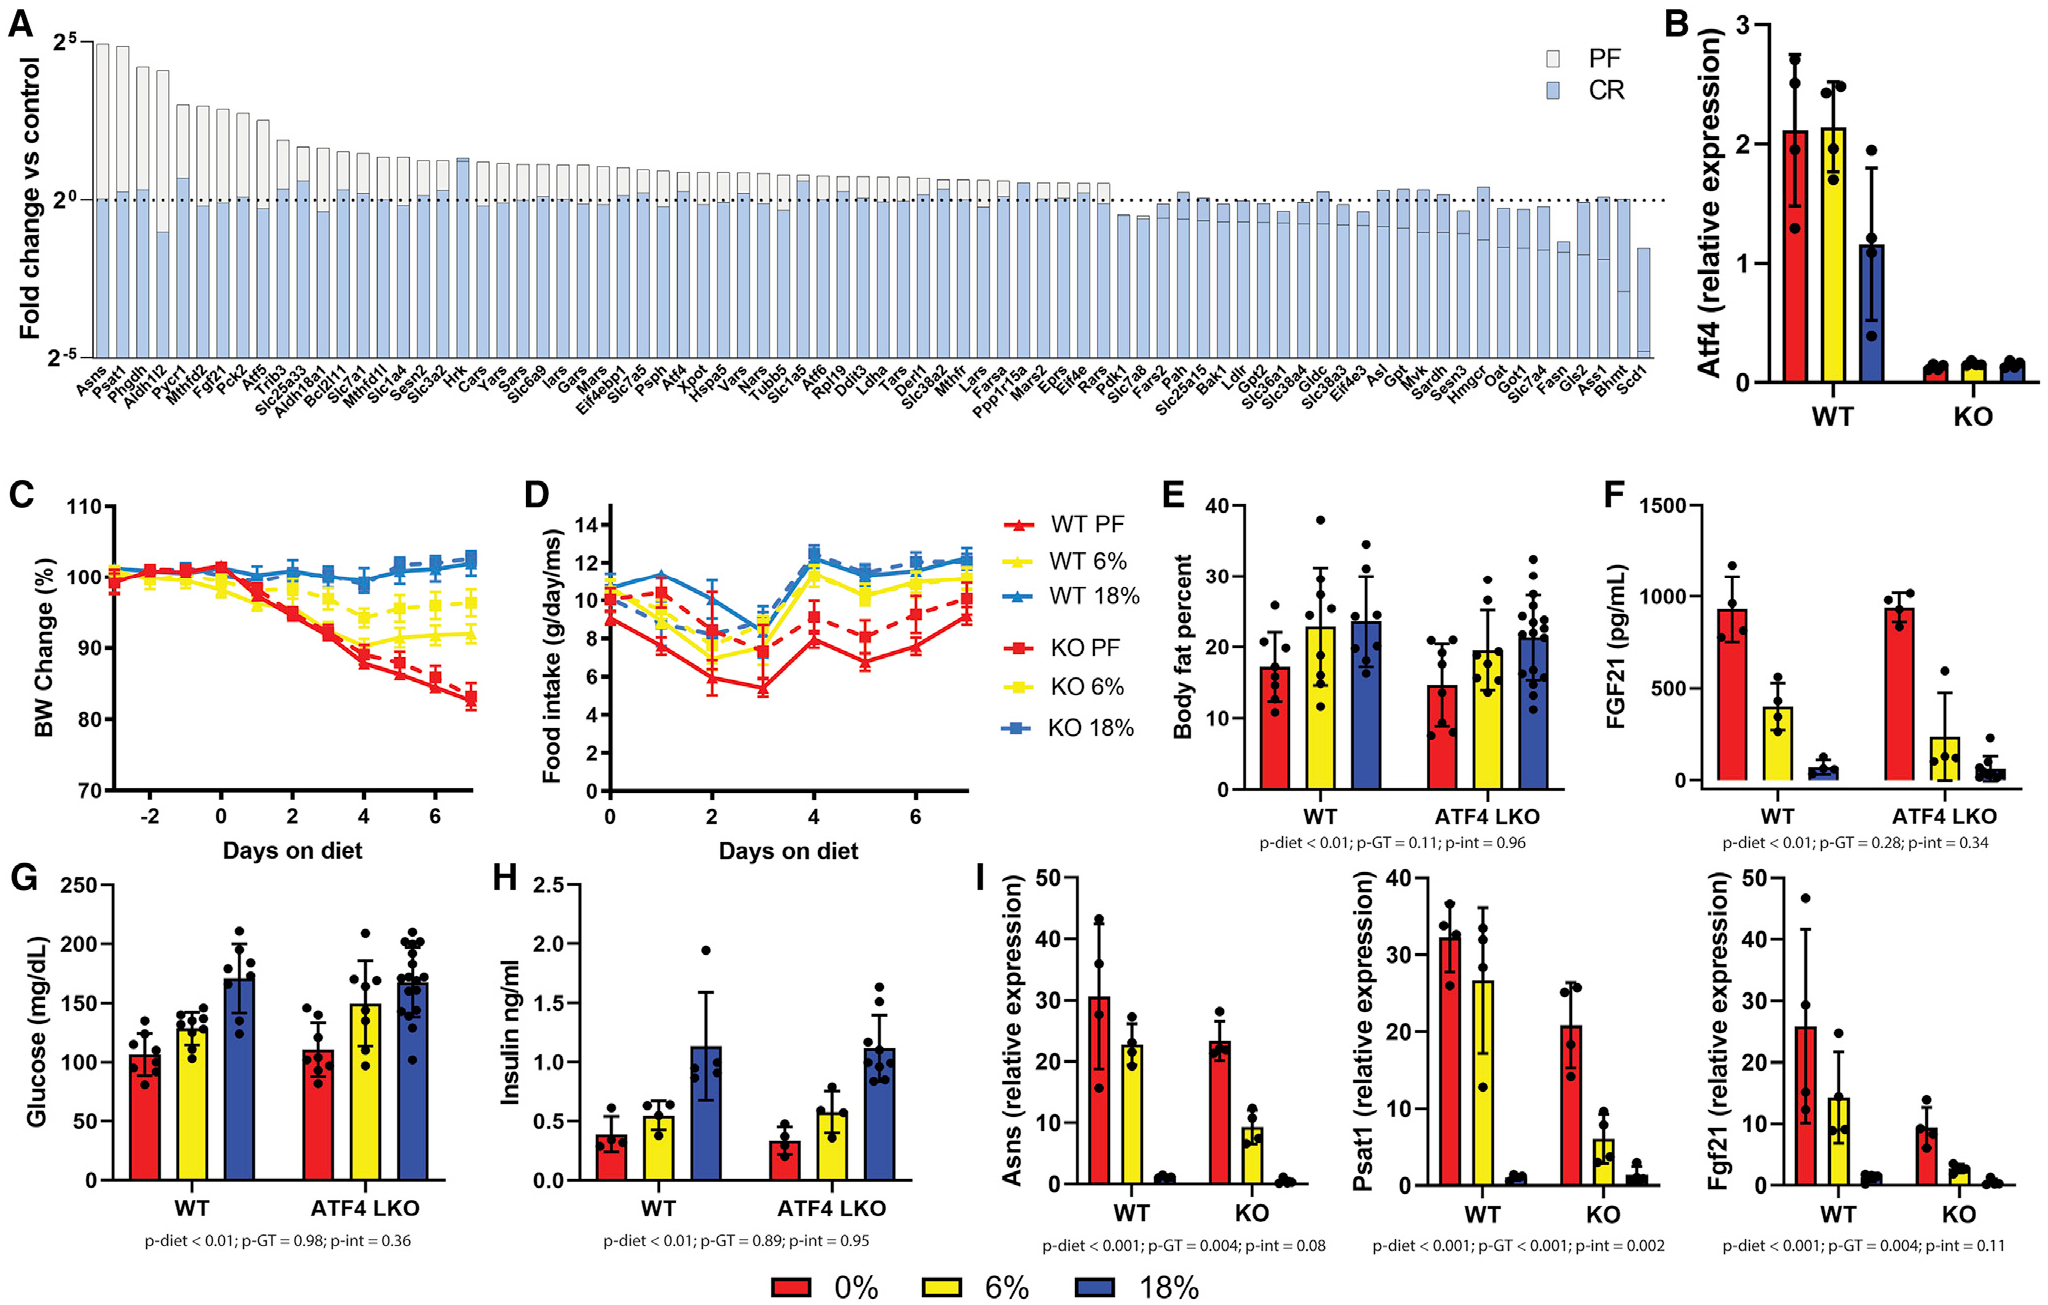
Dietary protein restriction (PR) has rapid effects on metabolism including improved glucose and lipid homeostasis, via multiple mechanisms. Here, we investigate responses of fecal microbiome, hepatic transcriptome, and hepatic metabolome to six diets with protein from 18% to 0% of energy in mice. PR alters fecal microbial composition, but metabolic effects are not transferable via fecal transplantation. Hepatic transcriptome and metabolome are significantly altered in diets with lower than 10% energy from protein. Changes upon PR correlate with calorie restriction but with a larger magnitude and specific changes in amino acid (AA) metabolism. PR increases steady-state aspartate, serine, and glutamate and decreases glucose and gluconeogenic intermediates. 13C6 glucose and glycerol tracing reveal increased fractional enrichment in aspartate, serine, and glutamate. Changes remain intact in hepatic ATF4 knockout mice. Together, this demonstrates an ATF4-independent shift in gluconeogenic substrate utilization toward specific AAs, with compensation from glycerol to promote a protein-sparing response.

Keywords: ATF4; CP: Metabolism; RNA seq; amino acids; calorie restriction; dietary restriction; gluconeogenesis; metabolic health; protein restriction; serine; stable isotope tracing.


Conflict of interest statement

Declaration of interests T.-Z.A.C. and A.K. are employees of the Charoen Pokphand Group. J.R.M. received research funding from the Charoen Pokphand Group.

Figures

Figure 1.
Figure 1.. Phenotypic effects of dietary amino acid titration
Adult male B6D2F1 mice (4/group) were fed ad libitum for 1 week on an isocaloric semi-purified diet of the indicated protein calorie percentage. (A) Body weight change expressed as percentage of starting weight. (B) Cumulative food intake normalized to body weight. (C–E) Body weight percentage change (C), fat mass (D), and lean mass (E) after 1 week on the indicated diet. (F–H) Four-hour-fasted values for (F) blood glucose, (G) serum insulin, and (H) FGF21. Error bars are standard deviations, different letters indicate p < 0.05 in Tukey post-hoc test following significant one-way ANOVA F test. See also Figure S1 and Table S1.
Figure 2.
Figure 2.. Effects of dietary protein titration on fecal microbiome composition
(A and L) NMDS plots after (A) 0, 4, and 8 days of diet in donor mice and (L) 7, 14, and 19 days after inoculation of gnotobiotic recipient mice. (B and M) Relative abundance of the 5 most abundant phyla in fecal samples from (B) donor mice and (M) recipient mice across the time courses. (C–E and N–P) Relative abundances of the genera Oscillospira, Coprococcus, and Turicibacter across the time course in (C–E) donor and (N–P) recipient mice. (F–K) Percentage of weight change, fasting blood glucose, insulin, resistin, white blood cell count, and neutrophil:lymphocyte ratio in donor mice after 8 days of diet. (Q–V) the same parameters as (F)–(K) in recipient mice 19 days after inoculation. *p < 0.05, **p < 0.01, ***p < 0.001 Dunnett’s post-hoc test versus 18% control group following significant one-way ANOVA F test. Error bars are standard deviations. See also Figure S2 and Tables S2 and S3.
Figure 3.
Figure 3.. Effects of dietary protein titration on hepatic transcriptome
Adult male B6D2F1 mice (4/group) were fed ad libitum for 1 week on an isocaloric semi-purified diet of the indicated protein calorie percentage, and liver transcriptomes were analyzed. (A) Multidimensional scaling distances. (B) Venn diagram of significantly differentially expressed genes in 0%, 2%, and 6% protein groups versus 18% control. (C) Clustering analysis separated into four major cluster patterns. (D–G) Pathway enrichment in the 4 major clusters identified in (C). See also Figure S3.
Figure 4.
Figure 4.. Effects of dietary protein titration on hepatic metabolome
(A and B) Principal component analysis (A) and unbiased k-means clustering (B) of hepatic polar metabolites from the indicated diet groups. (C and D) Pathway enrichment analysis (C) encompassing both hepatic metabolite and transcript datasets comparing high- (18%, 14%, and 10%) versus low- (6%, 2%, and 0%) protein groups represented as a Venn diagram and (D) showing the 22 commonly altered pathways in the overlap. (E and F) Log2 fold changes in (E) essential and (F) non-essential amino acids in livers of the low protein groups (0%, 2%, and 6%) versus 18% control group. See also Figure S4.
Figure 5.
Figure 5.. Phenotypic effects of dietary protein and calorie restriction
Adult male B6D2F1 mice (n = 4/group) were fed ad libitum (AL) or 40% calorie restricted (CR) on a control 18% protein (Con) or 0% protein (PF) diet for one week. (A) Daily body weight expressed as percentage of starting weight. (B) Daily food intake normalized to body weight. (C–F) Body fat percentage (C), blood glucose (D), serum insulin (E), and FGF21 (F) in the fasted state after 1 week on diet. (G) MDS plot of hepatic transcriptome data. (H) Scatterplot of log2 fold changes of hepatic transcripts versus AL Con of AL PF (x axis) and CR Con (y axis). (I) Scatterplot of log2 fold changes in hepatic metabolites versus AL Con of AL PF (x axis) and CR Con (y axis). (J) Boxplots of non-essential amino acids aspartate, glutamate, and serine across diets. (K) One way ANOVA F-statistic values for hepatic metabolites; red indicates FDR-adjusted p <0.1. (L) Boxplots of ophthalmic acid, the metabolite with the largest ANOVA F statistic, across diets. Error bars are standard deviations; different letters indicate p < 0.05 in Tukey post-hoc test following significant one-way ANOVA F test. See also Figure S5.
Figure 6.
Figure 6.. Effects of dietary protein restriction on hepatic glucose and glycerol flux
(A) Diagram showing unlabeled (open circle) and labeled carbon from glucose (blue) or glycerol (purple) in fractionally enriched glycolytic/gluconeogenic and citric acid cycle metabolites relevant to amino acid metabolism. (B and C) Total pool sizes (labeled plus unlabeled) of the indicated metabolite from the glucose (B) or glycerol (C) labeling experiment. (D–K) Mice subject edto 1 week on 18% protein (Con) or 0% protein (PF) diet and injected with a bolus of 13C6 glucose (D–G) or 13C3 glycerol (H–K) and polar metabolites extracted from the liver after 30 min. Fractional enrichment of heavy carbon derived from 13C6 glucose or 13C3 glycerol incorporated into aspartate (D and H), serine (E and I), glutamate (F), or glucose (J) are indicated. (G and K) Tracer enrichment of 13C6 glucose (G) or 13C3 glycerol (K) in liver. *p < 0.05, **p < 0.01, ***p < 0.001 between diet groups using FDR-corrected Student’s t test. Error bars are standard deviations, n = 6 per group.
Figure 7.
Figure 7.. Phenotypic effects of dietary protein restriction in hepatic ATF4 knockout mice
Adult male wild-type or hepatic ATF4 knockout (LKO) littermates were fed AL isocaloric diets for 1 week with 18%, 6%, or 0% protein with protein calories replaced with sucrose. (A) ATF4 target gene expression from livers of wild-type mice fed AL 0% (white) or 40% CR 18% protein (blue) as log2 fold change versus AL 18% protein control. (B) Atf4 transcript expression in the liver. (C) Body weight changes expressed as percentage of starting weight for wild-type (solid lines) or ATF4 LKO (dashed lines) mice. (D) Food intake in grams per mouse per day. (E) Body fat percentage after 1 week of diets. (F) Serum FGF21 concentration after 1 week of diets. (G and H) Blood glucose (G) and insulin (H) levels after 1 week of diets. (I) Hepatic gene expression of selected ATF4 target genes. (E–I) were analyzed using two-way ANOVA, p-diet: p value for main effect of diet, p-GT, p value for main effect of genotype, p-int, p value for diet by genotype interaction effect.

References

    1. Ben-Sahra I, Howell JJ, Asara JM, and Manning BD (2013). Stimulation of de novo pyrimidine synthesis by growth signaling through mTOR and S6K1. Science 339, 1323–1328. - PMC - PubMed
    1. Bolyen E, Rideout JR, Dillon MR, Bokulich NA, Abnet CC, Al-Ghalith GA, Alexander H, Alm EJ, Arumugam M, Asnicar F, et al. (2019). Reproducible, interactive, scalable and extensible microbiome data science using QIIME 2. Nat. Biotechnol 37, 852–857. - PMC - PubMed
    1. Brennan MF, Fitzpatrick GF, Cohen KH, and Moore FD (1975). Glycerol: major contributor to the short term protein sparing effect of fat emulsions in normal man. Ann. Surg 182, 386–394. - PMC - PubMed
    1. Carmody RN, Gerber GK, Luevano JM Jr., Gatti DM, Somes L, Svenson KL, and Turnbaugh PJ (2015). Diet dominates host genotype in shaping the murine gut microbiota. Cell Host Microbe 17, 72–84. - PMC - PubMed
    1. Cheng CT, Qi Y, Wang YC, Chi KK, Chung Y, Ouyang C, Chen YR, Oh ME, Sheng X, Tang Y, et al. (2018). Arginine starvation kills tumor cells through aspartate exhaustion and mitochondrial dysfunction. Commun. Biol 1, 178. - PMC - PubMed

Publication types