. 2022 Sep 13;55(9):1627-1644.e7.
doi: 10.1016/j.immuni.2022.07.014. Epub 2022 Aug 16.

Apolipoprotein E4 impairs the response of neurodegenerative retinal microglia and prevents neuronal loss in glaucoma

Affiliations

Apolipoprotein E4 impairs the response of neurodegenerative retinal microglia and prevents neuronal loss in glaucoma

Milica A Margeta et al. Immunity. .

Abstract

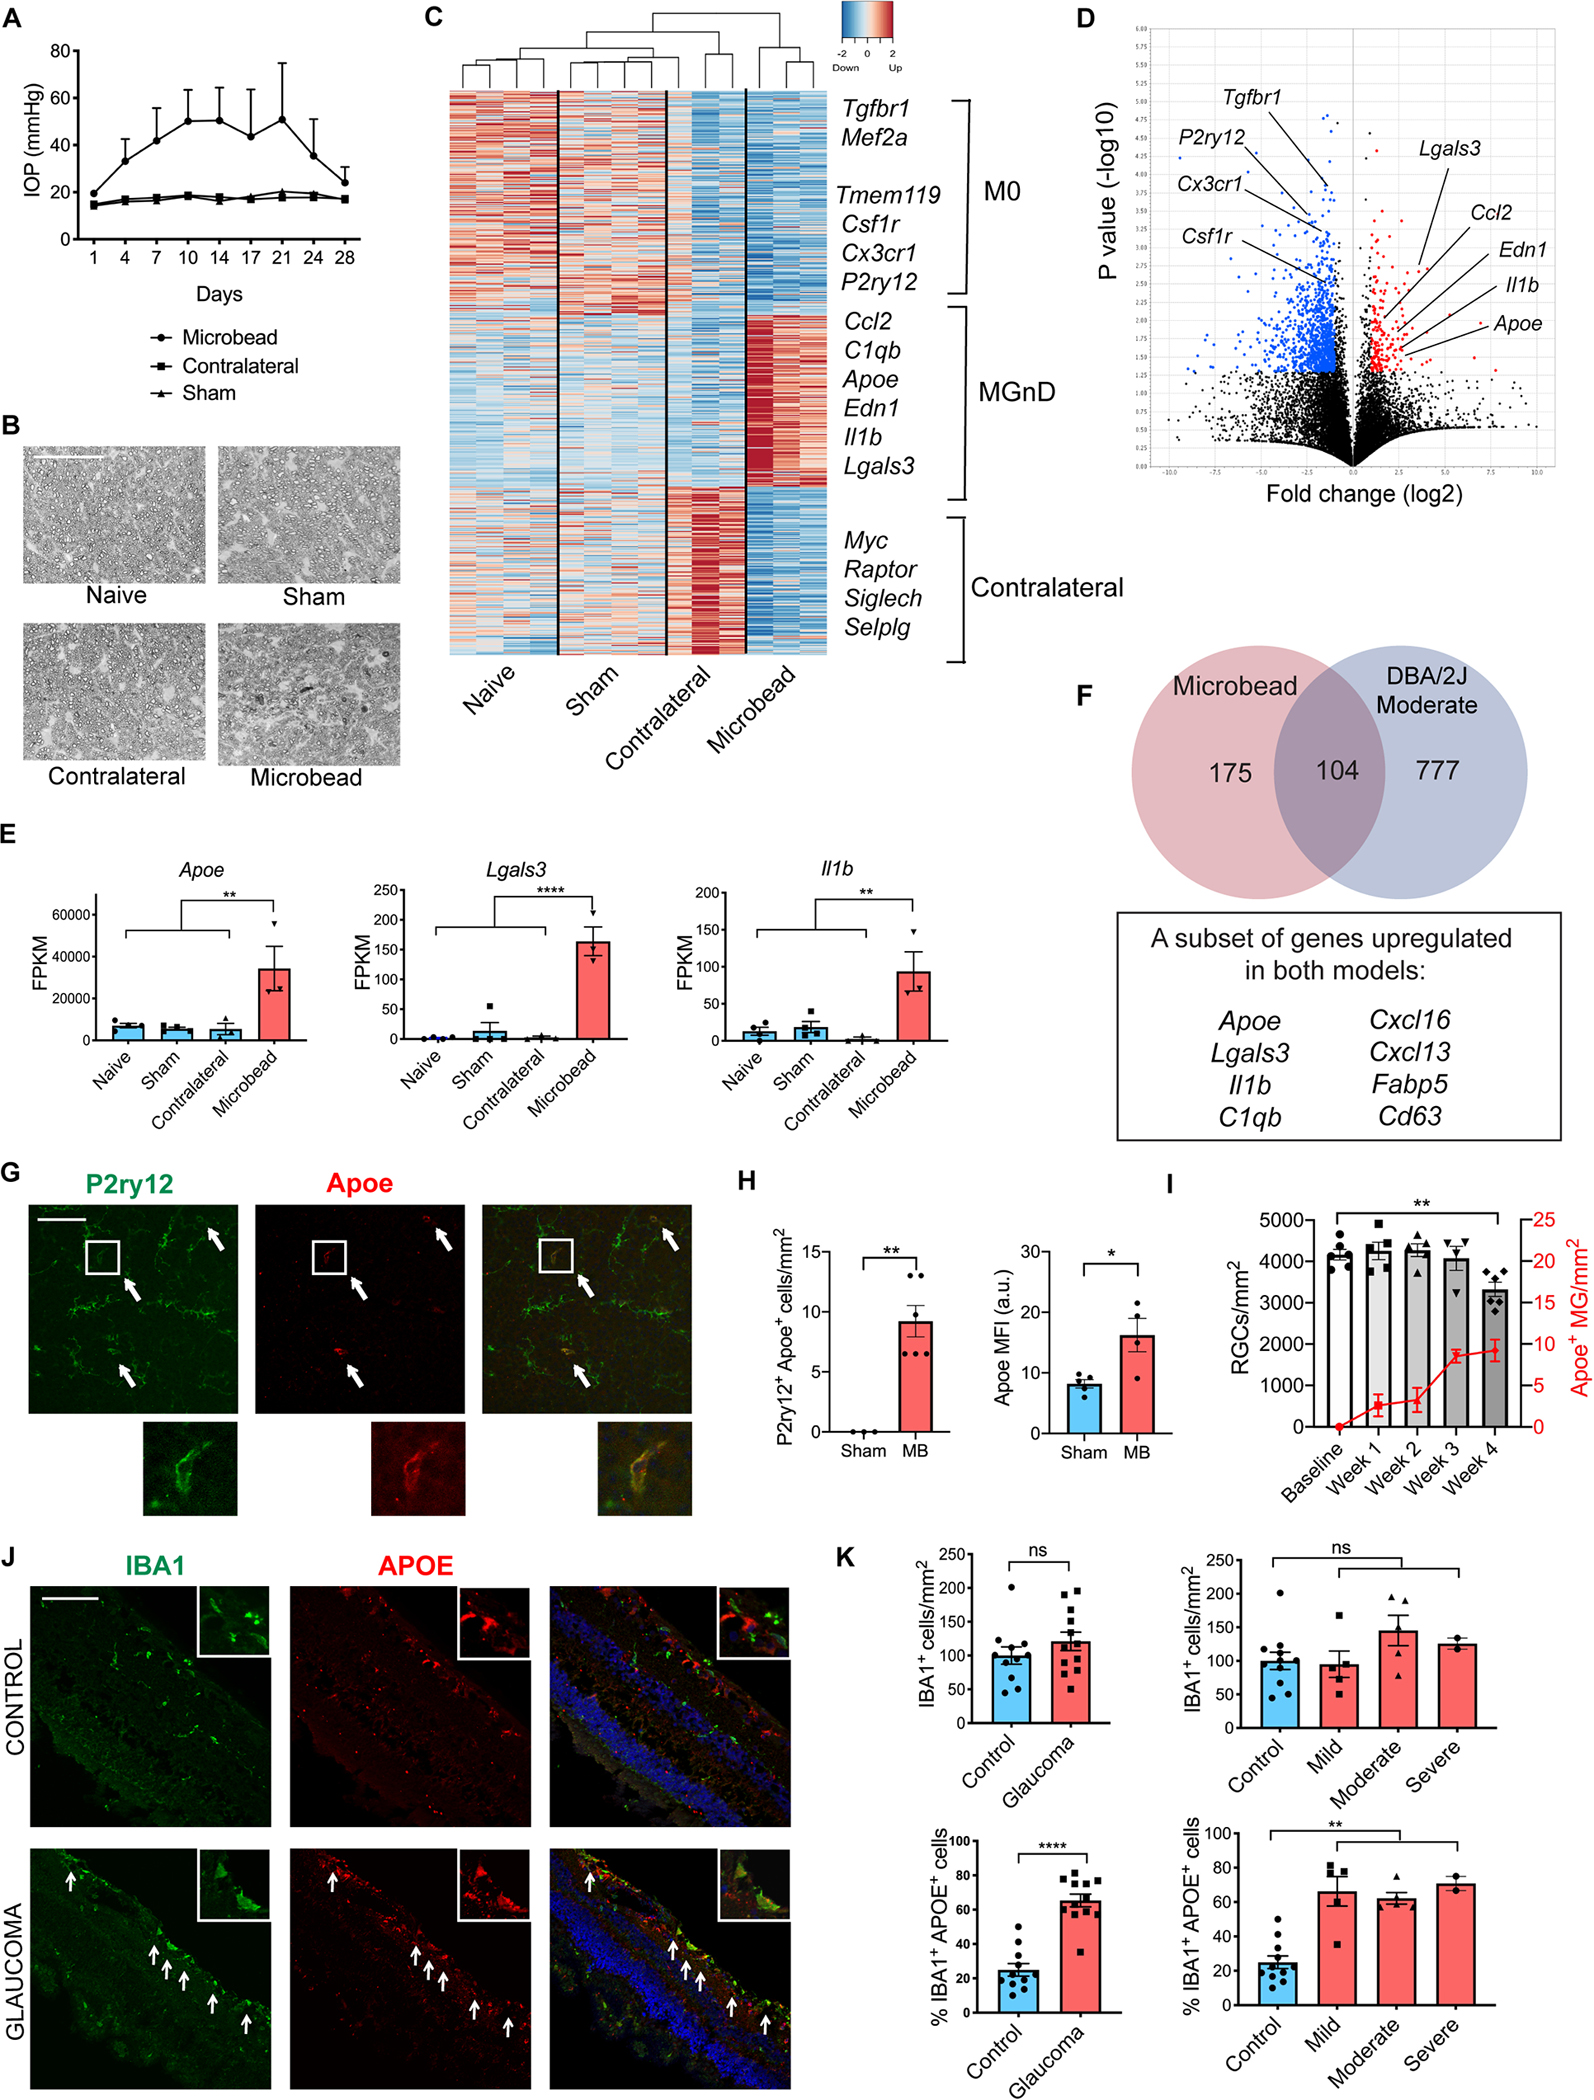
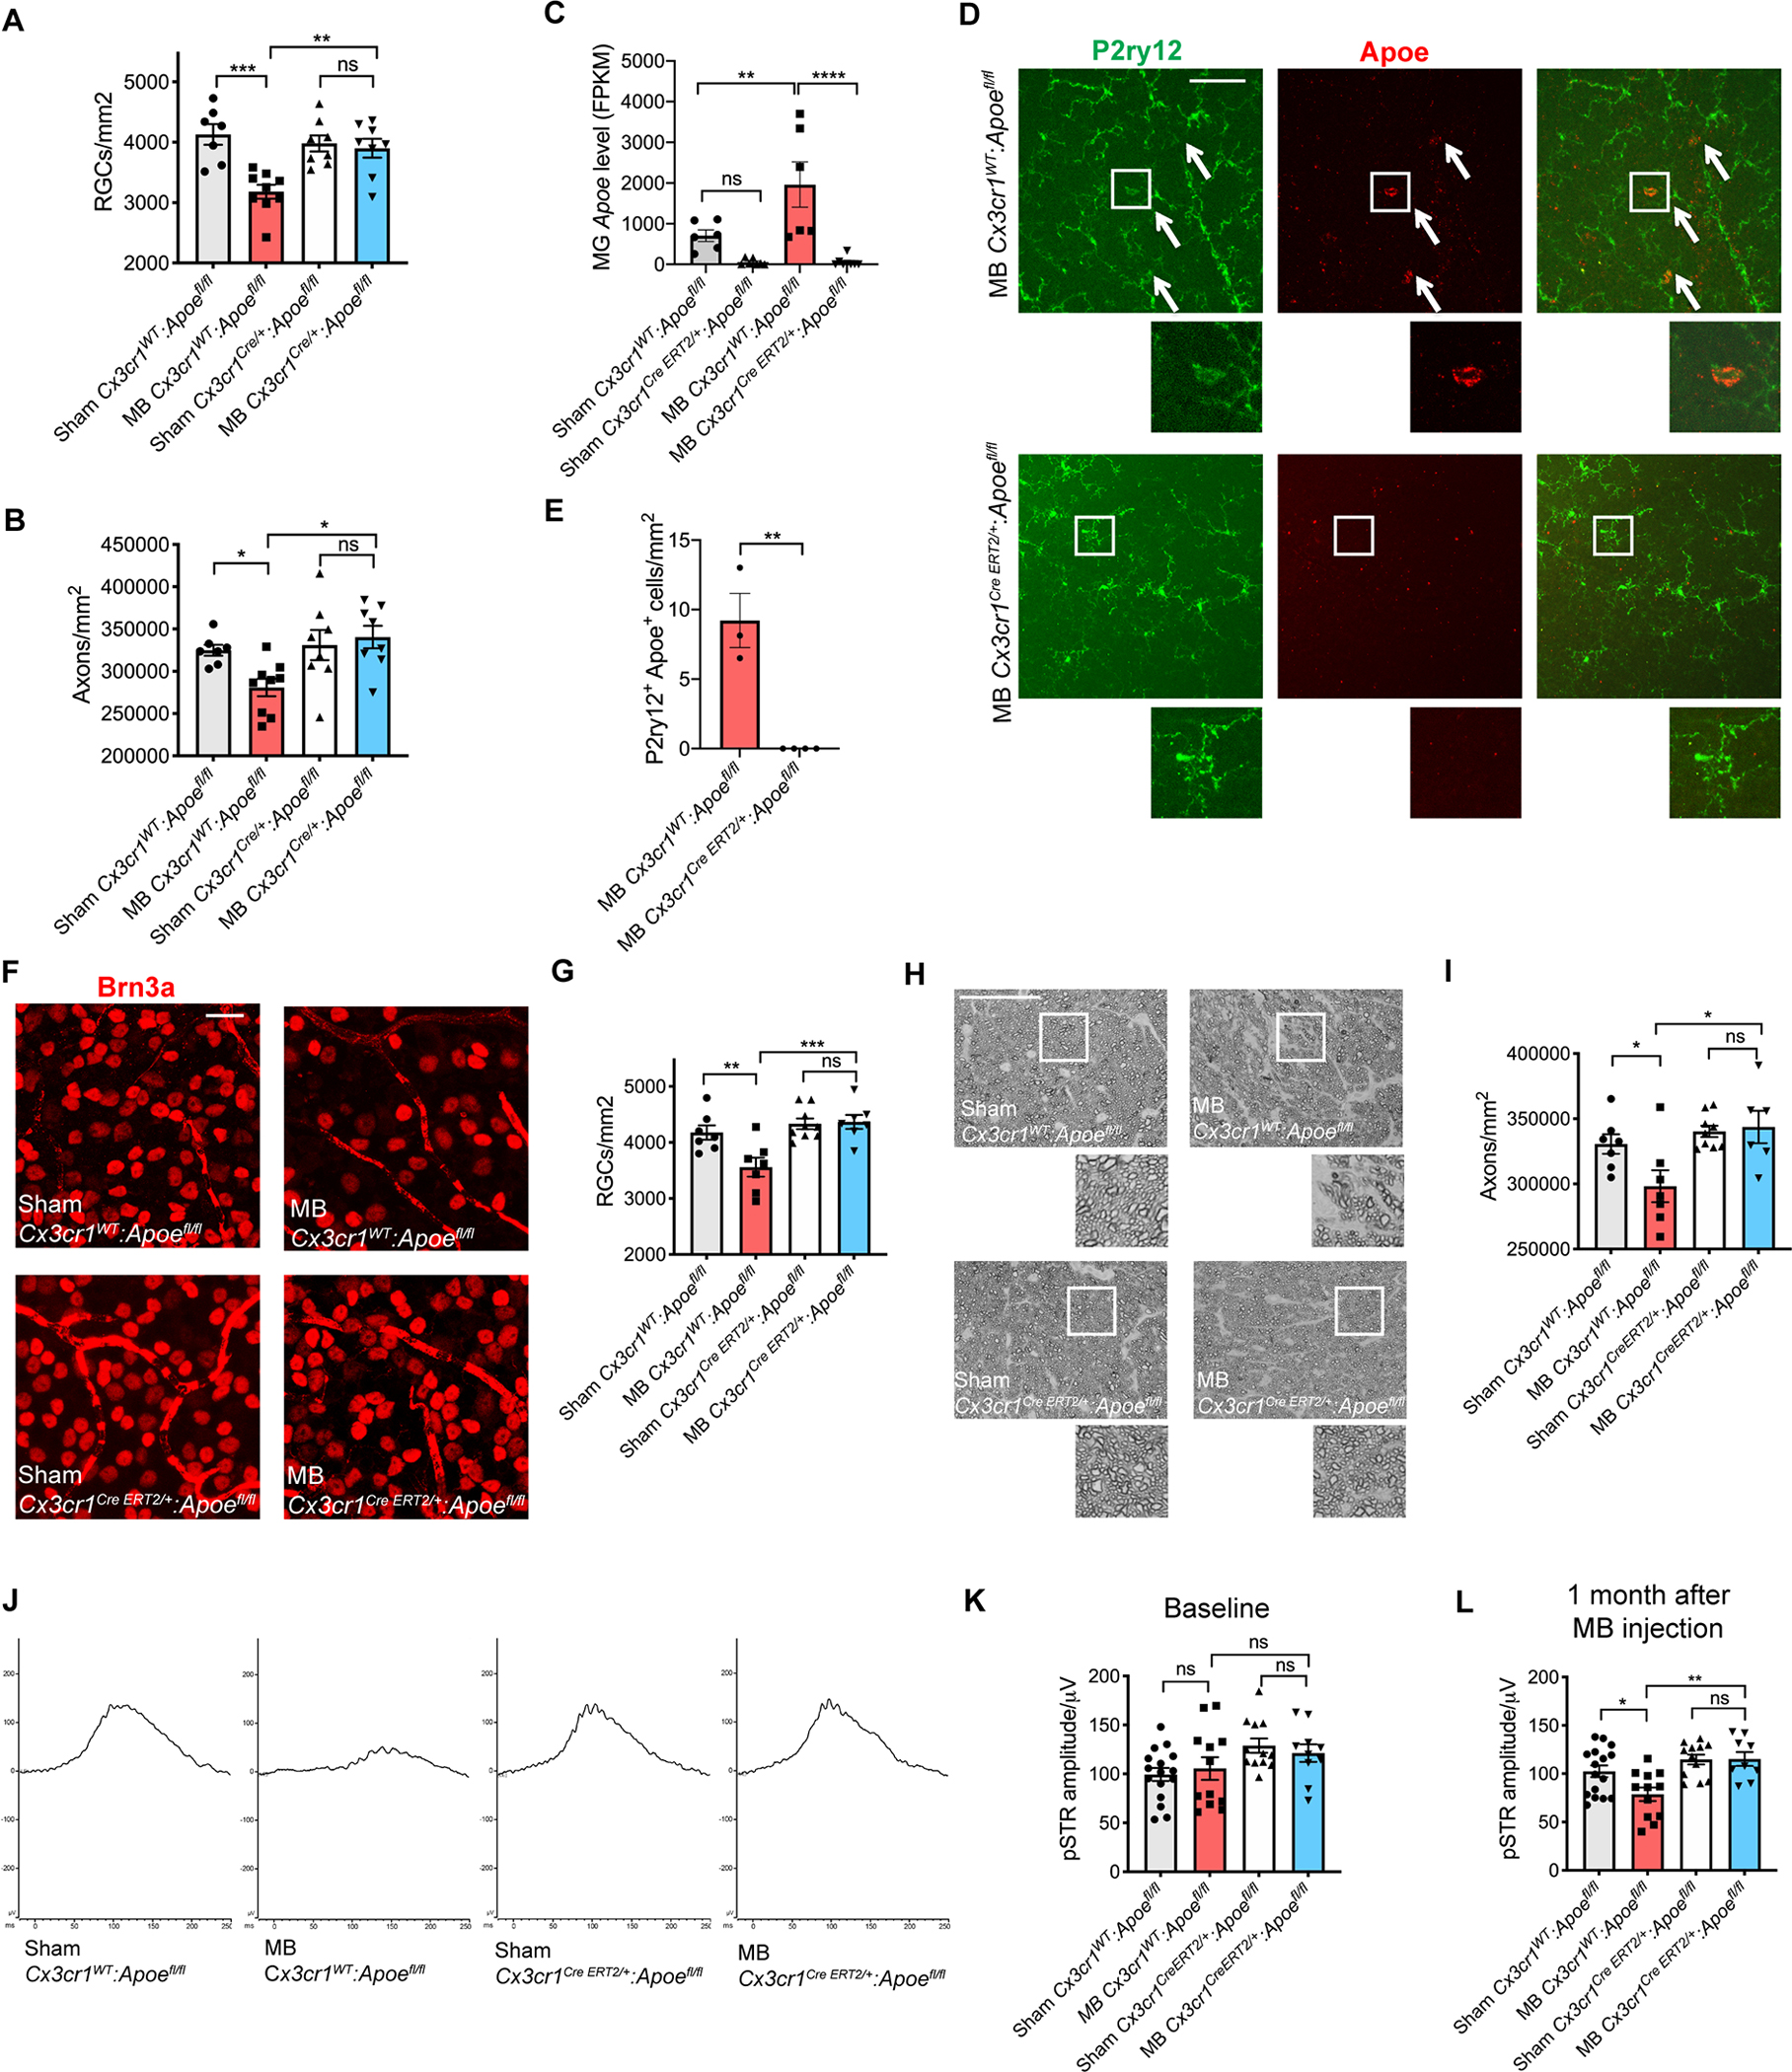
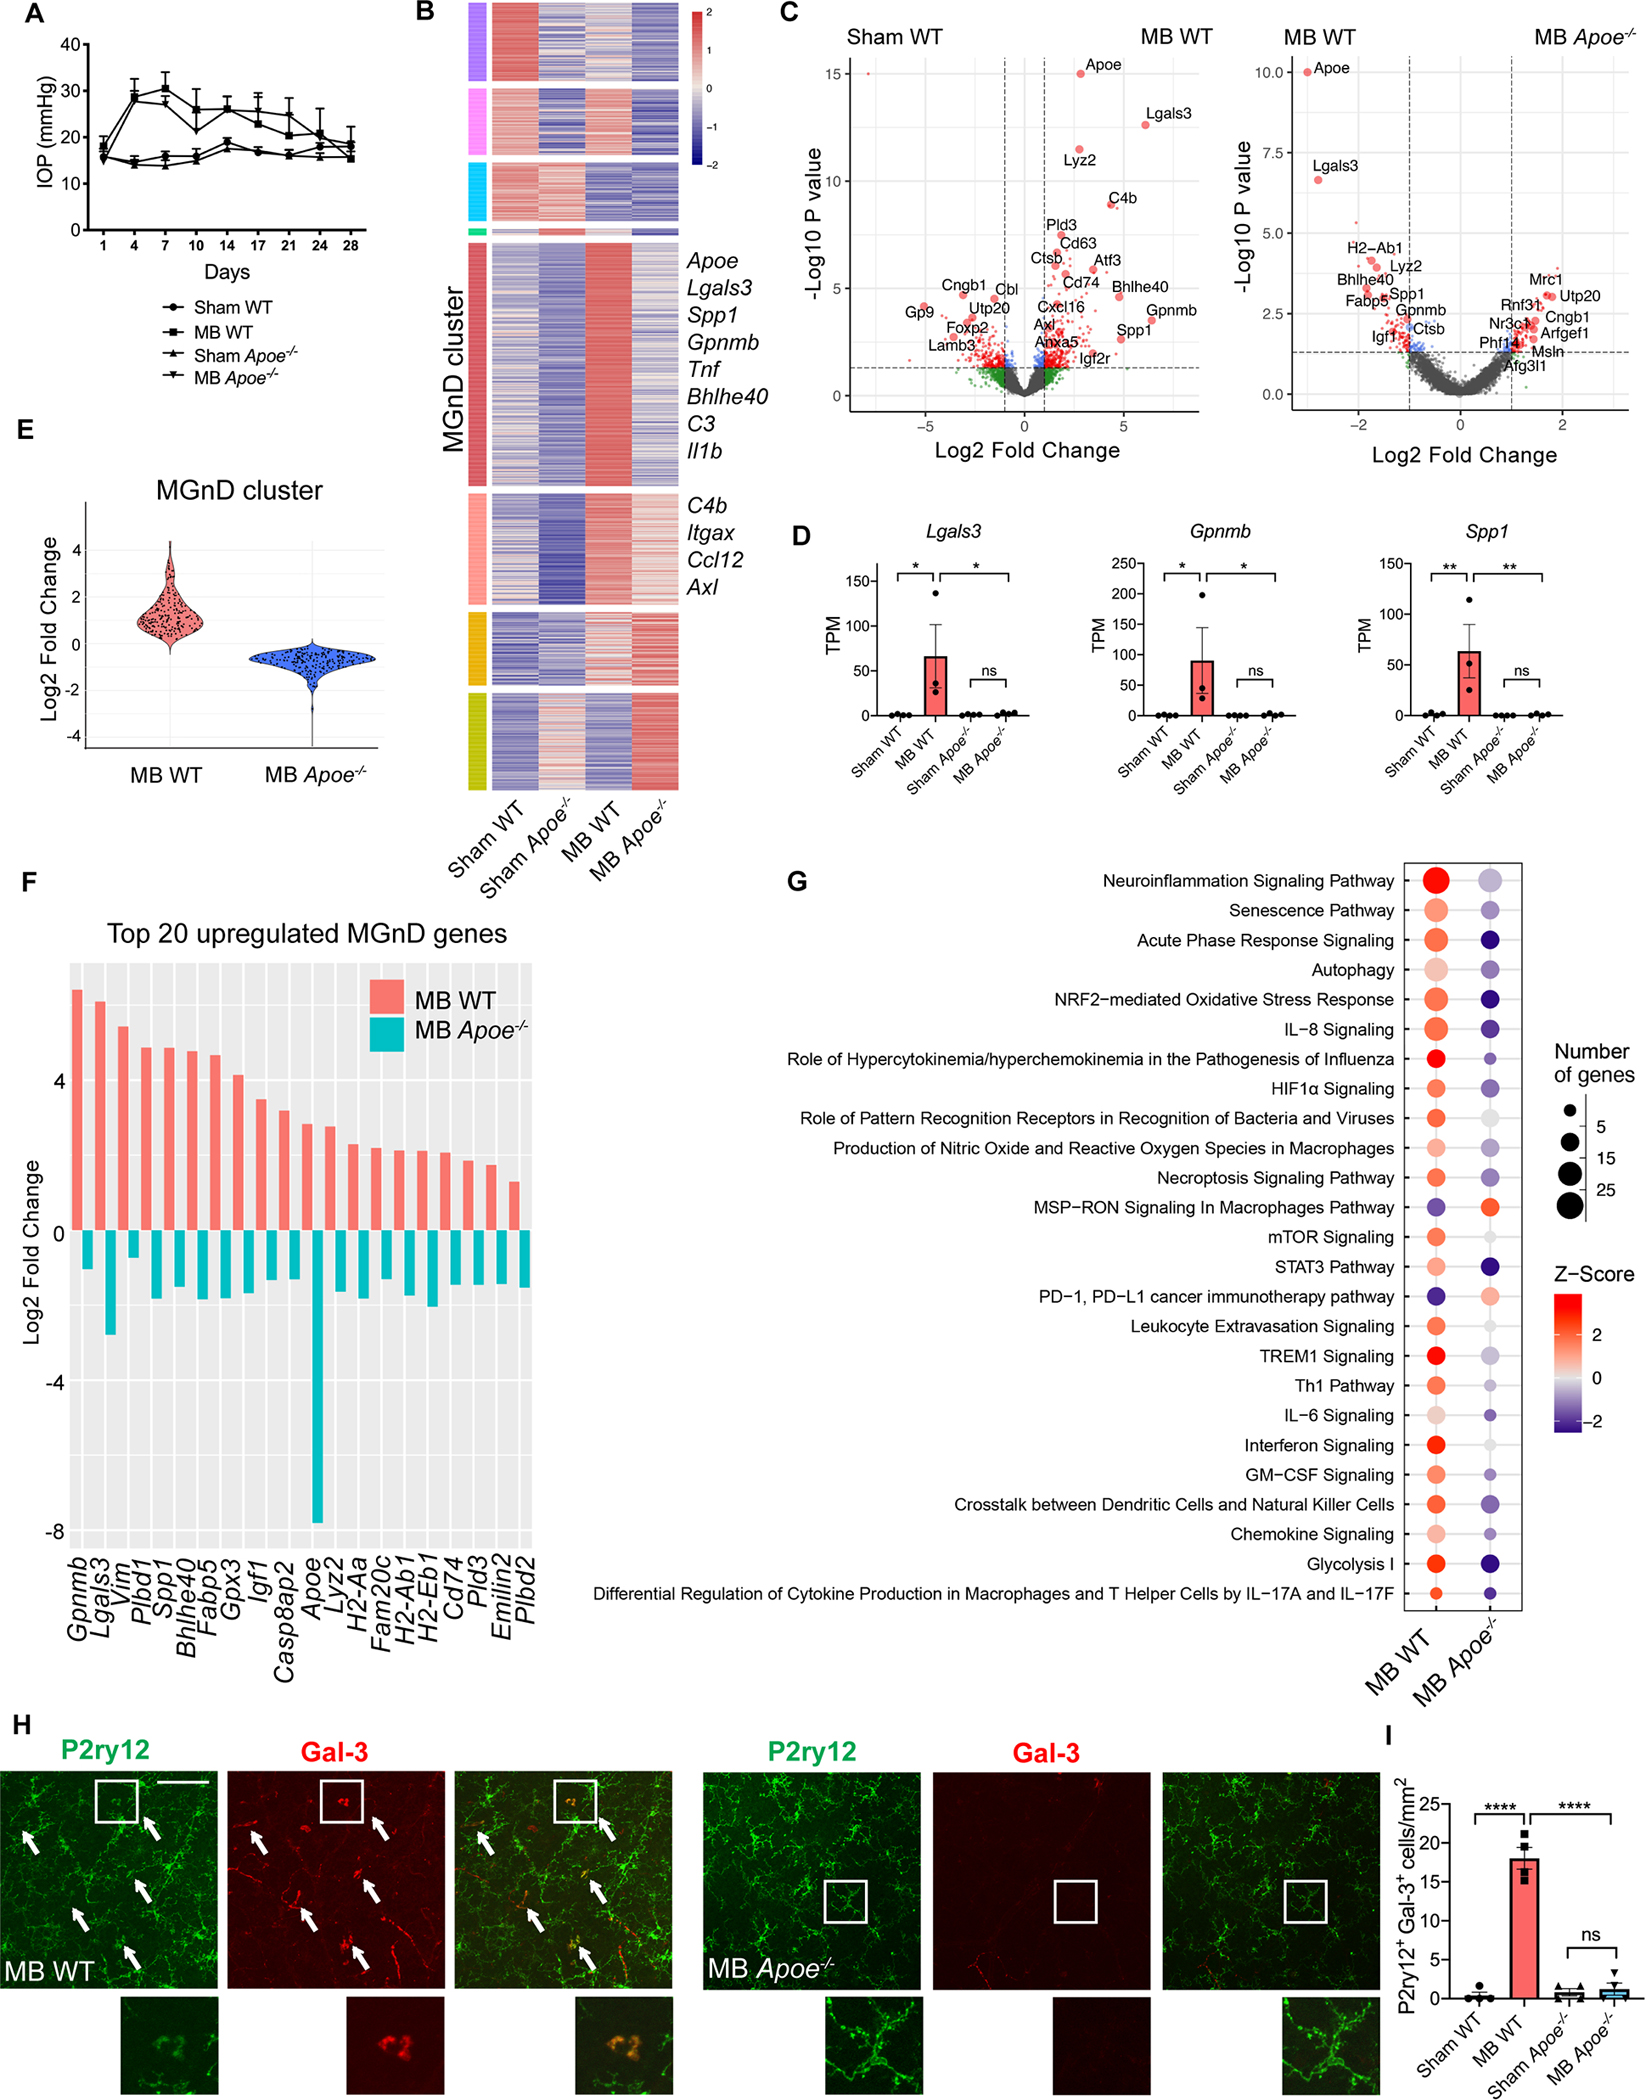
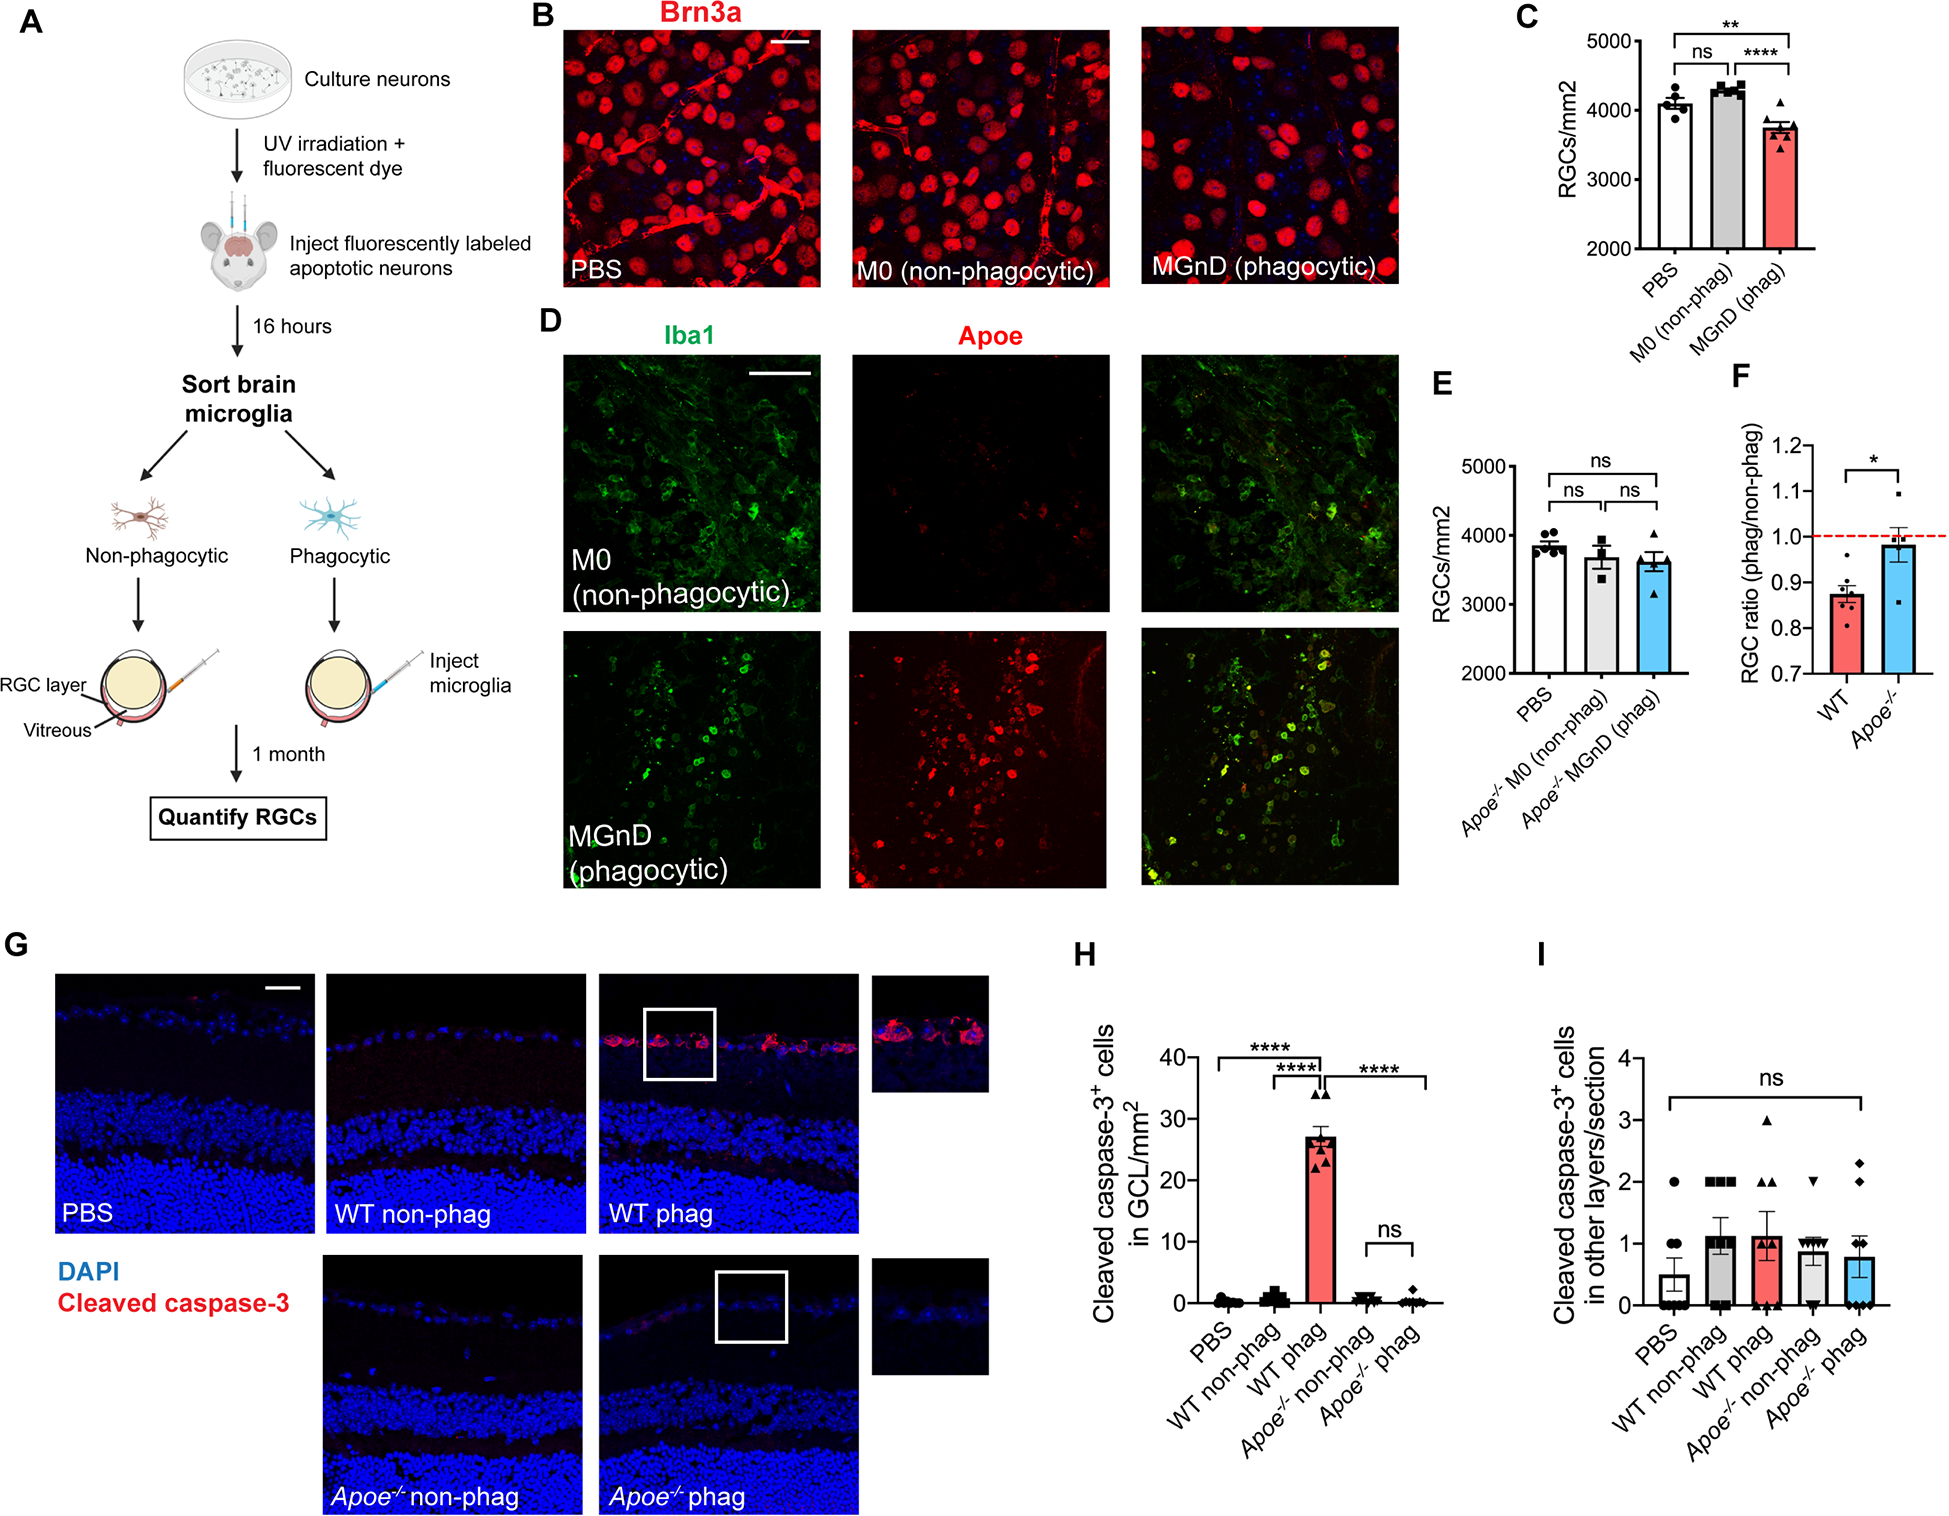
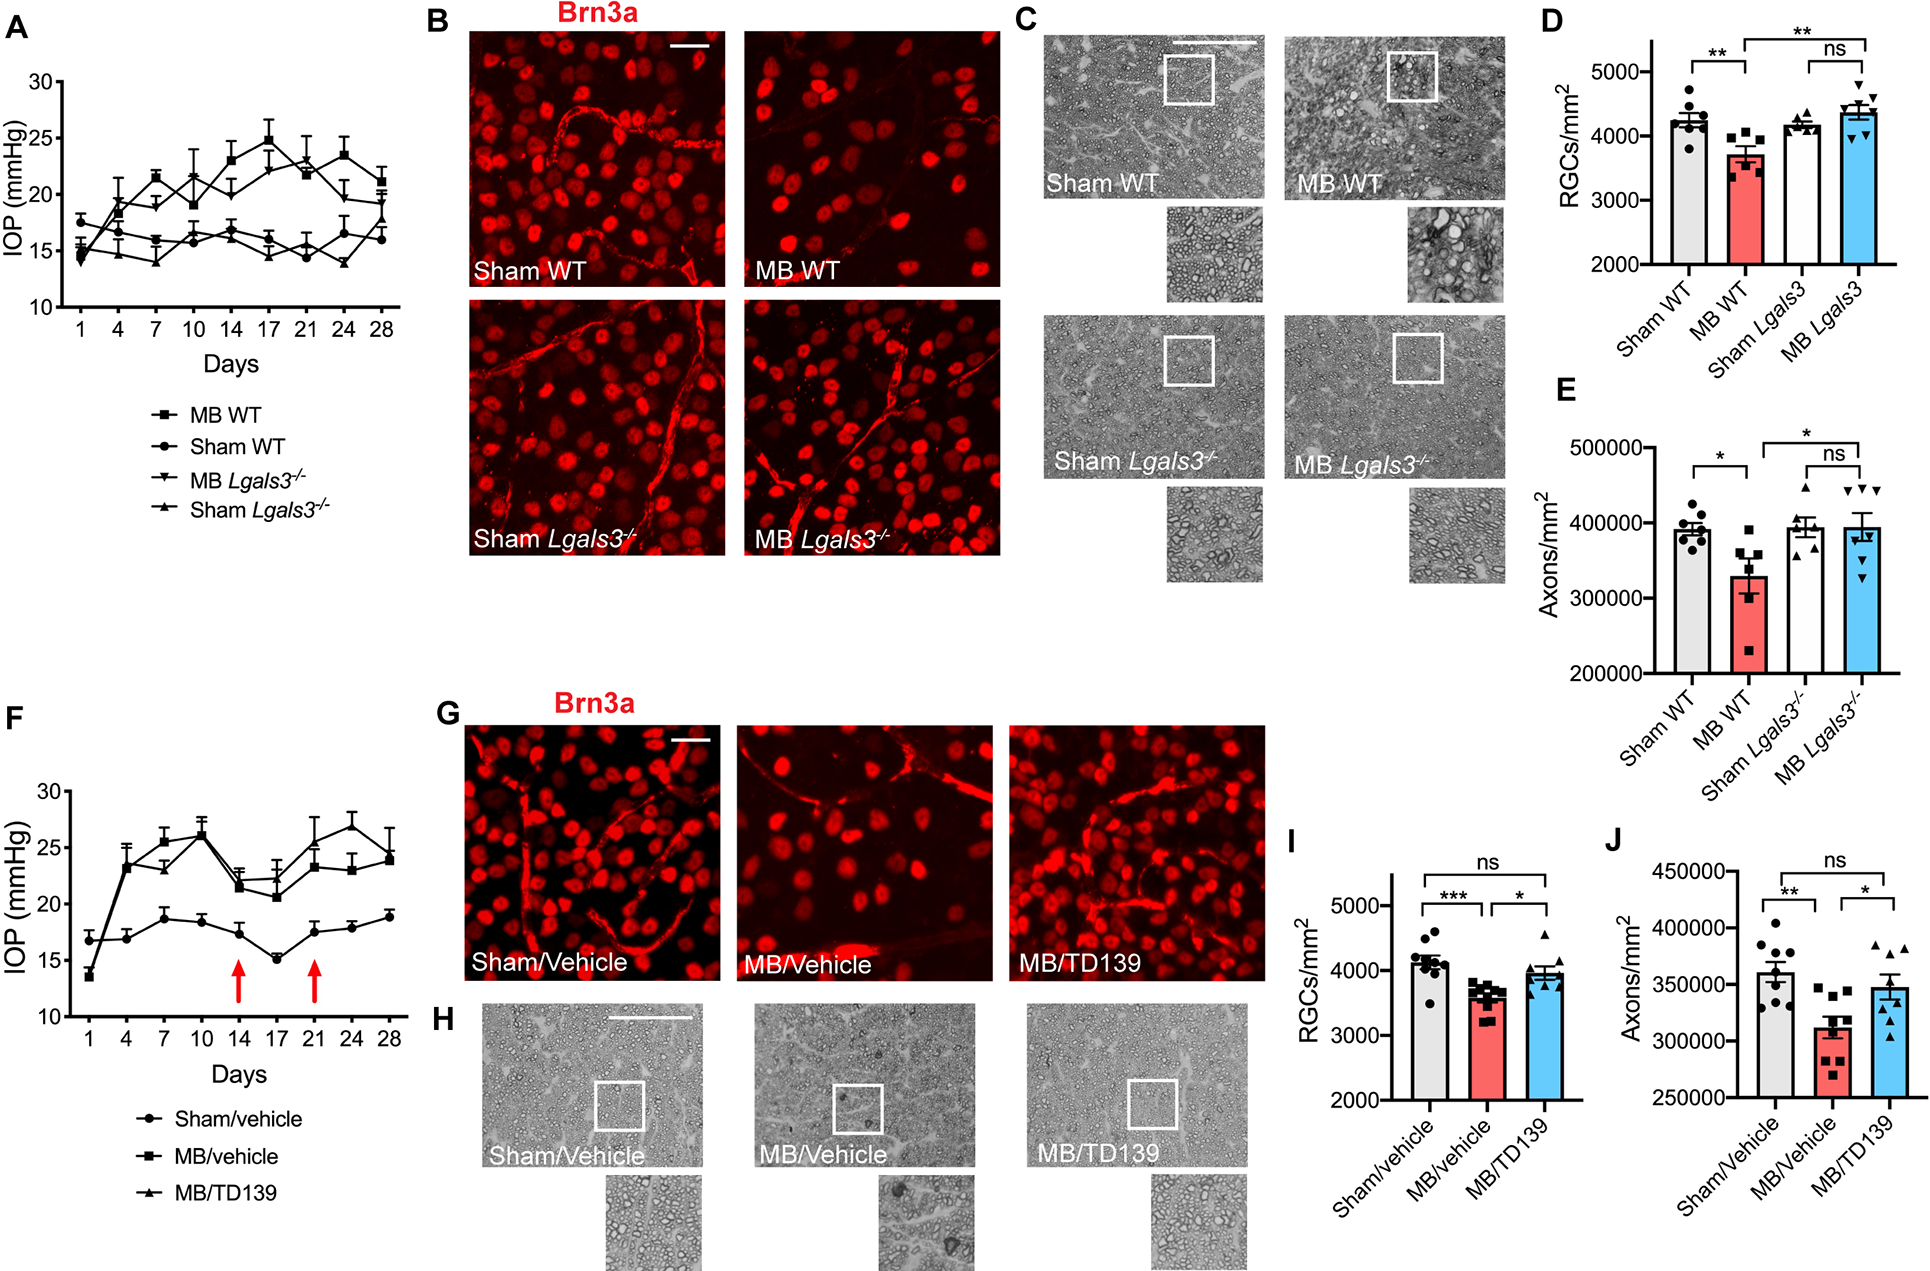
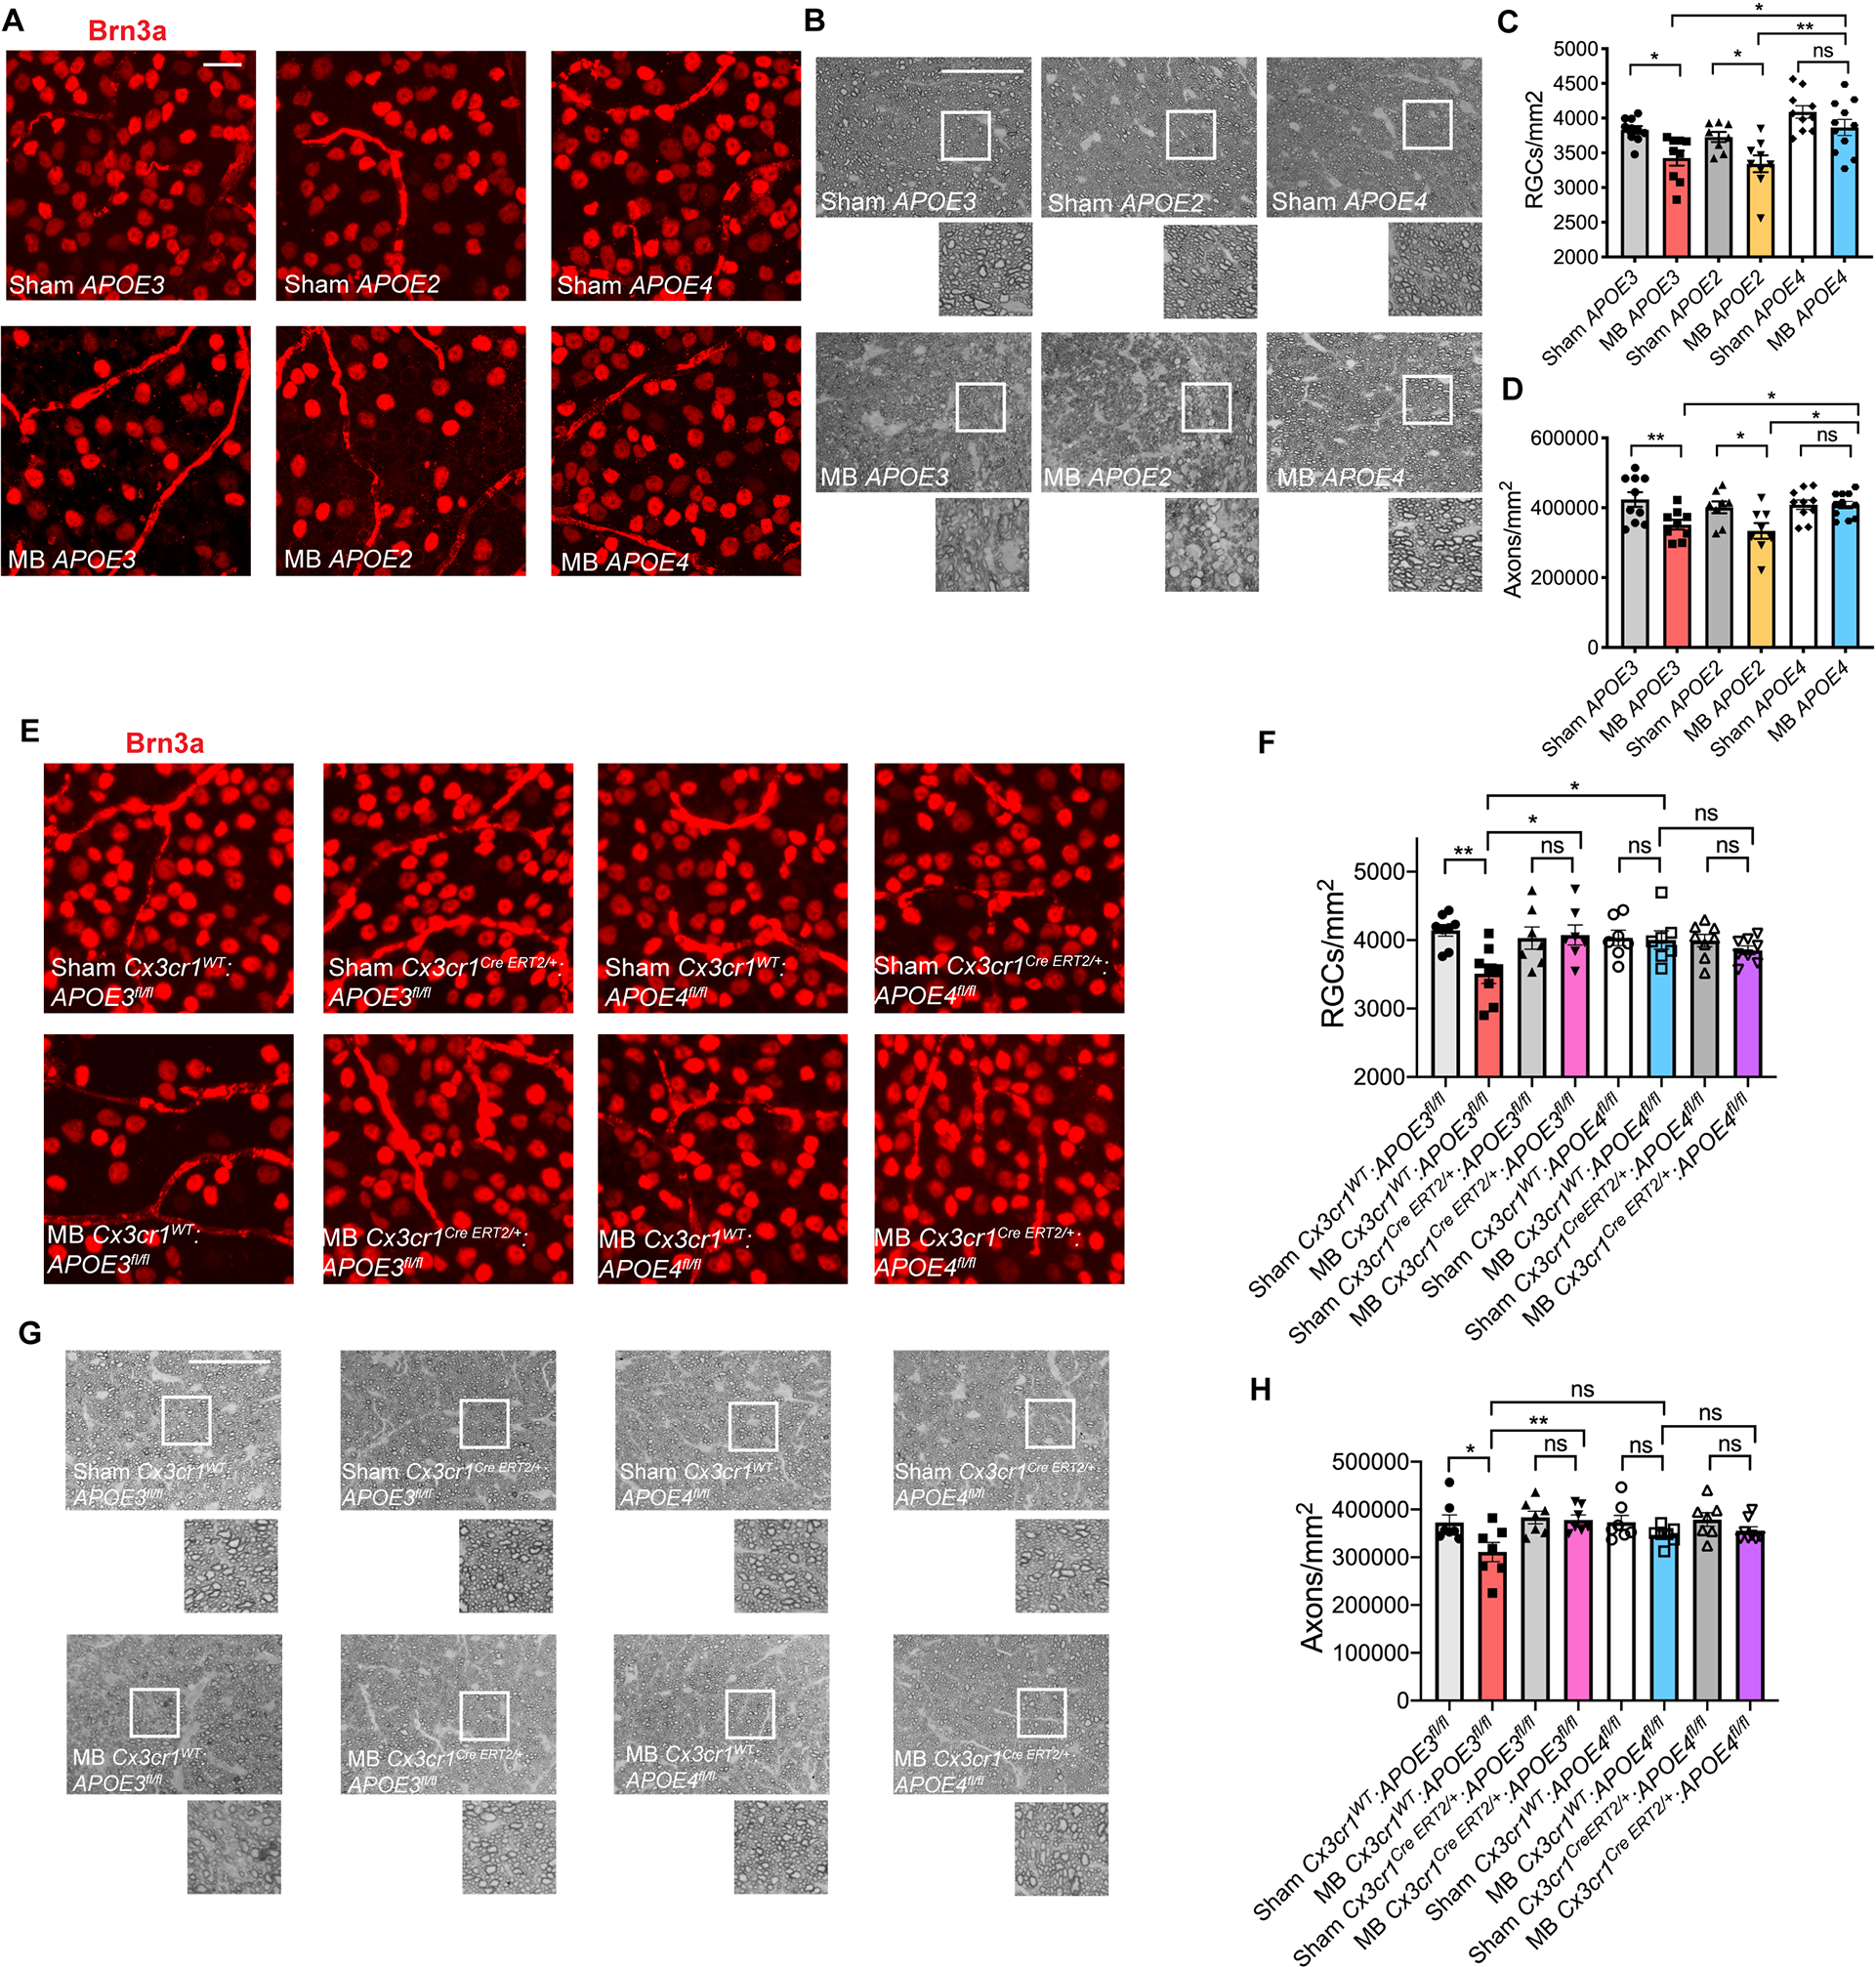
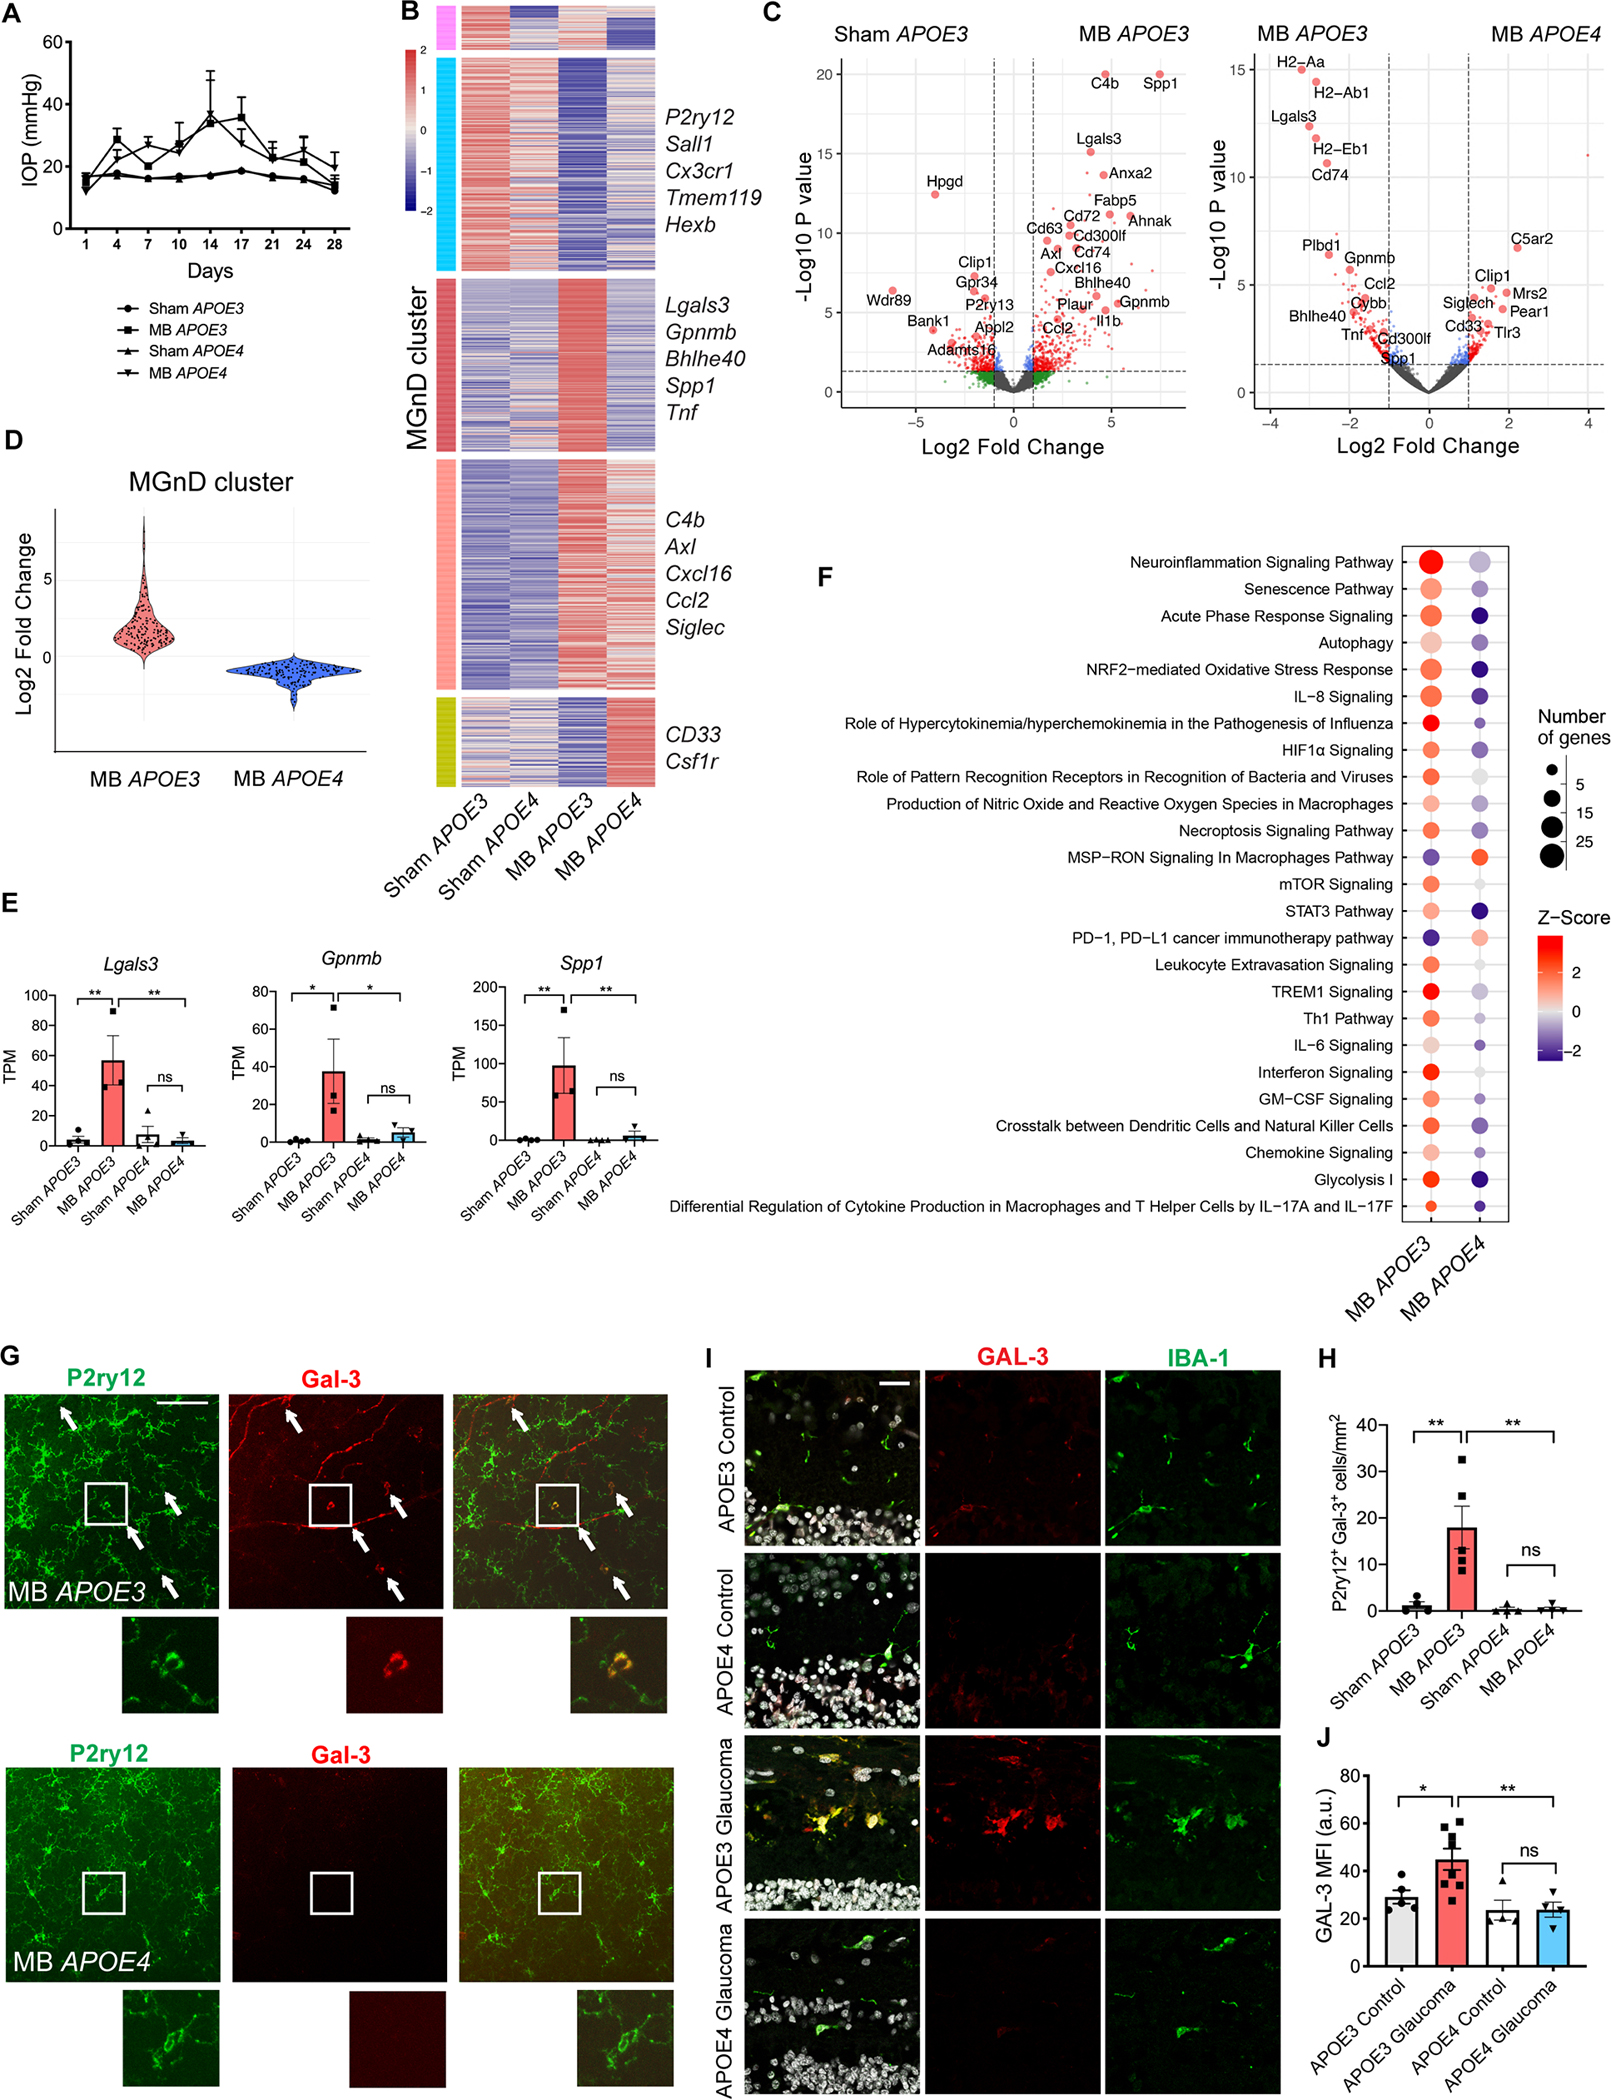
The apolipoprotein E4 (APOE4) allele is associated with an increased risk of Alzheimer disease and a decreased risk of glaucoma, but the underlying mechanisms remain poorly understood. Here, we found that in two mouse glaucoma models, microglia transitioned to a neurodegenerative phenotype characterized by upregulation of Apoe and Lgals3 (Galectin-3), which were also upregulated in human glaucomatous retinas. Mice with targeted deletion of Apoe in microglia or carrying the human APOE4 allele were protected from retinal ganglion cell (RGC) loss, despite elevated intraocular pressure (IOP). Similarly to Apoe-/- retinal microglia, APOE4-expressing microglia did not upregulate neurodegeneration-associated genes, including Lgals3, following IOP elevation. Genetic and pharmacologic targeting of Galectin-3 ameliorated RGC degeneration, and Galectin-3 expression was attenuated in human APOE4 glaucoma samples. These results demonstrate that impaired activation of APOE4 microglia is protective in glaucoma and that the APOE-Galectin-3 signaling can be targeted to treat this blinding disease.

Keywords: APOE4; Alzheimer disease; Galectin-3; Lgals3; glaucoma; microglia; neurodegeneration; neuroprotection; retina.


Conflict of interest statement

Declaration of interests O.B. and M.A.M. are co-inventors of a patent for the use of Galectin-3 inhibitors for the treatment of glaucoma. O.B. collaborates with Sanofi, GSK, and Regulus Therapeutics; receives research funding from Sanofi, GSK, and miRagen Therapeutics, and honoraria for lectures; and consults for GSK and Camp4. E.M.L. and A.D.P. receives research funding from Novartis Institutes for BioMedical Research and F. Hoffmann La Roche.

Figures

Figure 1.
Figure 1.. Retinal microglia transition to a neurodegenerative MGnD phenotype in glaucoma.
A) Intraocular pressure (IOP) measurements of microbead-injected (MB), contralateral and sham-injected eyes from wildtype C57BL/6J female mice (n=3–4 per group). B) p-phenylenediamine (PPD) staining of optic nerves from MB eyes and controls. Scale bar 50 μm. C) Heatmap of differentially expressed genes between the MB eyes and all three control groups. See also Table S1. D) Volcano plot of differentially expressed genes between MB and sham-injected eyes. Upregulated genes in red; downregulated genes in blue. E) Selected neurodegeneration-associated genes from C. Dot plots showing FPKM values compared using one-way ANOVA. F) Overlap between differentially expressed genes in MB and DBA/2J moderate stage glaucoma eyes. G) Representative images demonstrating colocalization of Apoe and P2ry12 in retinal midperiphery one month after MB injection. Arrows show co-expressing cells. Scale bar 100 μm. H) Quantification of (G). MFI = mean fluorescence intensity of Apoe in P2ry12+ cells. a.u. = arbitrary units. Compared using two-tailed Student’s t-test. I) The time-course of MB-injected wildtype animals showing weekly change in Brn3a+ RGC numbers and P2ry12+ Apoe+ cells per mm2 retina compared using one-way ANOVA (n=4–6 retinas per timepoint). J) Cross-sections of human retinas with and without glaucoma stained with IBA1, APOE, and DAPI. Arrows show co-expressing cells in retinal midperiphery. Scale bar 100 μm. K) Quantification of the number of IBA1+ cells per mm2 of retina and % of IBA1+/APOE+ double-positive cells in control and glaucoma specimens, compared using unpaired t-test with Welch’s correction and one-way ANOVA. Data in A-E and J-K were each obtained from one independent experiment, while data in G-I were pooled from two independent experiments. All results are shown as mean +/− SEM; *P<0.05, **P<0.01, ****P<0.0001, ns = not significant. See also Figures S1 and S2 and Table S1.
Figure 2.
Figure 2.. Targeting Apoe in long-lived myeloid cells protects against RGC loss in microbead-induced glaucoma.
A,B) Quantification of retinal ganglion cell (RGC) cell body numbers (A) and axon counts (B) in microbead-injected (MB) and sham-injected Cx3cr1Cre/+:Apoefl/fl and Cx3cr1WT:Apoefl/fl retinas. Compared using one-way ANOVA (n=7–9 per group). C) Apoe mRNA in sorted retinal microglia (MG) from Cx3cr1CreERT2/+:Apoefl/fl animals and Cx3cr1WT:Apoefl/fl control animals one month after sham or MB injection (n=6–8 per group). Dot plots showing FPKM values compared using one-way ANOVA. D,E) Representative images (D) and quantification (E) showing upregulation of Apoe protein in P2ry12+ cells in MB Cx3cr1WT:Apoefl/fl control animals and lack of upregulation in Cx3cr1CreERT2/+:Apoefl/fl animals, n=3–4 per group. Arrows show co-expressing cells in retinal midperiphery. Scale bar 100 μm. Compared used two-tailed Student’s t-test. F) Representative images of Brn3a+ RGCs in Cx3cr1CreERT2/+:Apoefl/fl and Cx3cr1WT:Apoefl/fl retinas one month after MB or sham injection (n=7–9 per group). Scale bar 20 μm. G) Quantification of RGC cell body numbers compared using one-way ANOVA. H,I) Representative images (H) and quantification (I) of p-phenylenediamine (PPD) staining of optic nerves from animals in (F). Scale bar 50 μm. Compared using one-way ANOVA. J) Representative positive scotopic response (pSTR) electroretinogram traces of MB and sham-injected Cx3cr1CreERT2/+:Apoefl/fl and Cx3cr1WT:Apoefl/fl eyes 1 month after MB injection. K,L) Quantification of pSTR amplitude of animals in (J) at baseline (P>0.55) (K) and one month (L) after MB injection (n=9–16 animals per group). Data in C were obtained from one independent experiment, while the rest of the data were each pooled from 2–3 independent experiments. All results are shown as mean +/− SEM; *P<0.05, **P<0.01, ***P<0.001, ****P<0.0001, ns = not significant. See also Figure S3.
Figure 3.
Figure 3.. Apoe−/− retinal microglia remain homeostatic despite elevated IOP in the microbead glaucoma model.
A) Intraocular pressure (IOP) measurements in microbead-injected (MB) and sham-injected wildtype (WT) and Apoe−/− mice (n=3–4 per group). B) Heatmap of differentially expressed microglial genes between MB and sham-injected WT and Apoe−/− mice. MGnD cluster highlighted in red. See also Table S3. C) Volcano plots of differentially expressed microglial genes between MB and sham-injected WT eyes, and MB WT and Apoe−/− eyes. D) Select neurodegeneration-associated genes from (B). Dot plots showing TPM values compared using one-way ANOVA. E) Violin plot showing differences in MGnD cluster gene upregulation between MB WT and Apoe−/− mice. F) The differential expression of the top 20 upregulated MGnD genes between MB WT and Apoe−/− mice. G) Top 25 differentially expressed canonical pathways in retinal microglia from MB WT and Apoe−/− mice as determined by Ingenuity Pathway Analysis. H,I) Representative images (H) and quantification (I) showing upregulation of Galectin-3 protein in P2ry12+ cells in MB WT retinas and lack of upregulation in MB Apoe−/− retinas (n=4 per group). Arrows show co-expressing cells in retinal midperiphery. Scale bar 100 μm. Compared used one-way ANOVA. Data in A-G were obtained from one independent experiment, while data in H-I were obtained from two pooled independent experiments. All results are shown as mean +/− SEM; *P<0.05, **P<0.01, ****P<0.0001, ns = not significant. See also Figure S4 and Table S3.
Figure 4.
Figure 4.. MGnD microglia induce RGC degeneration in an Apoe-dependent manner.
A) Schematic diagram demonstrating the experimental set-up for the apoptotic neuron injection in the brain, followed by microglia isolation and intravitreal injection of 5,000 microglial cells in the eye. B) Representative images of Brn3a+ retinal ganglion cell (RGC) staining of wildtype recipient eyes injected with PBS, M0 (non-phagocytic) and MGnD (phagocytic) microglia from Cx3cr1CreERT2/+ YFP+ donors, n=5–7 eyes per group. Scale bar 20 μm. C) Quantification of Brn3a+ RGC counts compared using one-way ANOVA. D) Donor wildtype phagocytic and non-phagocytic microglia stained for Iba1 and Apoe in the vitreous of wildtype recipients 1 week after intravitreal injection. Scale bar 100 μm. E) Quantification of Brn3a+ RGC counts of wildtype eyes injected with PBS, Apoe−/− non-phagocytic and Apoe−/− phagocytic microglia compared using one-way ANOVA, n=3–6 eyes per group. F) Comparison of RGC counts between experiments in C and E using a two-tailed Student’s t-test. The number of RGCs from eyes injected with phagocytic microglia was normalized to the average number of RGCs from eyes injected with non-phagocytic microglia of the same genotype. G,I) Representative images (G) and quantification (H, I) of Cleaved caspase-3 staining of eyes of wild-type recipients injected with PBS, non-phagocytic and phagocytic microglia from wildtype and Apoe−/− donors (n=8 eyes per group). Scale bar 10 μm. GCL = ganglion cell layer. Compared using one-way ANOVA. All data were obtained from individual independent experiments. All results are shown as mean +/− SEM, *P<0.05. **P<0.01, ****P<0.0001, ns = not significant. See also Figure S5.
Figure 5.
Figure 5.. Genetic and pharmacologic targeting of Galectin-3 protects against RGC loss in microbead-induced glaucoma.
A) Intraocular pressure (IOP) measurements of microbead-injected (MB) and sham-injected wildtype (WT) and Lgals3−/− eyes (n=6–7 per group). B) Representative images of Brn3a+ retinal ganglion cells (RGCs) in MB and sham-injected WT and Lgals3−/− retinas. Scale bar 20 μm. C) Representative images of p-phenylenediamine (PPD) staining of optic nerves from MB and sham-injected WT and Lgals3−/− animals. Scale bar 50 μm. D) Quantification of RGC cell body numbers from (B) compared using one-way ANOVA. E) Quantification of axon counts from (C) compared using one-way ANOVA. F) IOP measurements of MB and sham-injected WT eyes treated with vehicle or Galectin-3 inhibitor TD139 (n=8–10 eyes per group). Intravitreal injections of the inhibitor or vehicle were administered at 2 and 3 weeks after MB injection (red arrows). G) Representative images of Brn3a+ RGCs in WT retinas treated with vehicle or TD139 inhibitor. Scale bar 20 μm. H) Representative images of PPD staining of optic nerves from WT animals treated with vehicle or TD139 inhibitor. Scale bar 50 μm. I-J) Quantification of RGC cell body numbers from (G) and axon counts from (H) compared using one-way ANOVA. Data in A-E and F-J were each pooled from two independent experiments. All results are shown as mean +/− SEM, *P<0.05, **P<0.01, ***P<0.001, ns = not significant.
Figure 6.
Figure 6.. Humanized APOE4 mice are protected from RGC loss in the microbead glaucoma model.
A) Representative images of Brn3a+ retinal ganglion cells (RGCs) in microbead-injected (MB) and sham-injected humanized APOE2, APOE3 and APOE4 retinas (n=8–11 per group). Scale bar 20 μm. B) Representative images of p-phenylenediamine (PPD) staining of optic nerves from MB and sham-injected humanized APOE2, APOE3 and APOE4 animals. Scale bar 50 μm. C) Quantification of RGC cell body numbers in (A) compared using one-way ANOVA. D) Quantification of axon counts in (B) compared using one-way ANOVA. E) Representative images of Brn3a+ RGCs in tamoxifen-treated MB and sham-injected Cx3cr1WT:APOE3fl/fl, Cx3cr1CreERT2/+:APOE3fl/fl, Cx3cr1WT:APOE4fl/fl, Cx3cr1CreERT2/+:APOE4fl/fl retinas (n=7–8 per group). Scale bar 20 μm. F) Quantification of RGC cell body numbers compared using one-way ANOVA. G) Representative images of PPD staining of optic nerves from animals in (E). Scale bar 50 μm. H) Quantification of axon counts compared using one-way ANOVA. Data in A-D and E-H were each pooled from 2–3 independent experiments. All results are shown as mean +/− SEM, *P<0.05, **P<0.01, ns = not significant. See also Figure S6.
Figure 7.
Figure 7.. APOE4 retinal microglia remain homeostatic in glaucoma.
A) Intraocular pressure (IOP) measurements of microbead-injected (MB) and sham-injected humanized APOE3 and APOE4 male mice (n=3–4 per group). B) Heatmap of differentially expressed microglial genes between MB and sham-injected APOE3 and APOE4 mice. MGnD cluster highlighted in red. See also Table S5. C) Volcano plots of differentially expressed microglial genes between MB and sham-injected APOE3 eyes, and MB APOE3 and APOE4 eyes. D) Violin plot showing differences in MGnD cluster gene upregulation between MB APOE3 and APOE4 mice. E) Select neurodegeneration-associated genes from (B). Dot plots showing TPM values compared using one-way ANOVA. F) Top 25 differentially expressed canonical pathways in retinal microglia from MB APOE3 and APOE4 mice as determined by Ingenuity Pathway Analysis. G) Representative images showing upregulation of Galectin-3 protein in P2ry12+ cells in MB APOE3 retinas and lack of upregulation in MB APOE4 retinas, n=4–5 per group. Arrows show co-expressing cells in retinal midperiphery. Scale bar 100 μm. I) Cross-sections of human retinas from APOE3 and APOE4 allele carriers with and without glaucoma stained with IBA1, Galectin-3, and DAPI, n=4–8 per group. Scale bar 25 μm. H) Quantification of (G) shown as the number of P2ry12+ Gal-3+ cells per mm2 retina and compared used one-way ANOVA. J) Quantification of Galectin-3 mean fluorescence intensity (MFI) of human retinal sections in (I) compared used one-way ANOVA. a.u. = arbitrary units. Data in A-F and I-J were each obtained from one independent experiment, while data in G-H were obtained from two pooled independent experiments. All results are shown as mean +/− SEM, *P<0.05, **P<0.01, ns = not significant. See also Figure S6 and Table S5.

References

    1. Abreu CA, De Lima SV, Mendonca HR, Goulart CO, and Martinez AM (2017). Absence of galectin-3 promotes neuroprotection in retinal ganglion cells after optic nerve injury. Histol Histopathol 32, 253–262. - PubMed
    1. Albalawi F, Lu W, Beckel JM, Lim JC, McCaughey SA, and Mitchell CH (2017). The P2X7 Receptor Primes IL-1beta and the NLRP3 Inflammasome in Astrocytes Exposed to Mechanical Strain. Front Cell Neurosci 11, 227. - PMC - PubMed
    1. Almasieh M, and Levin LA (2017). Neuroprotection in Glaucoma: Animal Models and Clinical Trials. Annu Rev Vis Sci 3, 91–120. - PubMed
    1. Alqawlaq S, Flanagan JG, and Sivak JM (2019). All roads lead to glaucoma: Induced retinal injury cascades contribute to a common neurodegenerative outcome. Exp Eye Res 183, 88–97. - PubMed
    1. Anderson MG, Nair KS, Amonoo LA, Mehalow A, Trantow CM, Masli S, and John SW (2008). GpnmbR150X allele must be present in bone marrow derived cells to mediate DBA/2J glaucoma. BMC Genet 9, 30. - PMC - PubMed

Publication types