Shaping Information Processing: The Role of Oscillatory Dynamics in a Working Memory Task
- PMID: 35977824
- PMCID: PMC9480873
- DOI: 10.1523/ENEURO.0489-21.2022
Shaping Information Processing: The Role of Oscillatory Dynamics in a Working Memory Task
Abstract
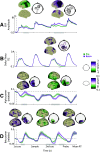
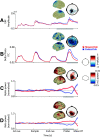
Neural oscillations are thought to reflect low-level operations that can be used for higher-level cognitive functions. Here, we investigated the role of brain rhythms in the 1-30 Hz range by recording MEG in human participants performing a visual delayed match-to-sample paradigm in which orientation or spatial frequency of sample and probe gratings had to be matched. A cue occurring before or after sample presentation indicated the to-be-matched feature. We demonstrate that alpha/beta power decrease tracks the presentation of the informative cue and indexes faster responses. Moreover, these faster responses coincided with an augmented phase alignment of slow oscillations, as well as phase-amplitude coupling between slow and fast oscillations. Importantly, stimulus decodability was boosted by both low alpha power and high beta power. In summary, we provide support for a comprehensive framework in which different rhythms play specific roles: slow rhythms control input sampling, while alpha (and beta) gates the information flow, beta recruits task-relevant circuits, and the timing of faster oscillations is controlled by slower ones.
Keywords: MEG; alpha rhythm; beta rhythm; brain oscillations; working memory.
Copyright © 2022 ElShafei et al.
Figures


Similar articles
-
The roles of alpha oscillation in working memory retention.Brain Behav. 2019 Apr;9(4):e01263. doi: 10.1002/brb3.1263. Epub 2019 Mar 19. Brain Behav. 2019. PMID: 30887701 Free PMC article.
-
Visual working memory recruits two functionally distinct alpha rhythms in posterior cortex.eNeuro. 2022 Sep 27;9(5):ENEURO.0159-22.2022. doi: 10.1523/ENEURO.0159-22.2022. Online ahead of print. eNeuro. 2022. PMID: 36171059 Free PMC article.
-
Tracking Transient Changes in the Neural Frequency Architecture: Harmonic Relationships between Theta and Alpha Peaks Facilitate Cognitive Performance.J Neurosci. 2019 Aug 7;39(32):6291-6298. doi: 10.1523/JNEUROSCI.2919-18.2019. Epub 2019 Jun 7. J Neurosci. 2019. PMID: 31175211 Free PMC article.
-
Brain oscillatory correlates of working memory constraints.Brain Res. 2011 Feb 23;1375:93-102. doi: 10.1016/j.brainres.2010.12.048. Epub 2010 Dec 21. Brain Res. 2011. PMID: 21172316 Review.
-
Working memory and neural oscillations: α-γ versus θ-γ codes for distinct WM information?Trends Cogn Sci. 2014 Jan;18(1):16-25. doi: 10.1016/j.tics.2013.10.010. Epub 2013 Nov 19. Trends Cogn Sci. 2014. PMID: 24268290 Review.
Cited by
-
ROSE: A Neurocomputational Architecture for Syntax.ArXiv [Preprint]. 2023 Mar 15:arXiv:2303.08877v1. ArXiv. 2023. PMID: 36994166 Free PMC article. Preprint.
-
Alpha and Beta Oscillations Differentially Support Word Production in a Rule-Switching Task.eNeuro. 2024 Apr 2;11(4):ENEURO.0312-23.2024. doi: 10.1523/ENEURO.0312-23.2024. Print 2024 Apr. eNeuro. 2024. PMID: 38490743 Free PMC article.
-
Sub-acute stroke demonstrates altered beta oscillation and connectivity pattern in working memory.J Neuroeng Rehabil. 2024 Dec 4;21(1):212. doi: 10.1186/s12984-024-01516-5. J Neuroeng Rehabil. 2024. PMID: 39633420 Free PMC article.
-
Single-pulse Transcranial Magnetic Stimulation Affects Working-memory Performance via Posterior Beta-band Oscillations.J Cogn Neurosci. 2024 Sep 1;36(9):1827-1846. doi: 10.1162/jocn_a_02194. J Cogn Neurosci. 2024. PMID: 38820555 Free PMC article.
-
Harmonic memory signals in the human cerebral cortex induced by semantic relatedness of words.NPJ Sci Learn. 2024 Feb 14;9(1):6. doi: 10.1038/s41539-024-00221-1. NPJ Sci Learn. 2024. PMID: 38355685 Free PMC article.
References
Publication types
MeSH terms
LinkOut - more resources
Full Text Sources
