

Association of Blood Pressure Lowering Intensity With White Matter Network Integrity in Patients With Cerebral Small Vessel Disease
- PMID: 35977831
- PMCID: PMC9620809
- DOI: 10.1212/WNL.0000000000201018
Association of Blood Pressure Lowering Intensity With White Matter Network Integrity in Patients With Cerebral Small Vessel Disease
Abstract
Background and objectives: Diffusion tensor imaging (DTI) networks integrate damage from a variety of pathologic processes in cerebral small vessel disease (SVD) and may be a sensitive marker to detect treatment effects. We determined whether brain network analysis could detect treatment effects in the PRESERVE trial data set, in which intensive vs standard blood pressure (BP) lowering was compared. The primary end point of DTI had not shown treatment differences.
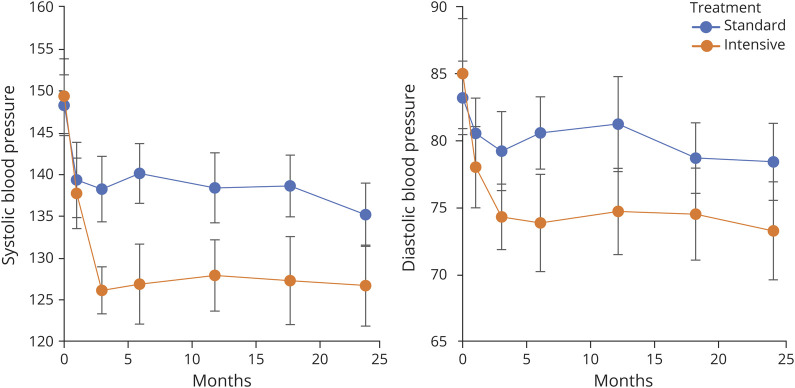
Methods: Participants with lacunar stroke were randomized to standard (systolic 130-140 mm Hg) or intensive (systolic ≤ 125 mm Hg) BP lowering and followed for 2 years with MRI at baseline and at 2 years. Graph theory-based metrics were derived from DTI data to produce a measure of network integrity weighted global efficiency and compared with individual MRI markers of DTI, brain volume, and white matter hyperintensities.
Results: Data were available in 82 subjects: standard n = 40 (mean age 66.3 ± 1.5 years) and intensive n = 42 (mean age 69.6 ± 1.0 years). The mean (SD) systolic BP was reduced by 13(14) and 23(23) mm Hg in the standard and intensive groups, respectively (p < 0.001 between groups). Significant differences in diffusion network metrics were found, with improved network integrity (weighted global efficiency, p = 0.002) seen with intensive BP lowering. In contrast, there were no significant differences in individual MRI markers including DTI histogram metrics, brain volume, or white matter hyperintensities.
Discussion: Brain network analysis may be a sensitive surrogate marker in trials in SVD. This work suggests that measures of brain network efficiency may be more sensitive to the effects of BP control treatment than conventional DTI metrics.
Trial registration information: The trial is registered with the ISRCTN Registry (ISRCTN37694103; doi.org/10.1186/ISRCTN37694103) and the NIHR Clinical Research Network (CRN 10962; public-odp.nihr.ac.uk/QvAJAXZfc/opendoc.htm?document=crncc_users%5Cfind%20a%20clinical%20research%20study.qvw&lang=en-US&host=QVS%40crn-prod-odp-pu&anonymous=true).
Classification of evidence: This study provides Class II evidence that intensive BP lowering in patients with SVD results in improved brain network function when assessed by DTI-based brain network metrics.
Copyright © 2022 The Author(s). Published by Wolters Kluwer Health, Inc. on behalf of the American Academy of Neurology.
Figures


References
-
- Pantoni L. Cerebral small vessel disease: from pathogenesis and clinical characteristics to therapeutic challenges. Lancet Neurol. 2010;9(7):689-701. - PubMed
-
- Bakker SL, de Leeuw FE, de Groot JC, Hofman A, Koudstaal PJ, Breteler MM. Cerebral vasomotor reactivity and cerebral white matter lesions in the elderly. Neurology. 1999;52(3):578-583. - PubMed
-
- Immink RV, van Montfrans GA, Stam J, Karemaker JM, Diamant M, van Lieshout JJ. Dynamic cerebral autoregulation in acute lacunar and middle cerebral artery territory ischemic stroke. Stroke. 2005;36(12):2595-2600. - PubMed
Publication types
MeSH terms
Substances
Associated data
Grants and funding
LinkOut - more resources
Full Text Sources
Research Materials
Miscellaneous