. 2022 Aug 17;13(8):717.
doi: 10.1038/s41419-022-05165-1.

Global crotonylome reveals hypoxia-mediated lamin A crotonylation regulated by HDAC6 in liver cancer

Affiliations

Global crotonylome reveals hypoxia-mediated lamin A crotonylation regulated by HDAC6 in liver cancer

Dan Zhang et al. Cell Death Dis. .

Abstract

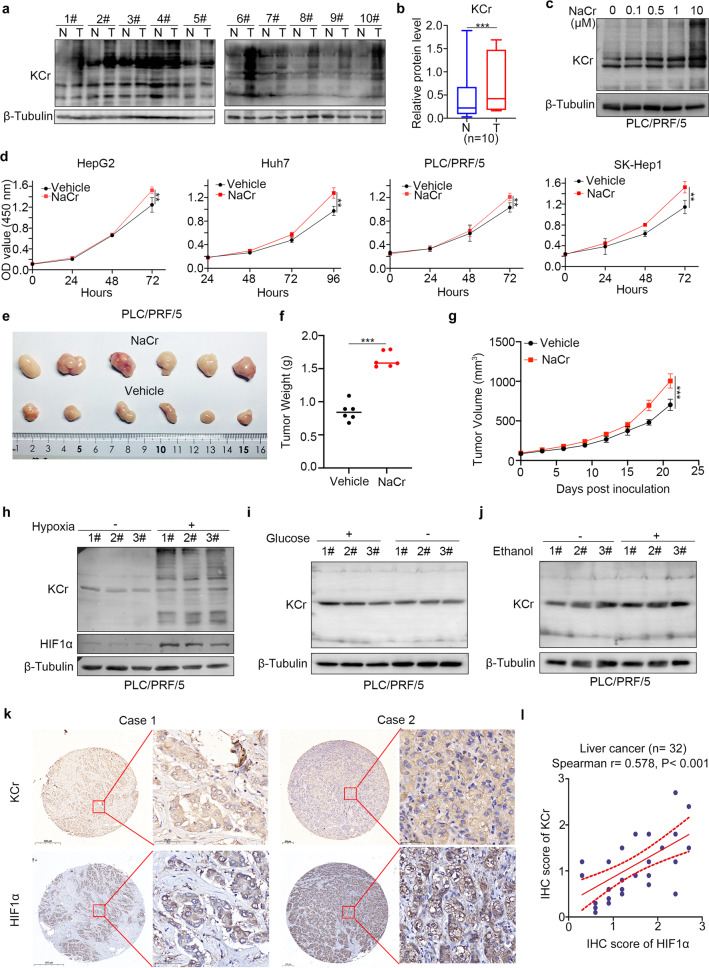
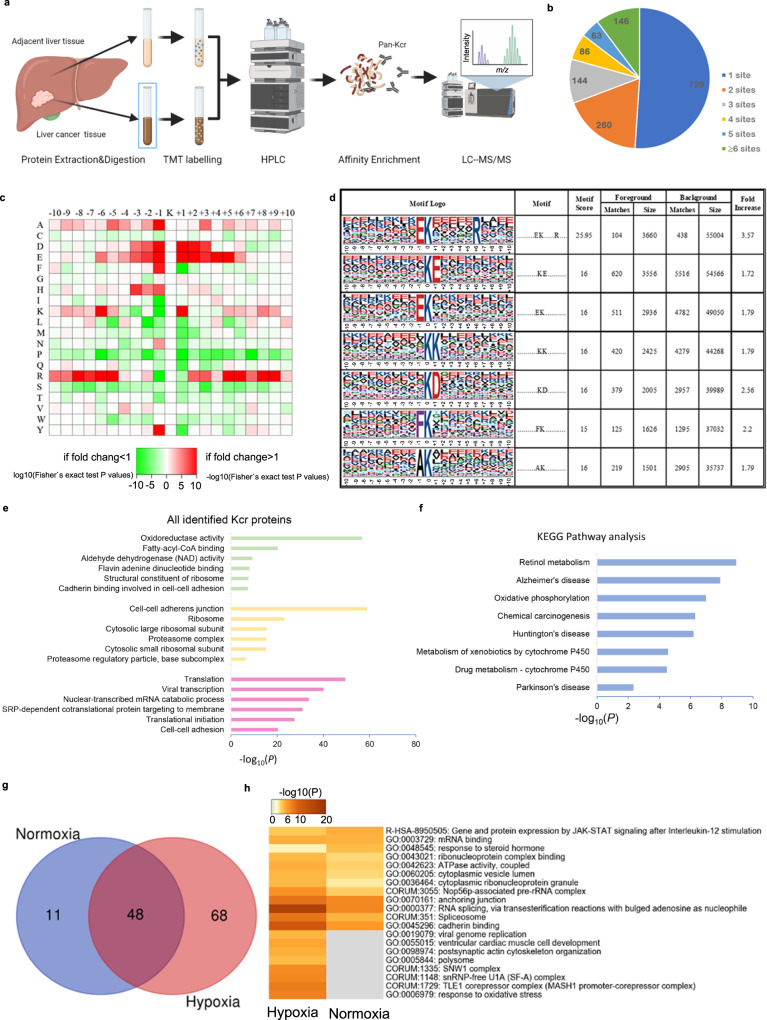
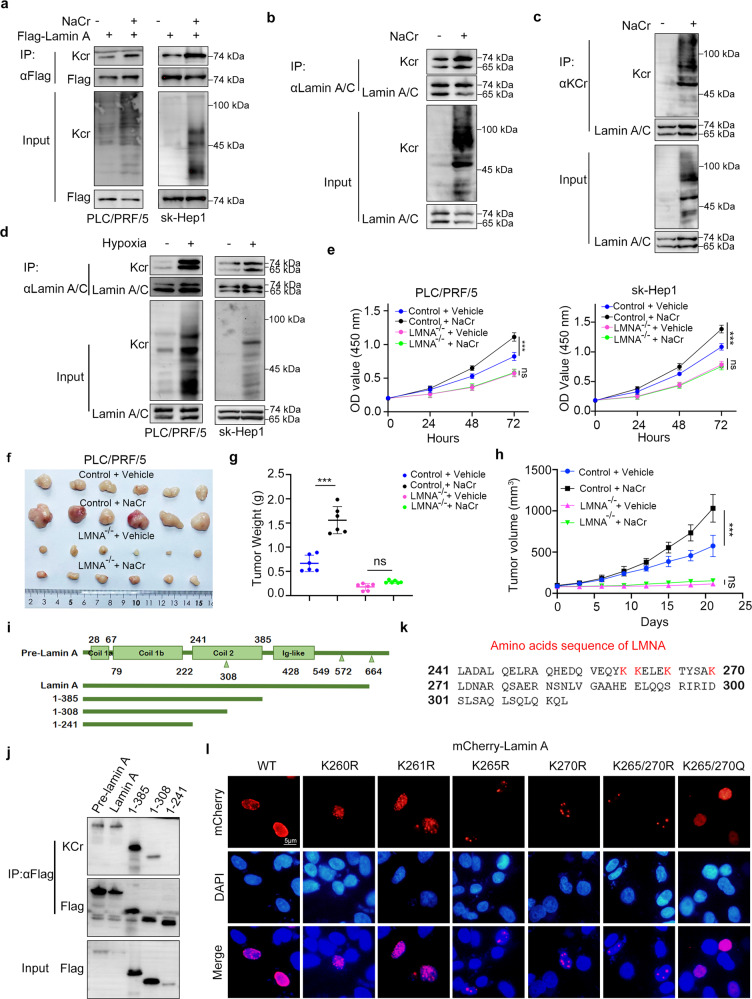
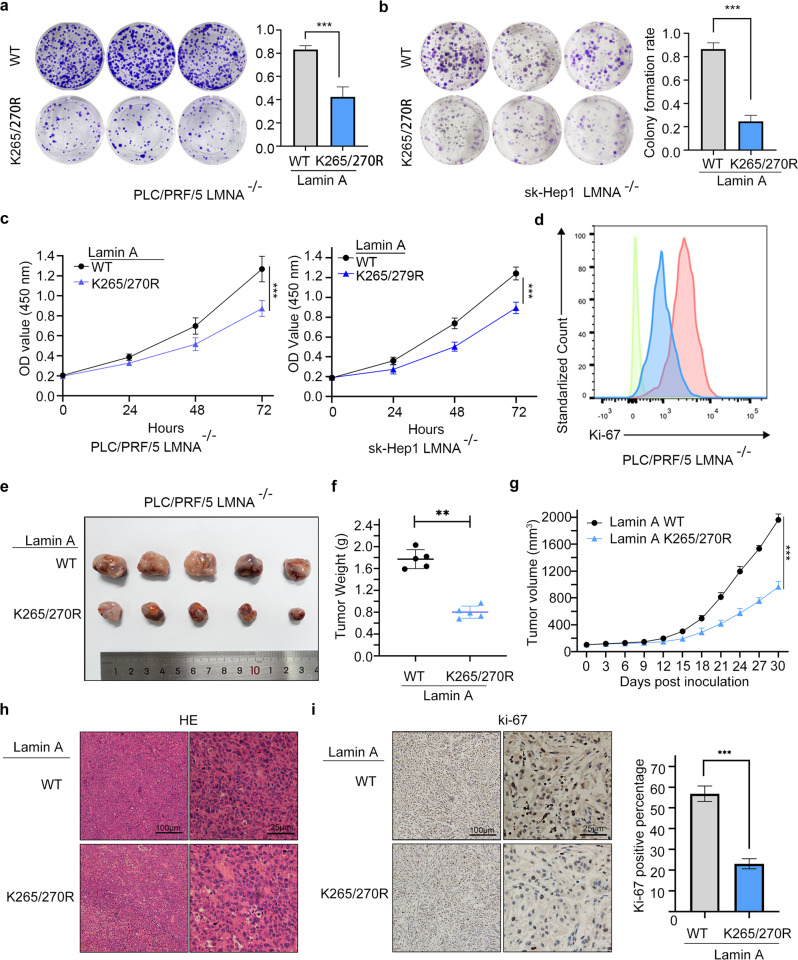
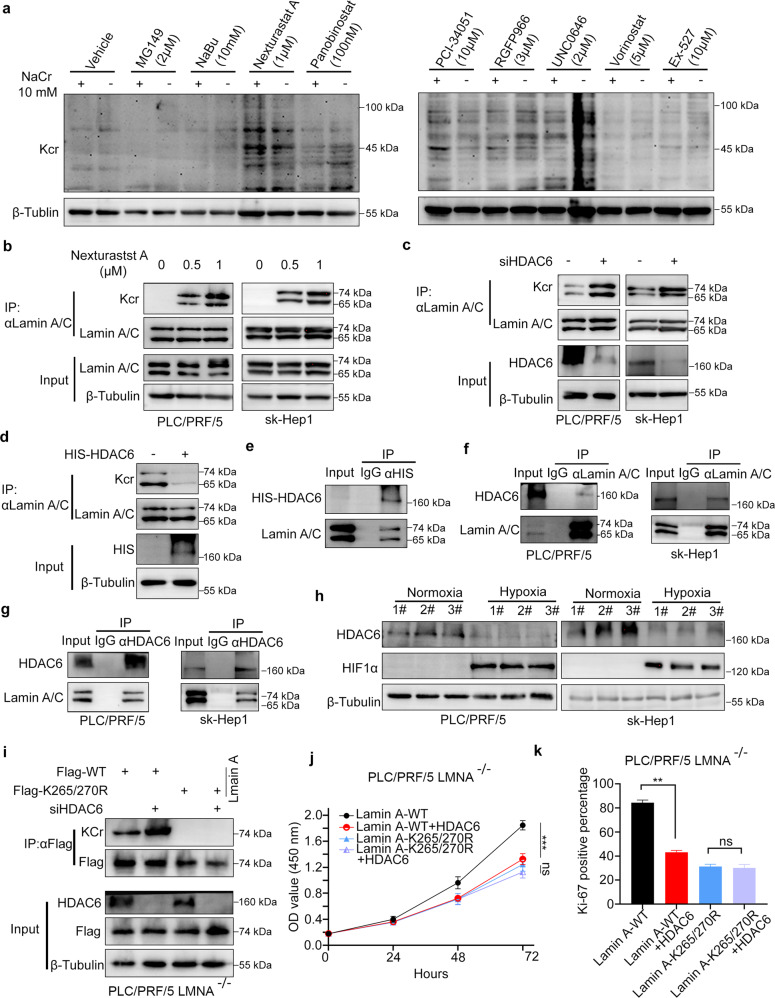
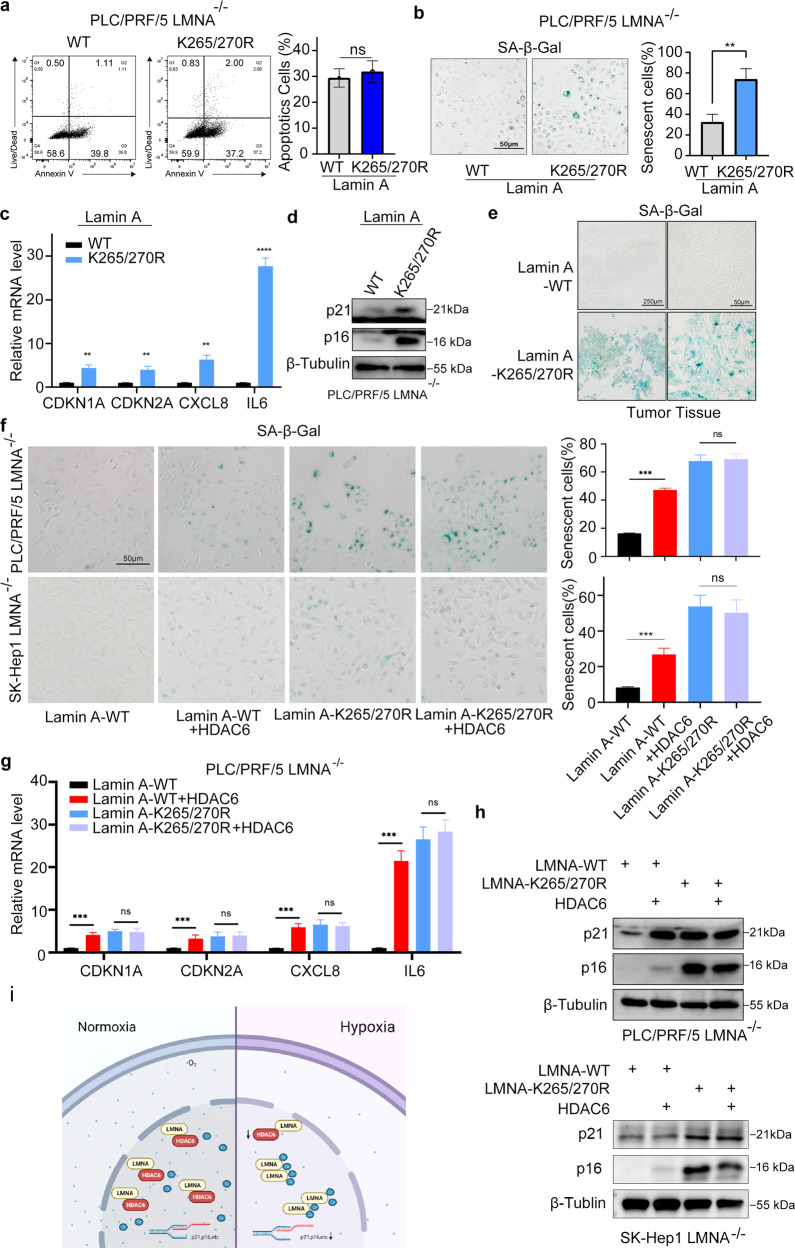
Lysine crotonylation is a recently discovered post-translation modification involved in transcription regulation, cell signal transduction, and other processes. Scientists have identified several crotonylases and decrotonylases of histones, including P300/CBP, HDACs, and SIRTs. However, the regulation of non-histone protein crotonylation remains unclear. In the current study, we verified that crotonylation was upregulated in hypoxia and promoted liver cancer cell growth. We performed TMT-labeled quantitative lysine crotonylome analysis in 12 pairs of hepatocellular carcinoma and adjacent liver tissue and identified 3,793 lysine crotonylation sites in 1,428 proteins. We showed that crotonylation of lamin A at the site of K265/270 maintains its subcellular position, promotes liver cancer cell proliferation, and prevents cellular senescence. Our data indicate that HDAC6 is the decrotonylase of lamin A and downregulated in response to hypoxia, resulting in lamin A K265/270cr. Taken together, our study reveals the lamin A crotonylation in liver cancer progression and fills the research gap in non-histone protein crotonylation function.


Conflict of interest statement

The authors declare no competing interests.

Figures

Fig. 1
Fig. 1. Lysine crotonylation associated with hypoxia contributes to liver cancer cell proliferation.
a, b Kcr level of liver cancer tissue (T) and adjacent liver tissue (N) was measured by Western blot with pan-Kcr. Image J was applied to quantify the blots. Beta-tubulin served as an internal reference. ***,P < 0.001. c Western blot analysis of Kcr level in PLC/PRF/5 cells treated with NaCr at indicated concentration. d CCK-8 analysis of HepG2, Huh7, PLC/PFR/5, and SK-Hep1 cells treated with 10 mM NaCr or vehicle. Data presented as the mean ± SEM. N = 3, ***, P < 0.001. e–g Subcutaneous xenograft assay of PLC/PFR/5 cells treated with 12 mmol/kg body wt NaCr or vehicle (N = 6). Data presented as the mean ± SEM of three independent experiments. **, P < 0.01; ***, P < 0.001. hj Western blot analyzed Kcr level of PLC/PRF/5 cells treated with indicated stimulus. Cells were cultured in 1% O2, cultured in glucose-free DMEM, or treated with 100 mM ethanol for 12 h. k HIF1α expression and Kcr level were detected with IHC in a tissue microarray. Typical image of IHC is shown in (k). l Spearman correlation analysis of IHC score was performed. P values are indicated.
Fig. 2
Fig. 2. Identification of the proteins with Kcr in liver cancer.
a A workflow schematic illustration showing TMT-labeled LC-MS/MS analysis of Kcr proteins in hepatocellular carcinoma and adjacent liver tissue. b The number of identified Kcr sites of each protein shown in pie chart. c Motif analysis of all indicated Kcr peptide. d Amino acid preference on both sides of the crotonylated lysine. e, f Gene Ontology and KEGG analysis of identified Kcr proteins. g The number of Kcr proteins identified in PLC/PRF/5 cells treated with hypoxia and normoxia. h Intracellular pathway enrichment analysis of the identified Kcr proteins in both groups.
Fig. 3
Fig. 3. Characterization of crotonylation of lamin A.
a Immunoprecipitation and Western blot analysis of crotonylation of lamin A with or without NaCr incubation. b, c Immunoprecipitation and Western blot analysis were performed to detect the crotonylation of endogenous lamin A. d Crotonylation of lamin A in hypoxia. e CCK-8 assays in PLC/PRF/5, sk-Hep1,PLC/PRF/5 LMNA–/– and sk-Hep1 LMNA–/– cells with or without NaCr incubation. Data presented as the mean ± SEM. N = 3, ns, not significant; ***, P < 0.001. f Subcutaneous xenograft assay of PLC/PRF/5 cells and PLC/PRF/5 LMNA–/– cells treated with or without NaCr (N = 6). Data presented as the mean ± SEM. Ns, not significant; ***, P < 0.001. g Tumor weight of the subcutaneous xenograft at day 21 after inoculation. h Tumor volume of subcutaneous xenograft shown in line graph. i Schematic representation of lamin A motif and the recombinant of lamin A. j The Kcr of recombinant lamin A was analyzed by immunoprecipitation and Western blot. k 241–308 amino acids sequence of lamin A. l Immunofluorescence assay using anti-mCherry antibodies. NaCr was used at a concentration of 10 mM for in vitro assay and 12 mmol/kg body wt for in vivo assay.
Fig. 4
Fig. 4. The crotonylation of lamin A promotes the proliferation of liver cancer cells in vivo and in vitro.
Colony formation (a, b) and CCK-8 (c) assay in PLC/PRF/5 LMNA–/– and sk-Hep1 LMNA–/– cells with overexpression of lamin A WT or K265/270 R mutant. Data presented as the mean ± SEM. N = 3, ***, P < 0.001. d Ki-67 expression was analyzed by flow cytometry. Data presented as the mean ± SEM. N = 3, ***, P < 0.001. e Subcutaneous xenograft assay of PLC/PRF/5 LMNA–/– cells with overexpression of lamin A WT or K265/270 R mutant (N = 5). f Tumor weight of the subcutaneous xenograft at day 30 after inoculation (N = 5). Data presented as the mean ± SEM. **, P < 0.01. g Tumor volume of subcutaneous xenograft shown in line graph (N = 5). Data presented as the mean ± SEM. ***, P < 0.001. h HE stain of the xenograft tumor tissue. i Ki-67 expression was detected by IHC. Data presented as the mean ± SEM. N = 5, ***, P < 0.001.
Fig. 5
Fig. 5. HDAC6 was associated with the crotonylation of Lamin A.
a Kcr level of PLC/PRF/5 cells treated with small molecular inhibitors and NaCr (10 mM) was measured by Western blot. The crotonylation of lamin A with indicated concentration of Nexturastat A (b), knock down of HDAC6 (c) or overexpression HDAC6 (d) was detected by IP followed with Western blot. eg The exogenous and endogenous interaction of HDAC6 and lamin A was determined by co-immunoprecipitation (Co-IP). h HDAC6 expression in hypoxia and normoxia was detected by Western blot. i The crotonylation of exogenous WT or mutant lamin A in LMNA-KO PLC/PRF/5 cells with or without knock-down of HDAC6. CCK-8 assay (j) AND Ki-67 expression (k) in LMNA-KO PLC/PRF/5 cells with overexpression of WT of mutant lamin A and HDAC6. Data presented as the mean ± SEM. N = 3, ns, not significant; **, P < 0.01; ***, P < 0.001.
Fig. 6
Fig. 6. HDAC6/lamin A complex regulated the senescence of liver cancer cells.
a PE/annexin-V staining of PLC/PRF/5 LMNA–/– cells with the overexpression of WT or mutant lamin A. Data presented as the mean ± SEM. N = 3, ns, not significant. b SA-β-Gal staining of PLC/PRF/5 LMNA–/– cells with the overexpression of WT or mutant lamin A. Data presented as the mean ± SEM. N = 3, **, P < 0.01. c Relative mRNA levels of p21, p16, IL-6, and IL-8 were quantified with qPCR. Data presented as the mean ± SEM. N = 3, **, P < 0.01; ***, P < 0.001. d The expression of p21 and p16 was detected by Western blot. e SA-β-Gal staining of subcutaneous xenograft tumor tissue. f SA-β-Gal staining of sk-Hep1 LMNA–/– and PLC/PRF/5 LMNA–/– cells with overexpression of WT or mutant lamin A and HDAC6. Data presented as the mean ± SEM. N = 3, ns, not significant; ***, P < 0.001. g The relative mRNA levels of p21, p16, IL-6, and IL-8 were quantified by qPCR. Data presented as the mean ± SEM. N = 3, ns, not significant; ***, P < 0.001. h The expression of p21 and p16 was detected with Western blot. i A hypothetical model showing that lamin A crotonylation was upregulated in hypoxia due to the downregulation of HDAC, leading to liver cancer senescence bypassing and proliferation.

Similar articles

Cited by

References

    1. Narita T, Weinert BT, Choudhary C. Functions and mechanisms of non-histone protein acetylation. Nat Rev Mol Cell Biol. 2019;20:156–74. doi: 10.1038/s41580-018-0081-3. - DOI - PubMed
    1. Xie Z, Zhang D, Chung D, Tang Z, Huang H, Dai L, et al. Metabolic regulation of gene expression by histone lysine beta-hydroxybutyrylation. Mol Cell. 2016;62:194–206. doi: 10.1016/j.molcel.2016.03.036. - DOI - PMC - PubMed
    1. Chen Y, Sprung R, Tang Y, Ball H, Sangras B, Kim SC, et al. Lysine propionylation and butyrylation are novel post-translational modifications in histones. Mol Cell Proteom. 2007;6:812–9. doi: 10.1074/mcp.M700021-MCP200. - DOI - PMC - PubMed
    1. Tan M, Luo H, Lee S, Jin F, Yang JS, Montellier E, et al. Identification of 67 histone marks and histone lysine crotonylation as a new type of histone modification. Cell. 2011;146:1016–28. doi: 10.1016/j.cell.2011.08.008. - DOI - PMC - PubMed
    1. Zhang Z, Tan M, Xie Z, Dai L, Chen Y, Zhao Y. Identification of lysine succinylation as a new post-translational modification. Nat Chem Biol. 2011;7:58–63. doi: 10.1038/nchembio.495. - DOI - PMC - PubMed

Publication types