. 2022 Aug 17;13(1):4848.
doi: 10.1038/s41467-022-32515-6.

Direct control of lysosomal catabolic activity by mTORC1 through regulation of V-ATPase assembly

Affiliations

Direct control of lysosomal catabolic activity by mTORC1 through regulation of V-ATPase assembly

Edoardo Ratto et al. Nat Commun. .

Abstract

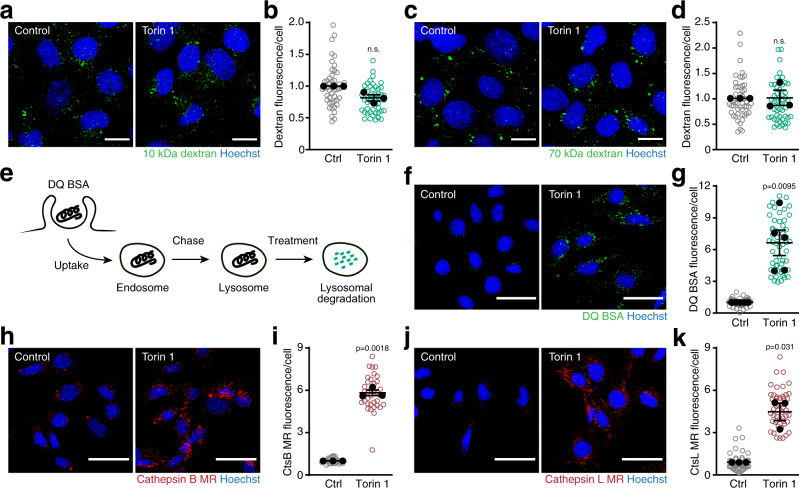
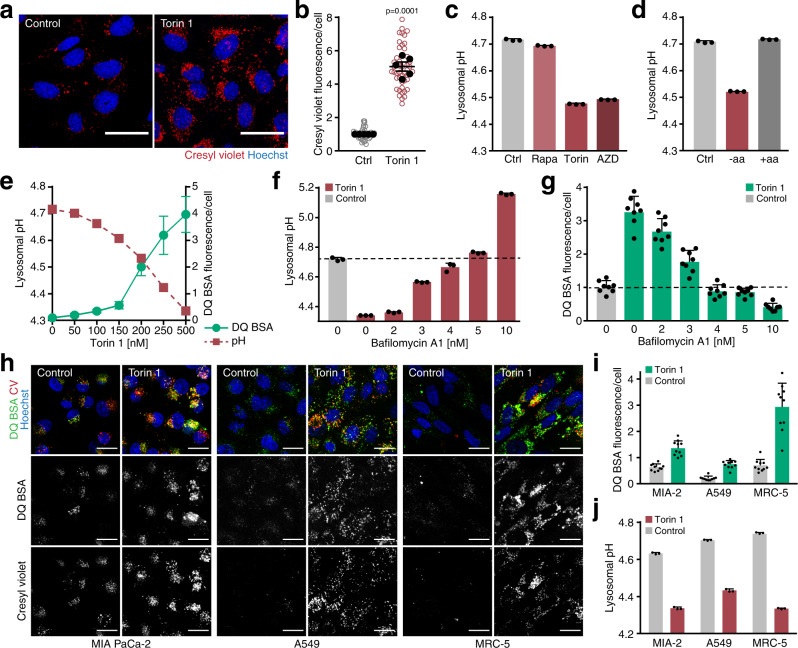
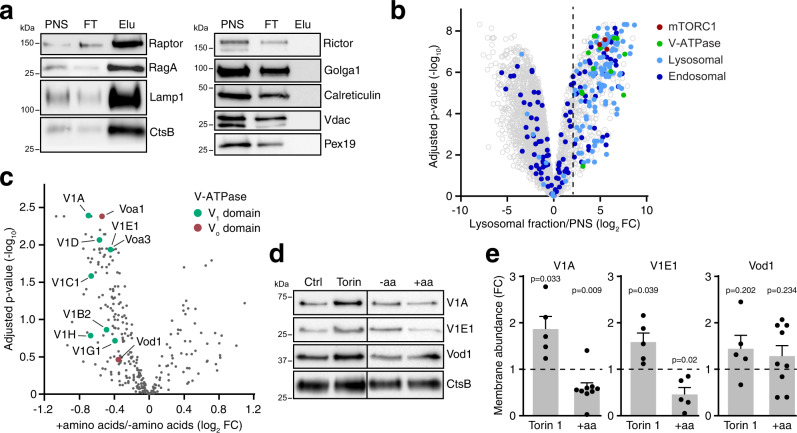
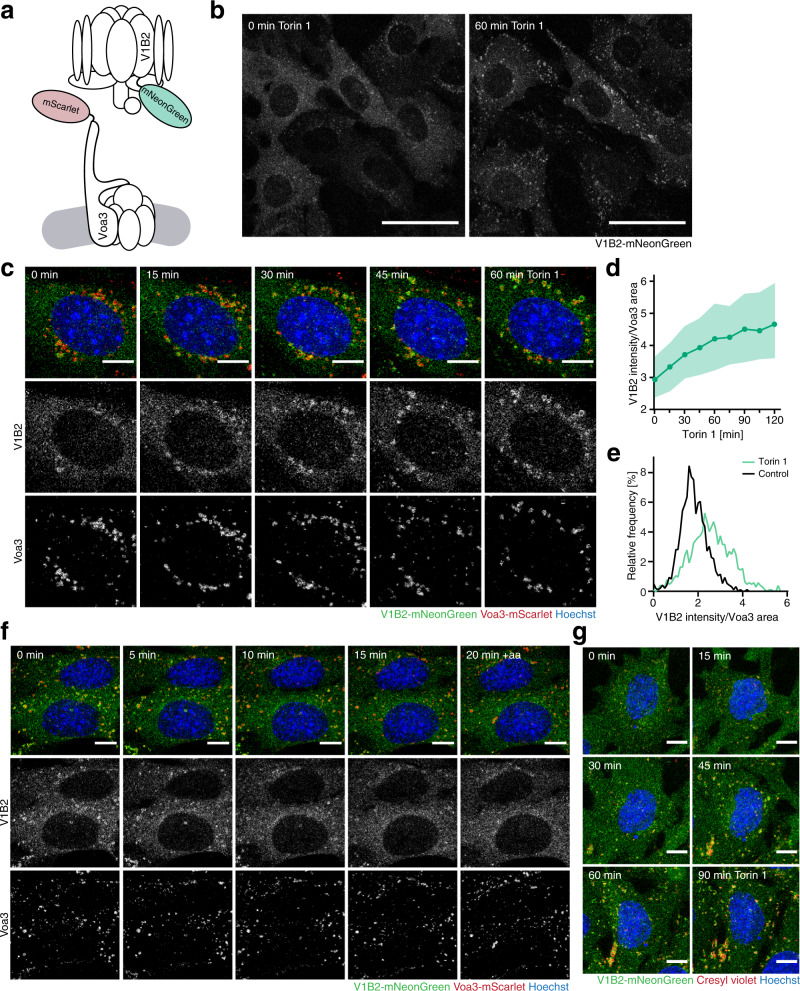
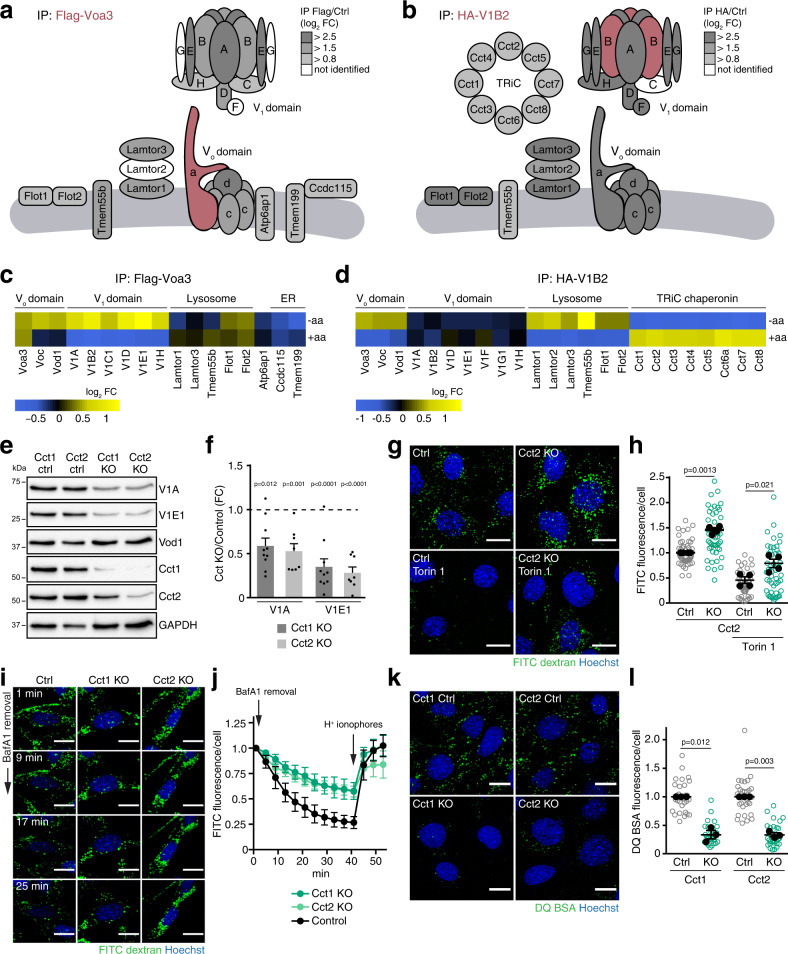
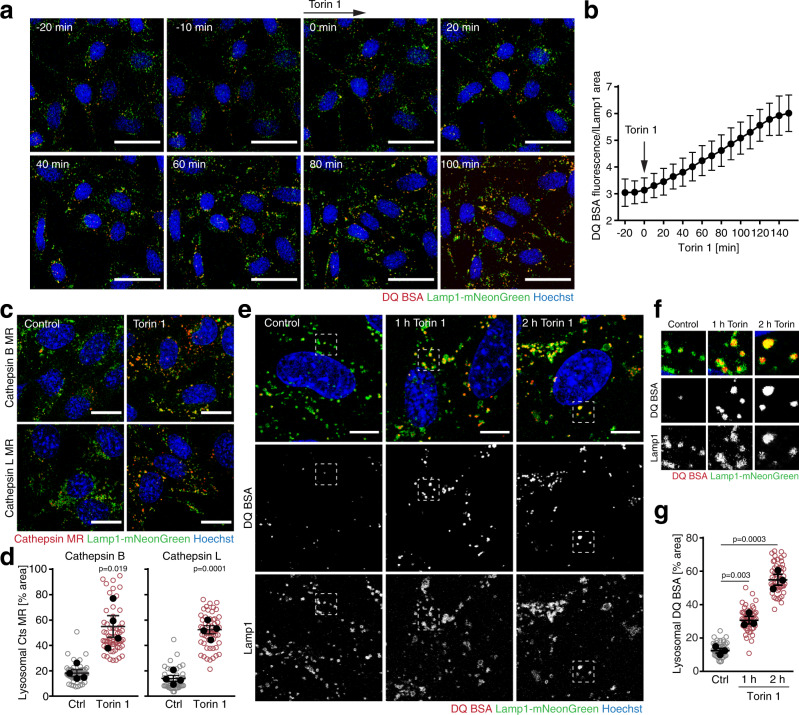
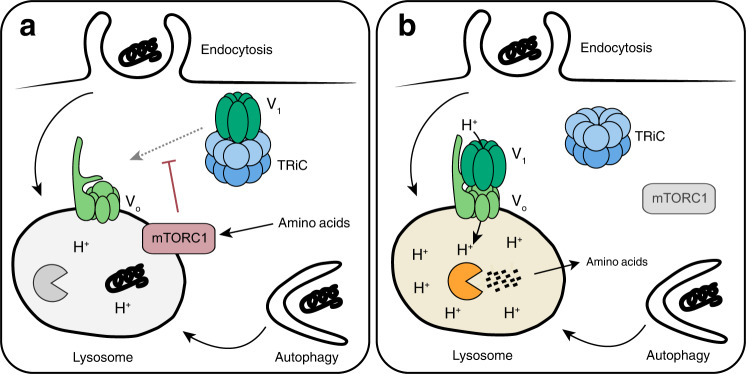
Mammalian cells can acquire exogenous amino acids through endocytosis and lysosomal catabolism of extracellular proteins. In amino acid-replete environments, nutritional utilization of extracellular proteins is suppressed by the amino acid sensor mechanistic target of rapamycin complex 1 (mTORC1) through an unknown process. Here, we show that mTORC1 blocks lysosomal degradation of extracellular proteins by suppressing V-ATPase-mediated acidification of lysosomes. When mTORC1 is active, peripheral V-ATPase V1 domains reside in the cytosol where they are stabilized by association with the chaperonin TRiC. Consequently, most lysosomes display low catabolic activity. When mTORC1 activity declines, V-ATPase V1 domains move to membrane-integral V-ATPase Vo domains at lysosomes to assemble active proton pumps. The resulting drop in luminal pH increases protease activity and degradation of protein contents throughout the lysosomal population. These results uncover a principle by which cells rapidly respond to changes in their nutrient environment by mobilizing the latent catabolic capacity of lysosomes.


Conflict of interest statement

The authors declare no competing interests.

Figures

Fig. 1
Fig. 1. Degradation of extracellular proteins is suppressed by mTORC1 at the step of lysosomal catabolism.
ad Intracellular levels of fluorescently labelled a, b 10 kDa dextran, c, d 70 kDa dextran in MEFs after 45 min of uptake. Torin 1 [400 nM] was added 15 min before the experiment. Scale bars = 20 µm. e Schematic of lysosomal protein degradation assay based on preloading lysosomes with DQ BSA and measuring dequenching of DQ BSA fluorescence upon proteolysis. f, g Degradation of lysosomally preloaded DQ BSA in MEFs after 1 h ± torin 1 [400 nM]. Scale bars = 50 µm. hk Degradation of magic red (MR) substrates for h, i cathepsin B, j, k cathepsin L in MEFs after 1 h ± torin 1 [250 nM]. Scale bars = 50 µm. Data are normalized replicate mean ± SEM (closed circles) and fields of view (open circles; ≥10 per replicate). b, d, i, k n = 3, g n = 5 biologically independent experiments. p-values were calculated using a two-tailed unpaired t-test with Welch correction. n.s. not significant. Source data are provided as a Source data file.
Fig. 2
Fig. 2. mTORC1 inactivation increases lysosomal protein catabolism through lysosomal acidification.
a Cresyl violet accumulation in MEFs after 1 h ± torin 1 [400 nM]. Scale bars = 50 µm. b Quantification of cresyl violet accumulation in cells treated as in a; data are normalized replicate mean ± SEM (closed circles) and fields of view (open circles; ≥8 per replicate). c Lysosomal pH of MEFs after 1 h rapamycin [100 nM], torin 1 [250 nM], or AZD8055 [250 nM], quantified by lysosensor. d Lysosomal pH of MEFs after 1 h amino acid starvation (−aa), or 1 h aa starvation + 30 min aa restimulation (+aa), quantified by lysosensor. e Lysosomal pH, quantified by lysosensor, and degradation of lysosomally preloaded DQ BSA in MEFs after 1 h torin 1 at indicated concentrations. Measurements were conducted separately under identical conditions. f Lysosomal pH, quantified by lysosensor, in MEFs after 1 h torin 1 [400 nM] and bafilomycin A1 at indicated concentrations. The dashed line indicates mean lysosomal pH of control cells. g Degradation of lysosomally preloaded DQ BSA in MEFs after 1 h torin 1 [400 nM] and bafilomycin A1 at indicated concentrations. The dashed line indicates mean DQ BSA fluorescence of control cells. h Degradation of lysosomally preloaded DQ BSA and accumulation of cresyl violet (CV) in human carcinoma cell lines (MIA PaCa-2, A549) and fibroblasts (MRC-5) after 3 h ± torin 1 [400 nM]. Scale bars = 20 µm. i Quantification of DQ BSA fluorescence of cell lines shown in h. j Lysosomal pH in cell lines as in h after 1 h ± torin 1, quantified by lysosensor. b n = 5 biologically independent experiments; p-value was calculated using a two-tailed unpaired t-test with Welch correction. cf, j Lysosensor data are mean ± SD (3 technical replicates). e, g, i DQ BSA data are mean ± SD (8–10 fields of view). cj One representative of n = 3 biologically independent experiments. Source data are provided as a Source data file.
Fig. 3
Fig. 3. Lysosomal V-ATPase increases in response to mTORC1 inactivation.
a Magnetic enrichment of lysosomes from MEFs, analysed by western blot. PNS: post nuclear supernatant; FT: column flow through; Elu: lysosomal eluate. Contaminating organelle markers are Golga1 (Golgi), Calreticulin (ER), Vdac (mitochondria), Pex19 (peroxisomes). b Enriched proteins in lysosomal fractions, quantified by label-free mass spectrometry. The dashed line (log2 fold change >2) demarcates the cut-off for lysosomal proteins. c Changes in lysosomal proteins after 1 h aa starvation + 30 min aa restimulation (+aa) versus 1 h aa starvation (−aa) in MEFs, quantified by label-free mass spectrometry. d V-ATPase subunits in membrane fractions of dextran-loaded lysosomes from MEFs after 1 h ± torin 1 [400 nM], or after 1 h amino acid starvation ± 30 min aa restimulation (±aa), analysed by western blot. e V-ATPase subunit abundance changes in membrane fractions, quantified by western blot for torin 1/control and +aa/−aa as in d. Data are normalized replicate mean ± SEM. Dashed lines indicate protein abundance in the control/−aa groups. a One representative of n = 5 biologically independent experiments. b, c n = 5, e n = 5 (V1A, V1E, Vod1 + torin 1, V1E + aa) or n = 9 (V1A, Vod1 +aa) biologically independent experiments. In b, c, adjusted p-values were calculated using limma moderated t-statistic and adjusted with the Benjamini–Hochberg method for multiple testing. In e, p-values were calculated using a one sample t-test with a hypothetical mean of 1. Source data are provided as a Source data file.
Fig. 4
Fig. 4. mTORC1 controls reversible assembly of the V-ATPase at lysosomes.
a Schematic of the live cell imaging assay for lysosomal V-ATPase assembly. b Subcellular localization of V1B2-mNeonGreen before and 60 min after treatment with torin 1 [400 nM]. Scale bars = 50 µm. c Subcellular localization of V1B2-mNeonGreen and Voa3-mScarlet in MEFs over time after addition of torin 1 [400 nM]. Scale bars = 10 µm. d Quantification of V1B2-mNeonGreen recruitment to Voa3-mScarlet-containing lysosomes in cells shown in c. Data are represented as median ± IQR (≥7000 organelles in 12 fields of view with a total of ≥140 cells). e Relative intensity distribution of V1B2-mNeonGreen in Voa3-mScarlet-containing lysosomes before and after 1 h torin 1 in cells shown in c. f Subcellular localization of V1B2-mNeonGreen and Voa3-mScarlet in MEFs over time after 1 h amino acid starvation followed by amino acid restimulation (+aa). Scale bars = 10 µm. g Subcellular localization of V1B2-mNeonGreen and cresyl violet in MEFs over time upon torin 1 treatment [400 nM]. Scale bars = 10 µm. One representative of b, g n = 5, cf n = 3 biologically independent experiments.
Fig. 5
Fig. 5. The V-ATPase V1 domain reversibly associates with the cytosolic chaperonin TRiC.
a, b Cartoon summarizing SILAC quantification data of proteins in Co-IPs from MEFs with a Flag-Voa3, b HA-V1B2. c, d Changes in protein abundance in SILAC Co-IPs with c Flag-Voa3, d HA-V1B2 for 1 h aa starvation (−aa) versus full medium, or for 1 h aa starvation + 30 min aa restimulation versus 1 h aa starvation (+aa). e Changes in V-ATPase subunit abundance in Cct1 and Cct2-deficient MEFs, analysed by western blot. f Western blot quantification of V-ATPase subunit abundance changes in Cct1 and Cct2-deficient cells as in e. Data are normalized replicate mean ± SEM. The dashed line indicates protein levels in control cells. g Fluorescence quenching of lysosomally loaded FITC-dextran in Cct2-deficient MEFs ± 1 h torin 1 [400 nM]. h Quantification of FITC fluorescence quenching of Cct2-deficient cells ± torin 1 as in g. Data are normalized replicate mean ± SEM (closed circles) and fields of view (open circles; ≥10 per replicate). i Fluorescence quenching of lysosomally loaded FITC-dextran in Cct1 and Cct2-deficient MEFs + 1 h torin 1 [400 nM] after removal of the V-ATPase inhibitor bafilomycin A1 [20 nM]. Scale bars = 20 µm. j Quantification of FITC fluorescence quenching over time in cells treated as in i. Data are normalized replicate mean ± SEM (12 fields of view per replicate). k DQ BSA degradation in Cct1 and Cct2-deficient MEFs after 6 h DQ BSA uptake + torin 1 [400 nM]. Scale bars = 20 µm. l Quantification of DQ BSA fluorescence of Cct1 and Cct2-deficient cells treated as in k. Data are normalized replicate mean ± SEM (closed circles) and fields of view (open circles; ≥10 per replicate). ad n = 4, f n = 8 (Cct1 KO) or n = 10 (Cct2 KO), h n = 4, j n = 3, l n = 3 biologically independent experiments. In f, p-values were calculated using a one sample t-test with a hypothetical mean of 1. In h, l, p-values were calculated using a two-tailed unpaired t-test with Welch correction. Source data are provided as a Source data file.
Fig. 6
Fig. 6. Rapid mobilization of lysosomal proteolytic capacity in response to mTORC1 inactivation.
a Degradation of lysosomally preloaded DQ BSA in MEFs upon torin 1 treatment [400 nM]. Scale bars = 20 µm. b Quantification of DQ BSA in Lamp1-containing lysosomes of cells shown in a. Data are mean ± SD (25 fields of view). c Lysosomal degradation of magic red substrates of cathepsins B and L in MEFs after 1 h pretreatment ± torin 1 [400 nM]. Scale bars = 20 µm. d Fraction of lysosomes with high cathepsin B/L activity in cells treated as in c. Data are replicate mean ± SEM (closed circles) and fields of view (open circles; ≥10 per replicate). e Degradation of lysosomally preloaded DQ BSA in MEFs after 0–2 h torin 1 [400 nM]. Scale bars = 10 µm. f Magnification of areas highlighted in e. g Fraction of lysosomes with high DQ BSA degradation in cells treated as in e. Data are replicate mean ± SEM (closed circles) and fields of view (open circles; ≥10 per replicate). b One representative of n = 3 biologically independent experiments; d n = 4, g n = 3 biologically independent experiments. p-values were calculated using a two-tailed unpaired t-test with Welch correction. Source data are provided as a Source data file.
Fig. 7
Fig. 7. mTORC1 controls lysosomal catabolic activity by regulating V-ATPase assembly.
Model for the regulation of lysosomal catabolic activity by mTORC1. a Under amino acid-replete conditions, a large fraction of V-ATPase V1 domains is stabilized in the cytosol by association with the chaperonin TRiC. Consequently, lysosomes display an elevated pH and low catabolic activity. b Upon amino acid starvation and the ensuing decline in mTORC1 signalling, V1 domains move to lysosomes and assemble with Vo domains into active proton pumps. The resulting acidification of the lysosomal lumen increases proteolytic activity and initiates degradation of macromolecular contents throughout the organelle population.

Similar articles

Cited by

References

    1. Palm W, Thompson CB. Nutrient acquisition strategies of mammalian cells. Nature. 2017;546:234–242. doi: 10.1038/nature22379. - DOI - PMC - PubMed
    1. Stehle G, et al. Plasma protein (albumin) catabolism by the tumor itself–implications for tumor metabolism and the genesis of cachexia. Crit. Rev. Oncol./Hematol. 1997;26:77–100. doi: 10.1016/S1040-8428(97)00015-2. - DOI - PubMed
    1. Lawrence RE, Zoncu R. The lysosome as a cellular centre for signalling, metabolism and quality control. Nat. Cell Biol. 2019;21:133–142. doi: 10.1038/s41556-018-0244-7. - DOI - PubMed
    1. Maxson ME, Grinstein S. The vacuolar-type H+-ATPase at a glance - more than a proton pump. J. Cell Sci. 2014;127:4987–4993. doi: 10.1242/jcs.158550. - DOI - PubMed
    1. Forgac M. Vacuolar ATPases: rotary proton pumps in physiology and pathophysiology. Nat. Rev. Mol. Cell Biol. 2007;8:917–929. doi: 10.1038/nrm2272. - DOI - PubMed

Publication types

MeSH terms

Substances