Trends in COVID-19 hospital outcomes in England before and after vaccine introduction, a cohort study
- PMID: 35977938
- PMCID: PMC9382625
- DOI: 10.1038/s41467-022-32458-y
Trends in COVID-19 hospital outcomes in England before and after vaccine introduction, a cohort study
Abstract
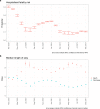
Widespread vaccination campaigns have changed the landscape for COVID-19, vastly altering symptoms and reducing morbidity and mortality. We estimate trends in mortality by month of admission and vaccination status among those hospitalised with COVID-19 in England between March 2020 to September 2021, controlling for demographic factors and hospital load. Among 259,727 hospitalised COVID-19 cases, 51,948 (20.0%) experienced mortality in hospital. Hospitalised fatality risk ranged from 40.3% (95% confidence interval 39.4-41.3%) in March 2020 to 8.1% (7.2-9.0%) in June 2021. Older individuals and those with multiple co-morbidities were more likely to die or else experienced longer stays prior to discharge. Compared to unvaccinated people, the hazard of hospitalised mortality was 0.71 (0.67-0.77) with a first vaccine dose, and 0.56 (0.52-0.61) with a second vaccine dose. Compared to hospital load at 0-20% of the busiest week, the hazard of hospitalised mortality during periods of peak load (90-100%), was 1.23 (1.12-1.34). The prognosis for people hospitalised with COVID-19 in England has varied substantially throughout the pandemic and according to case-mix, vaccination, and hospital load. Our estimates provide an indication for demands on hospital resources, and the relationship between hospital burden and outcomes.
© 2022. The Author(s).
Conflict of interest statement
The authors declare no competing interests.
Figures


Similar articles
-
Comparative analysis of the risks of hospitalisation and death associated with SARS-CoV-2 omicron (B.1.1.529) and delta (B.1.617.2) variants in England: a cohort study.Lancet. 2022 Apr 2;399(10332):1303-1312. doi: 10.1016/S0140-6736(22)00462-7. Epub 2022 Mar 16. Lancet. 2022. PMID: 35305296 Free PMC article.
-
Waning effectiveness of BNT162b2 and ChAdOx1 covid-19 vaccines over six months since second dose: OpenSAFELY cohort study using linked electronic health records.BMJ. 2022 Jul 20;378:e071249. doi: 10.1136/bmj-2022-071249. BMJ. 2022. PMID: 35858698 Free PMC article.
-
Associations of BMI with COVID-19 vaccine uptake, vaccine effectiveness, and risk of severe COVID-19 outcomes after vaccination in England: a population-based cohort study.Lancet Diabetes Endocrinol. 2022 Aug;10(8):571-580. doi: 10.1016/S2213-8587(22)00158-9. Epub 2022 Jul 1. Lancet Diabetes Endocrinol. 2022. PMID: 35780805 Free PMC article.
-
Association of COVID-19 Vaccinations With Intensive Care Unit Admissions and Outcome of Critically Ill Patients With COVID-19 Pneumonia in Lombardy, Italy.JAMA Netw Open. 2022 Oct 3;5(10):e2238871. doi: 10.1001/jamanetworkopen.2022.38871. JAMA Netw Open. 2022. PMID: 36301541 Free PMC article.
-
Incidence and mortality due to thromboembolic events during the COVID-19 pandemic: Multi-sourced population-based health records cohort study.Thromb Res. 2021 Jun;202:17-23. doi: 10.1016/j.thromres.2021.03.006. Epub 2021 Mar 8. Thromb Res. 2021. PMID: 33711754 Free PMC article.
Cited by
-
Telemedical management of symptomatic COVID-19 outpatients.ERJ Open Res. 2024 Aug 12;10(4):00277-2024. doi: 10.1183/23120541.00277-2024. eCollection 2024 Jul. ERJ Open Res. 2024. PMID: 39135664 Free PMC article.
-
The influence of sociodemographic factors on COVID-19 vaccine certificate acceptance: A cross-sectional study.Hum Vaccin Immunother. 2023 Aug 1;19(2):2220628. doi: 10.1080/21645515.2023.2220628. Hum Vaccin Immunother. 2023. PMID: 37291793 Free PMC article.
-
The Association between COVID-19 Status and Economic Costs in the Early Stages of the COVID-19 Pandemic: Evidence from a UK Symptom Surveillance Digital Survey.Pharmacoecon Open. 2025 Mar;9(2):231-245. doi: 10.1007/s41669-024-00544-0. Epub 2024 Nov 28. Pharmacoecon Open. 2025. PMID: 39609339 Free PMC article.
-
Investigation of Initial Viral Loads and Patient Characteristics as Predictors of COVID-19 Outcomes: A Retrospective Cohort Study.Infect Dis Rep. 2023 Oct 8;15(5):589-599. doi: 10.3390/idr15050057. Infect Dis Rep. 2023. PMID: 37888138 Free PMC article.
-
The Impact of Vaccination on COVID-19 Outcomes in Vietnam.Diagnostics (Basel). 2024 Dec 18;14(24):2850. doi: 10.3390/diagnostics14242850. Diagnostics (Basel). 2024. PMID: 39767211 Free PMC article.
References
-
- Kirwan, P. D. et al. Trends in risks of severe events and lengths of stay for COVID-19 hospitalisations in England over the pre-vaccination era: results from the Public Health England SARI-Watch surveillance scheme. arXiv [stat.AP]. http://arxiv.org/abs/2103.04867 (2021).
Publication types
MeSH terms
Substances
Grants and funding
LinkOut - more resources
Full Text Sources
Medical

