. 2022 Aug 17;12(1):13948.
doi: 10.1038/s41598-022-17508-1.

A network simplification approach to ease topological studies about the food-web architecture

Affiliations

A network simplification approach to ease topological studies about the food-web architecture

Andrea Gini et al. Sci Rep. .

Abstract

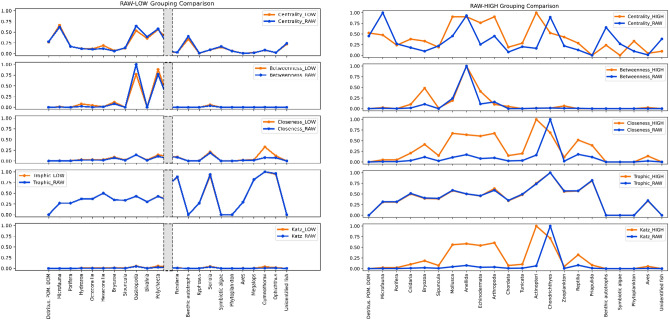
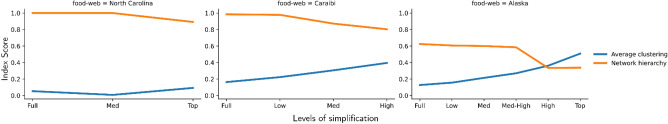
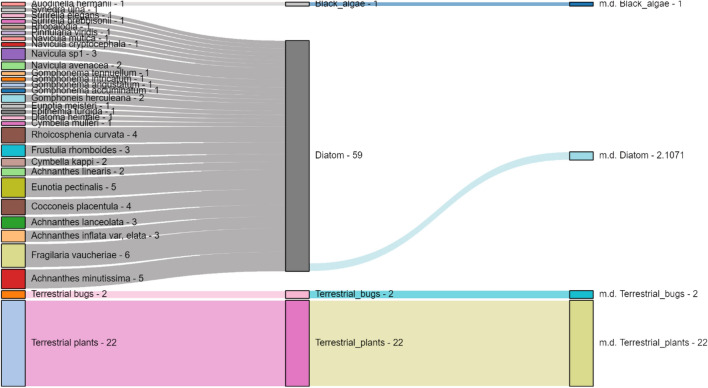
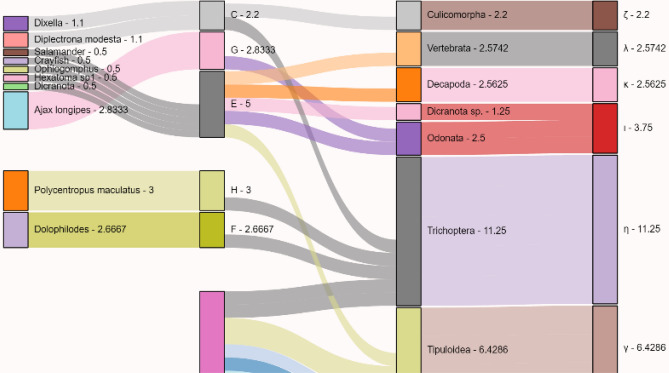
Food webs studies are intrinsically complex and time-consuming. Network data about trophic interaction across different large locations and ecosystems are scarce in comparison with general ecological data, especially if we consider terrestrial habitats. Here we present a complex network strategy to ease the gathering of the information by simplifying the collection of data with a taxonomic key. We test how well the topology of three different food webs retain their structure at the resolution of the nodes across distinct levels of simplification, and we estimate how community detection could be impacted by this strategy. The first level of simplification retains most of the general topological indices; betweenness and trophic levels seem to be consistent and robust even at the higher levels of simplification. This result suggests that generalisation and standardisation, as a good practice in food webs science, could benefit the community, both increasing the amount of open data available and the comparison among them, thus providing support especially for scientists that are new in this field and for exploratory analysis.


Conflict of interest statement

The authors declare no competing interests.

Figures

Figure 1
Figure 1
Caribbean food web's topology tendencies between raw data and low level of simplification (on the left) and high level of simplification (on the right). The left figure shows only the two extremities of the plot. For the complete visualisation (as well as the other levels of simplifications), see the Supplementary Materials. This is a categorical parallel coordinates plot, the point represents the actual data, and the lines help visualise how overimposable the values of the indices are. Blue dots and lines represent the index of choice (from top to bottom: Degree centrality, Betweenness centrality, Closeness centrality, Trophic level, Katz centrality) for the original network; orange dots and lines represent the same index for the simplified graph. In the Supplementary materials are reported all these types of visualisation for all the three food webs as vectorial .svg files.
Figure 2
Figure 2
Average clustering and hierarchy trends amongst food webs and levels of simplification. Each of the three plots shows with a common index score (0–1) how much the average clustering and the network hierarchy change for a given food web, increasing the simplification and lowering the taxonomic resolution. For example, in the Alaska food web, the “row”, “low”, and “med” levels maintain these two measures till the “med-high” level, in which further simplification degenerate the network. At the “top” level, the majority of the nodes become connected, and the two indices overlap and switch positions.
Figure 3
Figure 3
Crop of the Sankey visualisation for the flow of information about the node degree between the raw graph and the grouped network. In the first column, all the original nodes are listed with their own degree; in the middle one, the sum of their degrees identifies the belonging group in the grouped network; in the last one, we show the mean degree (m.d.) of the group based on the data of the original network. The complete visualisation, as well as the other Sankey interactive plots, can be seen in the North_Carolina_Sankey.7z archive in the Supplementary material as HTML files.
Figure 4
Figure 4
Extract of the North Carolina Sankey visualisation for trophic levels flux. The columns represent, from left to right: the Trophic Level (TL) in the original network (ON) subdivided by the number of entities belonging in a cluster; the clusters based on the same value of TL in the ON; TL computed on the simplified network (SN) subdivided by the number of entities belonging in a cluster; clusters based on the same value of TN in the SN. The values near the organisms indicate the TL of the node. The height and the number of the second and third columns are the sums of the TL in the same cluster (with a minimum value set to 1 to optimise the visualisation). For the complete interactive Html output, see the Supplementary figure S42.

References

    1. Ecological networks: Linking structure to dynamics in food webs. (Oxford University Press, 2006).
    1. Adaptive food webs: Stability and transitions of real and model ecosystems. (Cambridge University Press, 2018).
    1. Pimm SL. Food Webs. Springer; 1982.
    1. Adaptive Food Webs: Stability and Transitions of Real and Model Ecosystems. (Cambridge University Press, 2017). doi:10.1017/9781316871867.
    1. da Mata AS. Complex Networks: A Mini-review. Braz. J. Phys. 2020;50:658–672. doi: 10.1007/s13538-020-00772-9. - DOI

Publication types