. 2022 Aug 17;12(1):14003.
doi: 10.1038/s41598-022-18333-2.

Synaptic branch stability is mediated by non-enzymatic functions of MEC-17/αTAT1 and ATAT-2

Affiliations

Synaptic branch stability is mediated by non-enzymatic functions of MEC-17/αTAT1 and ATAT-2

Jean-Sébastien Teoh et al. Sci Rep. .

Abstract

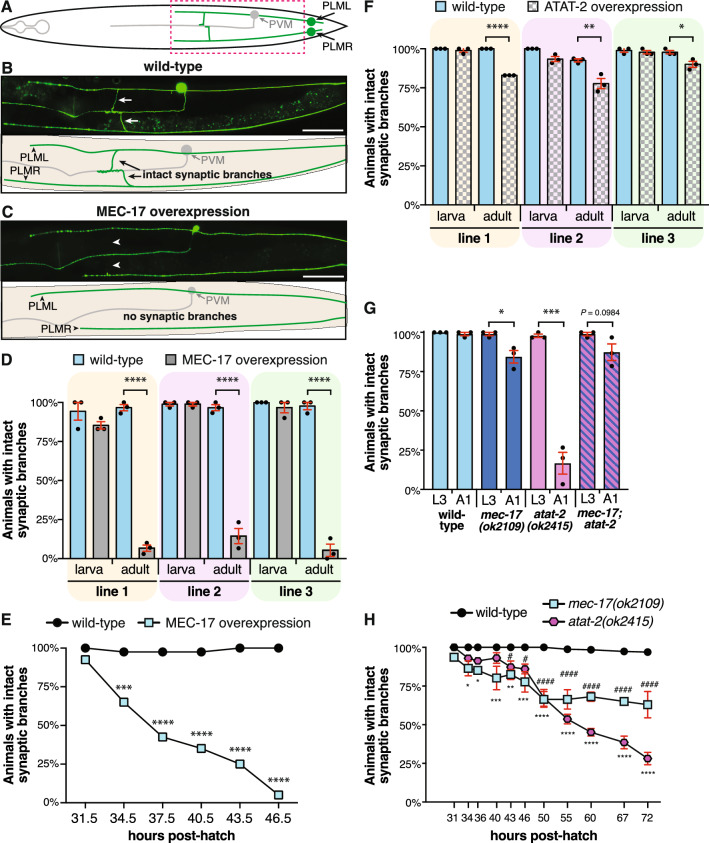
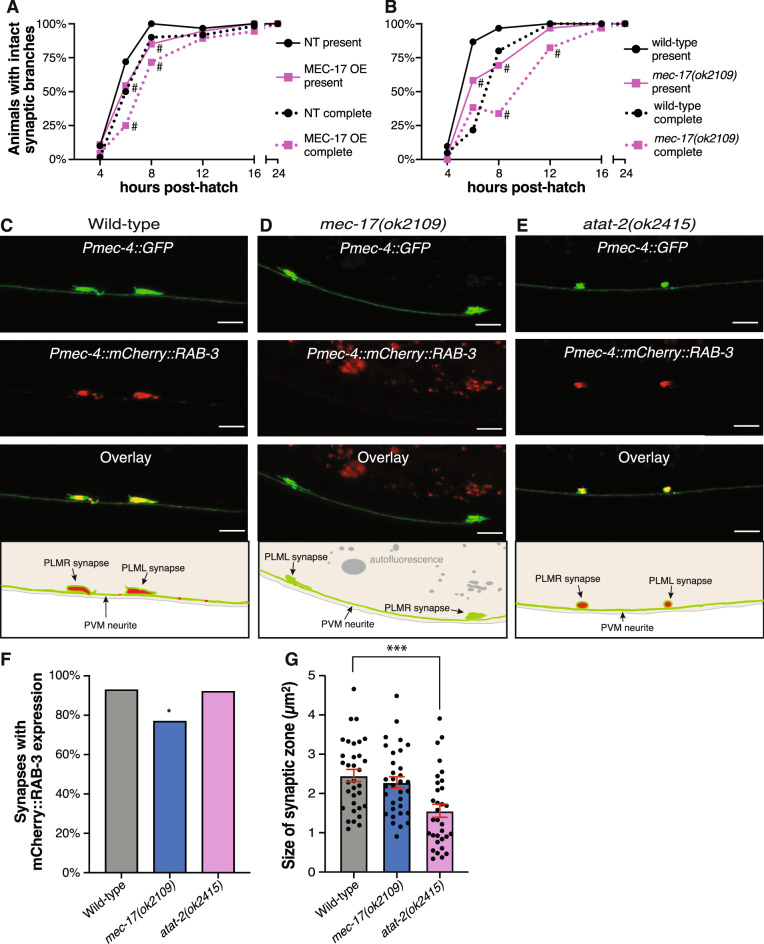
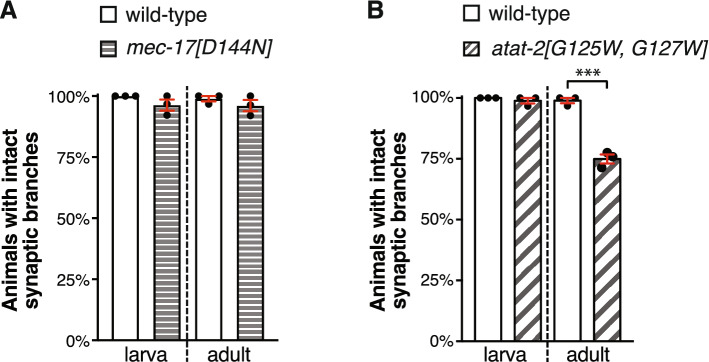
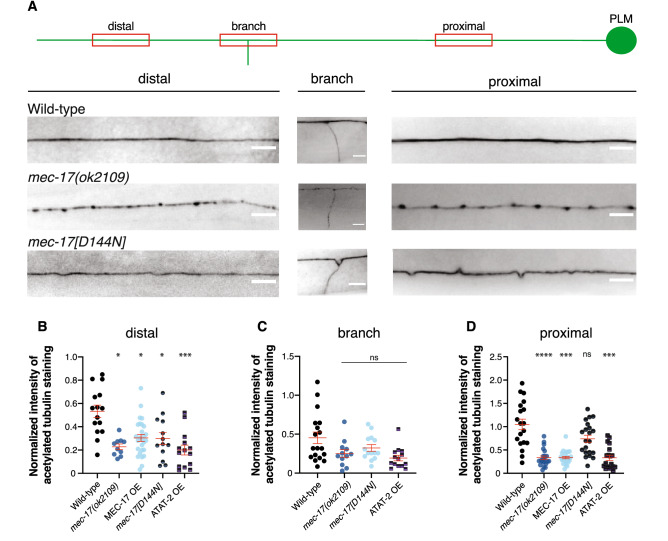
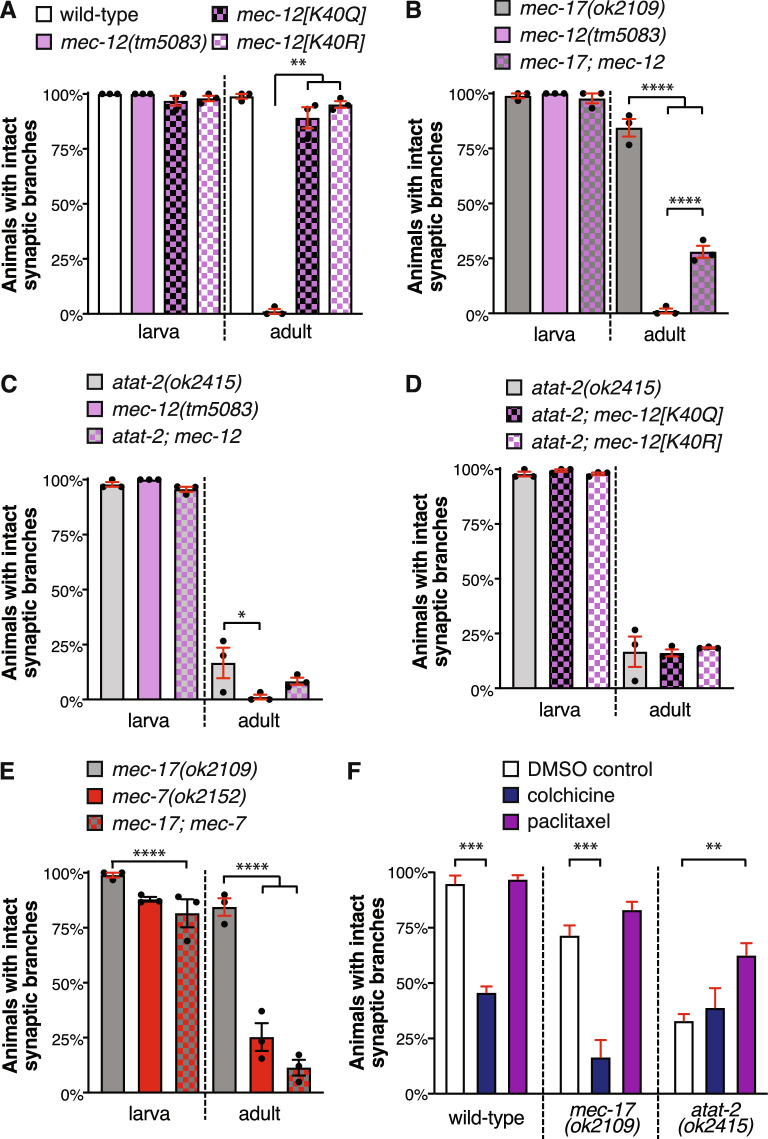
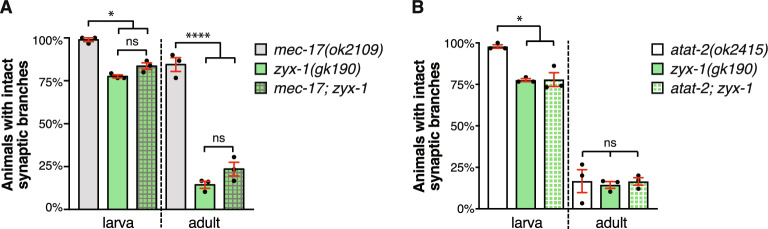
Microtubules are fundamental elements of neuronal structure and function. They are dynamic structures formed from protofilament chains of α- and β-tubulin heterodimers. Acetylation of the lysine 40 (K40) residue of α-tubulin protects microtubules from mechanical stresses by imparting structural elasticity. The enzyme responsible for this acetylation event is MEC-17/αTAT1. Despite its functional importance, however, the consequences of altered MEC-17/αTAT1 levels on neuronal structure and function are incompletely defined. Here we demonstrate that overexpression or loss of MEC-17, or of its functional paralogue ATAT-2, causes a delay in synaptic branch extension, and defective synaptogenesis in the mechanosensory neurons of Caenorhabditis elegans. Strikingly, by adulthood, the synaptic branches in these animals are lost, while the main axon shaft remains mostly intact. We show that MEC-17 and ATAT-2 regulate the stability of the synaptic branches largely independently from their acetyltransferase domains. Genetic analyses reveals novel interactions between both mec-17 and atat-2 with the focal adhesion gene zyx-1/Zyxin, which has previously been implicated in actin remodelling. Together, our results reveal new, acetylation-independent roles for MEC-17 and ATAT-2 in the development and maintenance of neuronal architecture.


Conflict of interest statement

The authors declare no competing interests.

Figures

Figure 1
Figure 1
Overexpression and loss of MEC-17 and ATAT-2 disrupts the PLM synaptic branches. (a) Schematic representation of a ventral view of the PLM (green) and PVM neurons (gray). Dashed box highlights the approximate location of the regions imaged in (b,c). (b) Image and schematic showing the intact PLM synaptic branches of a wild-type animal carrying the zdIs5(Pmec-4::GFP) transgene. Arrows point to the synaptic branches of PLM left (PLML) and PLM right (PLMR). (c) Image and schematic of an animal with overexpression of MEC-17 in which the synaptic branches of both PLML and PLMR are disrupted. Arrowheads point the expected position of the lost branches. Scale bars represent 50 µm. (d) Quantification of the number of animals with intact synaptic branches at L3 (larva) or A1 (adult) stages. Three independent transgenic strains are shown (gray bars) compared to their non-transgenic siblings (wild-type, blue bars). Bars show mean ± SE; symbols show the mean of three-independent experiments, each with n ≥ 30 (total n ≥ 90). (e) Quantification of the number of animals with an intact synaptic branch across the L4 stage of development in animals carrying the same transgene as line 3 in (d) (cjnEx036(Pmec-4::mec-17); blue squares) compared to their non-transgenic siblings (wild-type, black circles). Different groups of animals were analyzed for each time-point; n ≥ 36 for each time-point. (f) Quantification of the number of animals with an intact synaptic branch at L3 (larva) or A1 (adult) stages. Three independent transgenic strains with overexpression of ATAT-2 (gray bars) or their non-transgenic siblings (wild-type, blue bars) are shown. Bars show mean ± SE; symbols show the mean of three-independent experiments, each with n ≥ 28 (total n ≥ 89). (g) Quantification of the number of animals with intact synaptic branches in mec-17(ok2109) and atat-2(ok2415) single and double mutant backgrounds at both L3 and A1 stages. Bars show mean ± SE; symbols show the mean of three-independent experiments, each with n ≥ 29 (total n ≥ 90). (h) Quantification of the number of animals with intact synaptic branches across different time-points of development in wild-type animals compared to those lacking mec-17 or atat-2. Different groups of animals were analyzed for each time-point; n ≥ 20 for each time-point (total n ≥ 72). P values * < 0.05, ** < 0.01, *** < 0.001, **** < 0.0001 from one-way ANOVA with Tukey’s post-hoc tests (d,f), Fisher’s exact test (e) or unpaired t-tests (g).
Figure 2
Figure 2
MEC-17 overexpression and loss disrupt PLM synapse development. Quantification of the number of animals displaying a branch from the main PLM axon shaft (present) and those with a branch extending into the ventral nerve cord (complete) in (a) animals with mec-17 overexpression (OE) or (b) mec-17 mutants. Both PLML and PLMR analyzed at 4, 6, 8, 12, 16 and 24 h post-hatch (different cohorts of animals used at each time point); n ≥ 30. # indicates P < 0.05 when comparing to the non-transgenic (NT, a) or wild-type (b) calculated from Fisher’s exact tests. (c) Maximum projection confocal images of the PLM synaptic sites in wild-type animals. The top panel displays the neurons expressing Pmec-4::GFP, the middle panel shows the pre-synaptic sites labelled with mCherry::RAB-3, the third panel is an overlay with co-localization displayed yellow-orange, and the bottom panel is a schematic of the overlay. Arrowheads point to synaptic expansions/accumulations; scale bars represent 5 μm. (d,e) Representative image of a mec-17(ok2109) and atat-2(ok2415) mutant animal respectively, displayed as per panel c; scale bars represent 5 μm. (f) Number of synapses where mCherry::RAB-3 was visualized in wild-type, mec-17(ok2109) and atat-2(ok2415) animals where n ≥ 38; P values * < 0.05 from Fischer’s exact test. (g) Quantification of the pre-synaptic area labelled by Pmec-4::GFP in wild-type, mec-17(ok2109) and atat-2(ok2415) animals; bars show mean ± SE; n ≥ 30; P values *** < 0.001 from unpaired t-test.
Figure 3
Figure 3
MEC-17 and ATAT-2 function largely independently from their acetyltransferase domains in maintaining synaptic branch stability. (a) Quantification of the number of animals with intact synaptic branches in mec-17[D144N] and (b) atat-2[G125W, G127W] animals compared to wild-type. Bars show mean ± SE; symbols show the mean of 3-independent experiments, each with n ≥ 21 (total n ≥ 108). *** < 0.001 from t-test.
Figure 4
Figure 4
Quantification of α-tubulin acetylation levels. (a) Schematic depicts the PLM neuron with its proximal, branch and distal regions highlighted in red, showing the approximate locations imaged for analysis. Maximum intensity projection images show the distal, branch and proximal regions of the PLM axon in animals stained for acetylated tubulin. The panels represent the distribution of acetylated tubulin in wild-type (zdIs5), mec-17(ok2109), and mec-17[D144N] animals. Scale bar is 5 µm. (b) Quantification of normalized intensity of acetylated tubulin staining along the distal, (c) branch, and (d) proximal regions of the PLM axon in gravid adults across the different genotypes. Background intensity was measured from pixels adjacent to the neuronal process, and normalized intensity was calculated by using the formula (I(signal) – I(background))/I(background). Data is represented as a scatter dot plot with outliers removed and standard error of the mean marked by red lines. All genotypes are compared to wild-type (zdIs5). P-values * < 0.05, *** < 0.001, **** < 0.0001 obtained by comparing the mean rank of each distribution from the Kruskal–Wallis H test, followed by Dunne’s multiple comparisons test. Each genotype has n > 15 animals analyzed.
Figure 5
Figure 5
MEC-17 and ATAT-2 function independently from MEC-12/α-tubulin acetylation in maintaining synaptic branch stability. (a) The proportion of animals displaying intact synaptic branches in mec-12(tm5083), mec-12[K40Q], mec-12[K40R] mutants compared to wild-type. For each independent experiment n ≥ 27 (total n ≥ 87). (b) Quantification of animals with intact synaptic branches in mec-17(ok2109) and mec-12(tm5083) single and double mutant animals. For each independent experiment, n ≥ 29 (total n ≥ 89). (c) Quantification of animals with intact synaptic branches in atat-2(ok2415) and mec-12(tm5083) single and double mutant animals. For each independent experiment, n ≥ 23 (total n ≥ 80). (d) The percentage of intact synaptic branches in animals carrying the atat-2(ok2415) mutant alone, or in combination with the mec-12[K40Q] or mec-12[K40Q] mutations. For each independent experiment n ≥ 29 (total n ≥ 89). (e) Quantification of animals with intact synaptic branches in mec-17(ok2109) and mec-7(ok2152) single and double mutant animals. For each independent experiment, n ≥ 30 (total n ≥ 90). Bars show mean ± SE; P values * < 0.05, ** < 0.01, *** < 0.001, **** < 0.0001 from one-way ANOVA with Tukey’s post-hoc test. (f) The percentage of wild-type, mec-17(ok2109) and atat-2(ok2415) animals (transgenic) with intact synaptic branches when treated with 1% DMSO (control, white bars), 0.5 mM colchicine (dark blue bars), or 10 μM paclitaxel (purple bars). For three independent experiments n ≥ 20 (total n ≥ 62). Bars show mean ± SE; P values ** < 0.01, *** < 0.001 from one-way ANOVA with Tukey’s post-hoc test.
Figure 6
Figure 6
mec-17 and atat-2 function in the same genetic pathway as zyx-1. (a) Quantification of animals with intact synaptic branches in mec-17(ok2109) and zyx-1(gk190) single and double mutants. Bars show mean ± SE; symbols show the mean of three-independent experiments, each with n ≥ 29 (total n ≥ 88). (b) Analysis atat-2(ok2415) and zyx-1(gk190) single and double mutant animals. For each independent experiment, n ≥ 28 (total n ≥ 87). P values ns > 0.05, * < 0.05, **** < 0.0001 from one-way ANOVA with Tukey’s post-hoc test.

References

    1. Cartoni R, Bradke F, He Z. Enhancing the regeneration of neurons in the central nervous system. Oxf. Res. Encycl. Neurosci. 2019 doi: 10.1093/acrefore/9780190264086.013.217. - DOI
    1. Desai A, Mitchison TJ. Microtubule polimerzation dynamics. Annu. Rev. Cell Dev. Biol. 1997;13:83–117. doi: 10.1146/annurev.cellbio.13.1.83. - DOI - PubMed
    1. Brouhard GJ, Rice LM. Microtubule dynamics: An interplay of biochemistry and mechanics. Nat. Rev. Mol. Cell Biol. 2018;19:451–463. doi: 10.1038/s41580-018-0009-y. - DOI - PMC - PubMed
    1. Mitchison T, Kirschner M. Dynamic instability of microtubule growth. Nature. 1984;312:237–242. doi: 10.1038/312237a0. - DOI - PubMed
    1. Penazzi L, Bakota L, Brandt R. Microtubule dynamics in neuronal development, plasticity, and neurodegeneration. Int. Rev. Cell Mol. Biol. 2016;321:89–169. doi: 10.1016/bs.ircmb.2015.09.004. - DOI - PubMed

Publication types

MeSH terms