

A novel long noncoding RNA SP100-AS1 induces radioresistance of colorectal cancer via sponging miR-622 and stabilizing ATG3
- PMID: 35978049
- PMCID: PMC9883267
- DOI: 10.1038/s41418-022-01049-1
A novel long noncoding RNA SP100-AS1 induces radioresistance of colorectal cancer via sponging miR-622 and stabilizing ATG3
Abstract
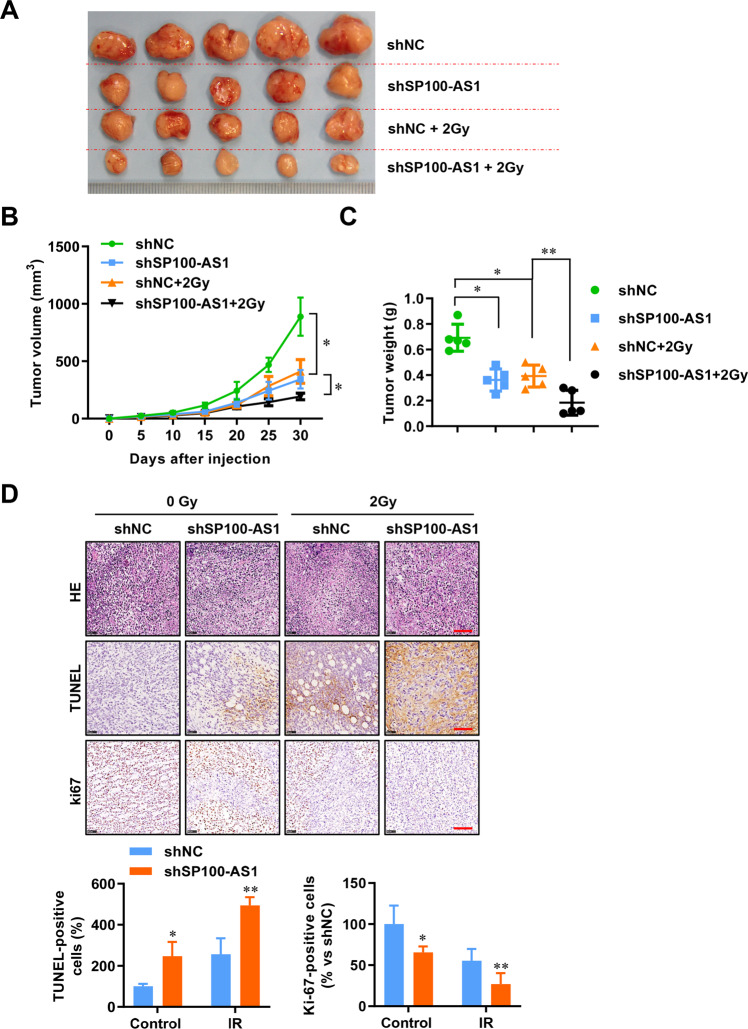
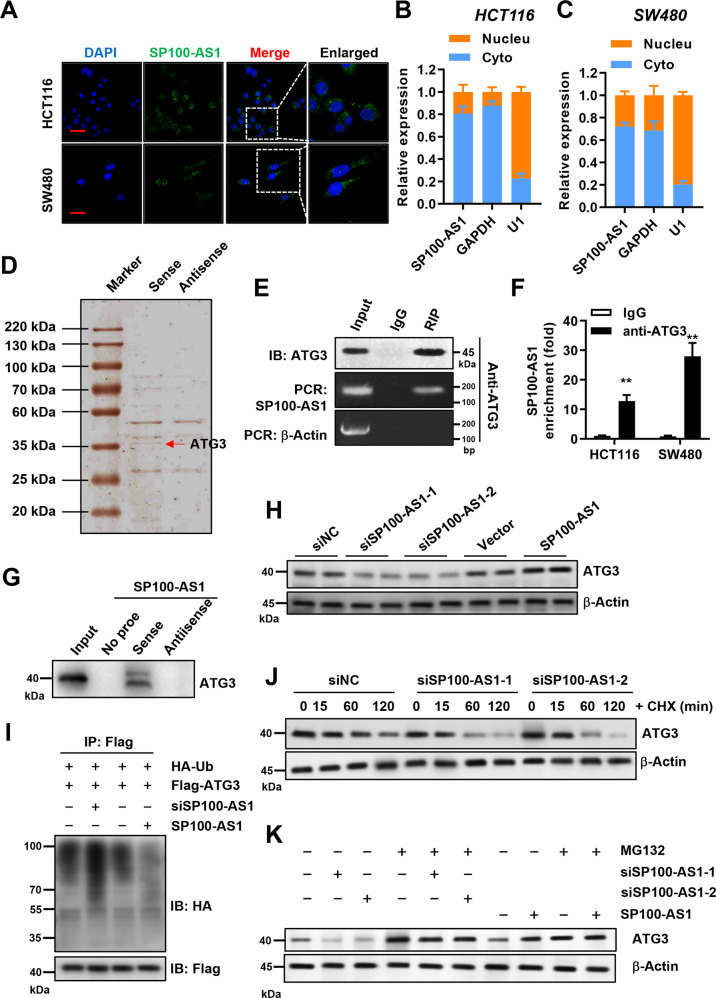
Although radiotherapy is an essential modality in the treatment of colorectal cancer (CRC), the incidence of radioresistance remains high clinically. Long noncoding RNAs (lncRNAs) reportedly play critical roles in CRC radioresistance by regulating genes or proteins at the transcriptional or post-translational levels. This study aimed to identify novel lncRNAs involved in radioresistance. We found that SP100-AS1 (lncRNA targeting antisense sequence of SP100 gene) was upregulated in radioresistant CRC patient tissues using RNA-seq analysis. Importantly, knockdown of SP100-AS1 significantly reduced radioresistance, cell proliferation, and tumor formation in vitro and in vivo. Mechanistically, mass spectrometry and bioinformatics analyses were used to identify the interacting proteins and microRNAs of SP100-AS1, respectively. Moreover, SP100-AS1 was found to interact with and stabilize ATG3 protein through the ubiquitination-dependent proteasome pathway. In addition, it could serve as a sponge for miR-622, which targeted ATG3 mRNA and affected autophagic activity. Thus, lncRNA SP100-AS1 could act as a radioresistance factor in CRC patients via RNA sponging and protein stabilizing mechanisms. In conclusion, the present study indicates that SP100-AS1/miR-622/ATG3 axis contributes to radioresistance and autophagic activity in CRC patients, suggesting it has huge prospects as a therapeutic target for improving CRC response to radiation therapy.
© 2022. The Author(s).
Conflict of interest statement
The authors declare no competing interests.
Figures


Similar articles
-
LncRNA OTUD6B-AS1 overexpression promoted GPX4-mediated ferroptosis to suppress radioresistance in colorectal cancer.Clin Transl Oncol. 2023 Nov;25(11):3217-3229. doi: 10.1007/s12094-023-03193-7. Epub 2023 May 15. Clin Transl Oncol. 2023. PMID: 37184781
-
Long noncoding RNA FGD5-AS1 promotes colorectal cancer cell proliferation, migration, and invasion through upregulating CDCA7 via sponging miR-302e.In Vitro Cell Dev Biol Anim. 2019 Sep;55(8):577-585. doi: 10.1007/s11626-019-00376-x. Epub 2019 Jul 22. In Vitro Cell Dev Biol Anim. 2019. PMID: 31332696
-
Upregulated lncRNA Cyclin-dependent kinase inhibitor 2B antisense RNA 1 induces the proliferation and migration of colorectal cancer by miR-378b/CAPRIN2 axis.Bioengineered. 2021 Dec;12(1):5476-5490. doi: 10.1080/21655979.2021.1961656. Bioengineered. 2021. PMID: 34511033 Free PMC article.
-
Radiotherapy and breast cancer: finally, an lncRNA perspective on radiosensitivity and radioresistance.Front Oncol. 2024 Sep 13;14:1437542. doi: 10.3389/fonc.2024.1437542. eCollection 2024. Front Oncol. 2024. PMID: 39346726 Free PMC article. Review.
-
MicroRNAs as Predictive Biomarkers in Patients with Colorectal Cancer Receiving Chemotherapy or Chemoradiotherapy: A Narrative Literature Review.Cancers (Basel). 2023 Feb 21;15(5):1358. doi: 10.3390/cancers15051358. Cancers (Basel). 2023. PMID: 36900159 Free PMC article. Review.
Cited by
-
Two antisense RNAs-AFAP1-AS1 and MLK7-AS1-promote colorectal cancer progression by sponging miR-149-5p and miR-485-5p.Mol Ther Nucleic Acids. 2023 Jul 15;33:305-320. doi: 10.1016/j.omtn.2023.07.004. eCollection 2023 Sep 12. Mol Ther Nucleic Acids. 2023. PMID: 37547289 Free PMC article.
-
LINC00606 promotes glioblastoma progression through sponge miR-486-3p and interaction with ATP11B.J Exp Clin Cancer Res. 2024 May 9;43(1):139. doi: 10.1186/s13046-024-03058-z. J Exp Clin Cancer Res. 2024. PMID: 38725030 Free PMC article.
-
The m6A modification mediated-lncRNA POU6F2-AS1 reprograms fatty acid metabolism and facilitates the growth of colorectal cancer via upregulation of FASN.Mol Cancer. 2024 Mar 16;23(1):55. doi: 10.1186/s12943-024-01962-8. Mol Cancer. 2024. PMID: 38491348 Free PMC article.
-
LncRNA FTX promotes colorectal cancer radioresistance through disturbing redox balance and inhibiting ferroptosis via miR-625-5p/SCL7A11 axis.World J Gastroenterol. 2025 Apr 28;31(16):104305. doi: 10.3748/wjg.v31.i16.104305. World J Gastroenterol. 2025. PMID: 40308806 Free PMC article.
-
LncRNA-Protein Interactions: A Key to Deciphering LncRNA Mechanisms.Biomolecules. 2025 Jun 17;15(6):881. doi: 10.3390/biom15060881. Biomolecules. 2025. PMID: 40563521 Free PMC article. Review.
References
Publication types
MeSH terms
Substances
LinkOut - more resources
Full Text Sources
Medical
Molecular Biology Databases
