

Relationships between intrauterine fetal growth trajectories and markers of adiposity and inflammation in young adults
- PMID: 35978103
- PMCID: PMC9492546
- DOI: 10.1038/s41366-022-01203-2
Relationships between intrauterine fetal growth trajectories and markers of adiposity and inflammation in young adults
Abstract
Background: There is now good evidence that events during gestation significantly influence the developmental well-being of an individual in later life. This study aimed to investigate the relationships between intrauterine growth trajectories determined by serial ultrasound and subsequent markers of adiposity and inflammation in the 27-year-old adult offspring from the Raine Study, an Australian longitudinal pregnancy cohort.
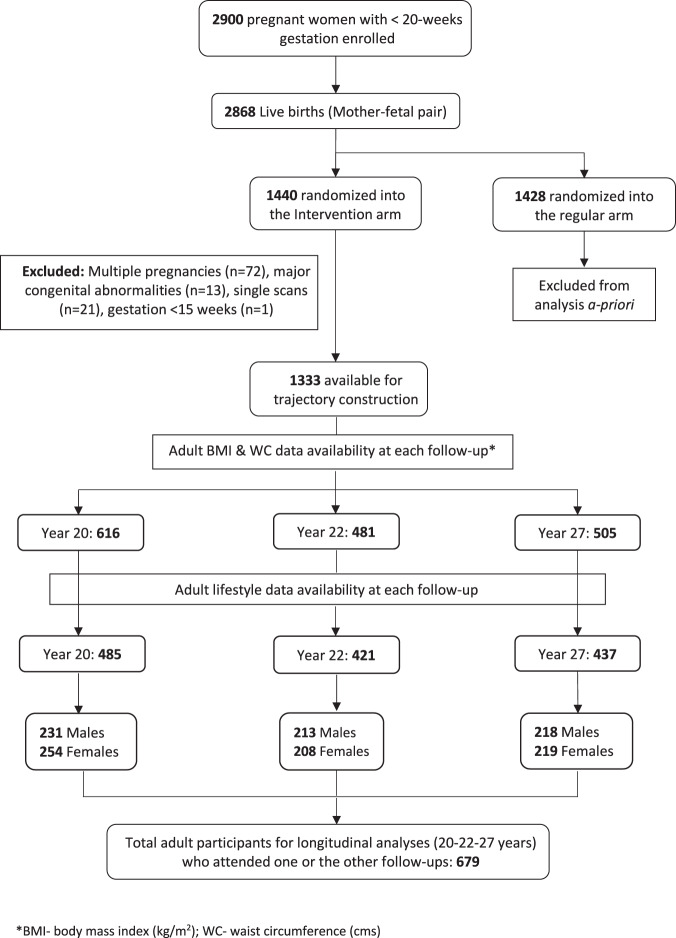
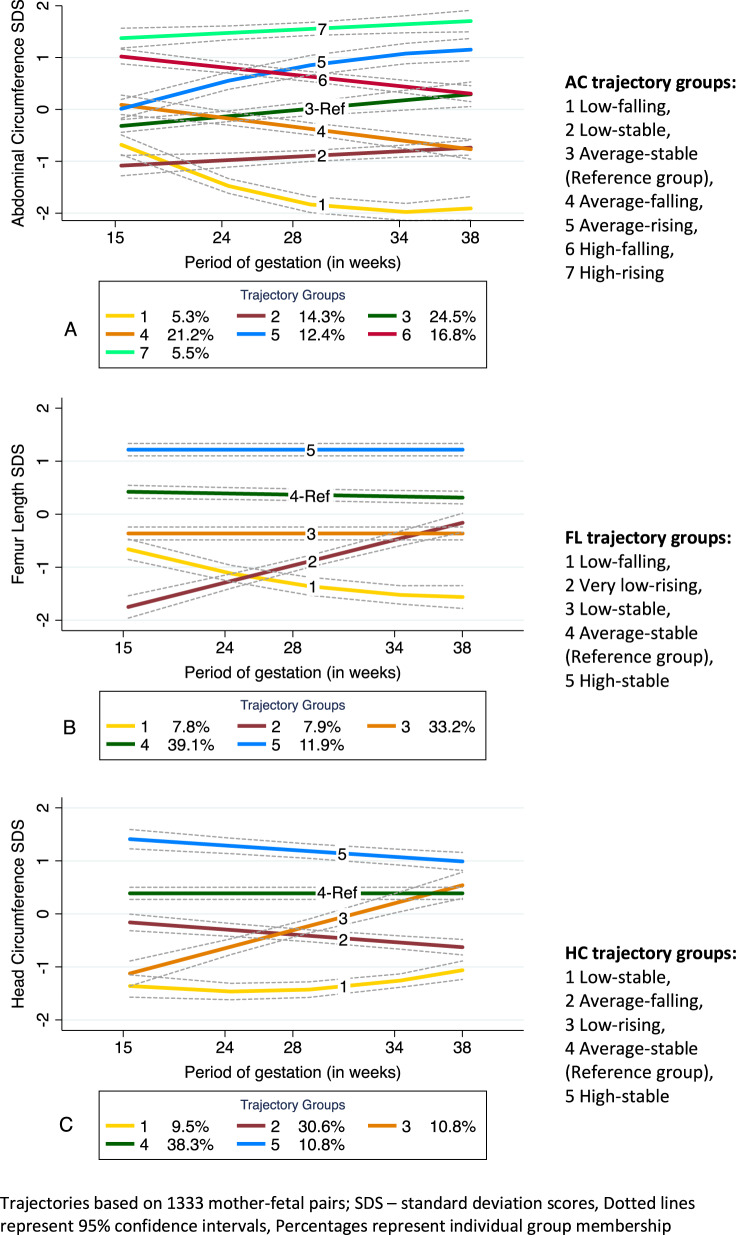
Methods: Ultrasound fetal biometric measurements including abdominal circumference (AC), femur length (FL), and head circumference (HC) from 1333 mother-fetal pairs (Gen1-Gen2) in the Raine Study were used to develop fetal growth trajectories using group-based trajectory modeling. Linear mixed modeling investigated the relationship between adult body mass index (BMI), waist circumference (WC), and high-sensitivity C-reactive protein (hs-CRP) of Gen2 at 20 (n = 485), 22 (n = 421) and 27 (n = 437) years and the fetal growth trajectory groups, adjusting for age, sex, adult lifestyle factors, and maternal factors during pregnancy.
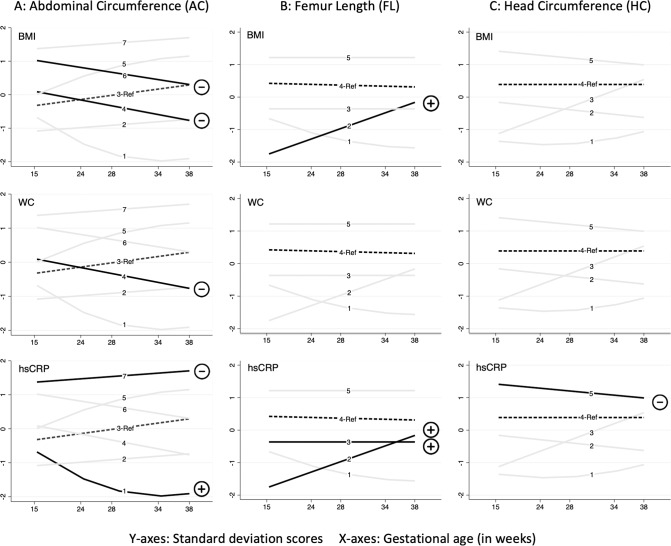
Results: Seven AC, five FL and five HC growth trajectory groups were identified. Compared to the average-stable (reference) group, a lower adult BMI was observed in two falling AC trajectories: (β = -1.45 kg/m2, 95% CI: -2.43 to -0.46, P = 0.004) and (β = -1.01 kg/m2, 95% CI: -1.96 to -0.05, P = 0.038). Conversely, higher adult BMI (2.58 kg/m2, 95% CI: 0.98 to 4.18, P = 0.002) and hs-CRP (37%, 95% CI: 9-73%, P = 0.008) were observed in a rising FL trajectory compared to the reference group. A high-stable HC trajectory associated with 20% lower adult hs-CRP (95% CI: 5-33%, P = 0.011).
Conclusion: This study highlights the importance of understanding causes of the unique patterns of intrauterine growth. Different fetal growth trajectories from early pregnancy associate with subsequent adult adiposity and inflammation, which predispose to the risk of diabetes and cardiometabolic disease.
© 2022. The Author(s).
Conflict of interest statement
The authors declare no competing interests.
Figures
Similar articles
-
Fetal Growth Trajectories and Measures of Insulin Resistance in Young Adults.J Clin Endocrinol Metab. 2023 Aug 18;108(9):e861-e870. doi: 10.1210/clinem/dgad292. J Clin Endocrinol Metab. 2023. PMID: 37246587 Free PMC article.
-
The relationship between intrauterine foetal growth trajectories and blood pressure in young adults.J Hypertens. 2022 Mar 1;40(3):478-489. doi: 10.1097/HJH.0000000000003035. J Hypertens. 2022. PMID: 34751171
-
Fetal growth trajectories of babies born large-for-gestational age in the LIFECODES Fetal Growth Study.Am J Obstet Gynecol. 2023 Mar;228(3):340.e1-340.e20. doi: 10.1016/j.ajog.2022.10.006. Epub 2022 Oct 12. Am J Obstet Gynecol. 2023. PMID: 36241081 Free PMC article.
-
Offspring body size and metabolic profile - effects of lifestyle intervention in obese pregnant women.Dan Med J. 2014 Jul;61(7):B4893. Dan Med J. 2014. PMID: 25123127 Review.
-
Developmental origins of chronic inflammation: a review of the relationship between birth weight and C-reactive protein.Ann Epidemiol. 2015 Jul;25(7):539-43. doi: 10.1016/j.annepidem.2015.01.003. Epub 2015 Jan 26. Ann Epidemiol. 2015. PMID: 25726300 Review.
Cited by
-
Fetal Growth Trajectories and Measures of Insulin Resistance in Young Adults.J Clin Endocrinol Metab. 2023 Aug 18;108(9):e861-e870. doi: 10.1210/clinem/dgad292. J Clin Endocrinol Metab. 2023. PMID: 37246587 Free PMC article.
-
Trajectories of plant-based dietary patterns and their sex-specific associations with cardiometabolic health among young Australian adults.Int J Behav Nutr Phys Act. 2025 May 27;22(1):62. doi: 10.1186/s12966-025-01765-0. Int J Behav Nutr Phys Act. 2025. PMID: 40426187 Free PMC article.
-
Association of fetal growth trajectory with mitochondrial DNA copy number in the cord blood of newborns: evidence from a birth cohort.Front Pediatr. 2025 Jun 9;13:1569702. doi: 10.3389/fped.2025.1569702. eCollection 2025. Front Pediatr. 2025. PMID: 40551778 Free PMC article.
-
The value of fetal growth trajectory during pregnancy in predicting small for gestational age neonates at term.BMC Pregnancy Childbirth. 2025 Apr 10;25(1):423. doi: 10.1186/s12884-025-07518-y. BMC Pregnancy Childbirth. 2025. PMID: 40211115 Free PMC article.
-
Maternal iron nutrition during pregnancy and fetal intrauterine growth.Nutr J. 2024 Nov 9;23(1):140. doi: 10.1186/s12937-024-01042-z. Nutr J. 2024. PMID: 39521990 Free PMC article.
References
-
- World Health Organisation. Obesity and overweight. Geneva: WHO; 2021. https://www.who.int/news-room/fact-sheets/detail/obesity-and-overweight.
-
- European Health Interview Survey. Overweight and obesity - BMI statistics. European Commission Implementing Regulation (EU) No. 255/2018; 2021. https://ec.europa.eu/eurostat/statistics-explained/index.php?title=Overw....
-
- Fryar CD, Carroll MD, Afful J. Prevalence of overweight, obesity, and severe obesity among adults aged 20 and over: United States, 1960–1962 through 2017–2018. USA: NCHS Health E-Stats; 2020.
-
- Australian Institute of Health and Welfare. Overweight and obesity: an interactive insight. Canberra: AIHW; 2020. https://www.aihw.gov.au/reports/overweight-obesity/overweight-and-obesit....
Publication types
MeSH terms
Substances
LinkOut - more resources
Full Text Sources
Research Materials
Miscellaneous
