. 2022 Sep;609(7925):151-158.
doi: 10.1038/s41586-022-05067-4. Epub 2022 Aug 17.

Post-translational control of beige fat biogenesis by PRDM16 stabilization

Affiliations

Post-translational control of beige fat biogenesis by PRDM16 stabilization

Qiang Wang et al. Nature. 2022 Sep.

Abstract

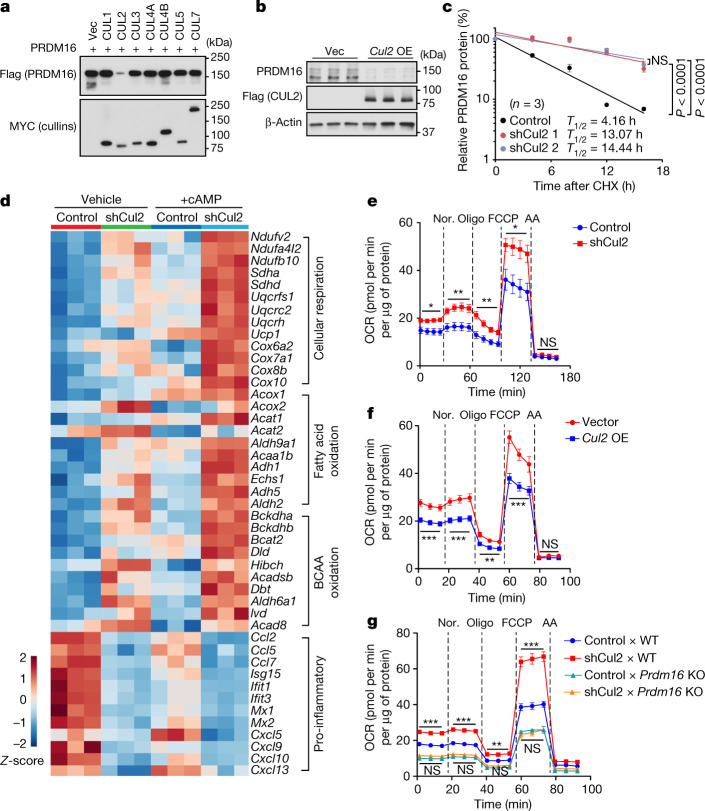
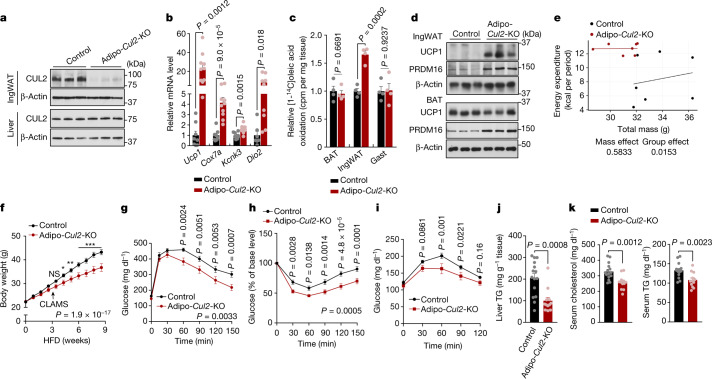
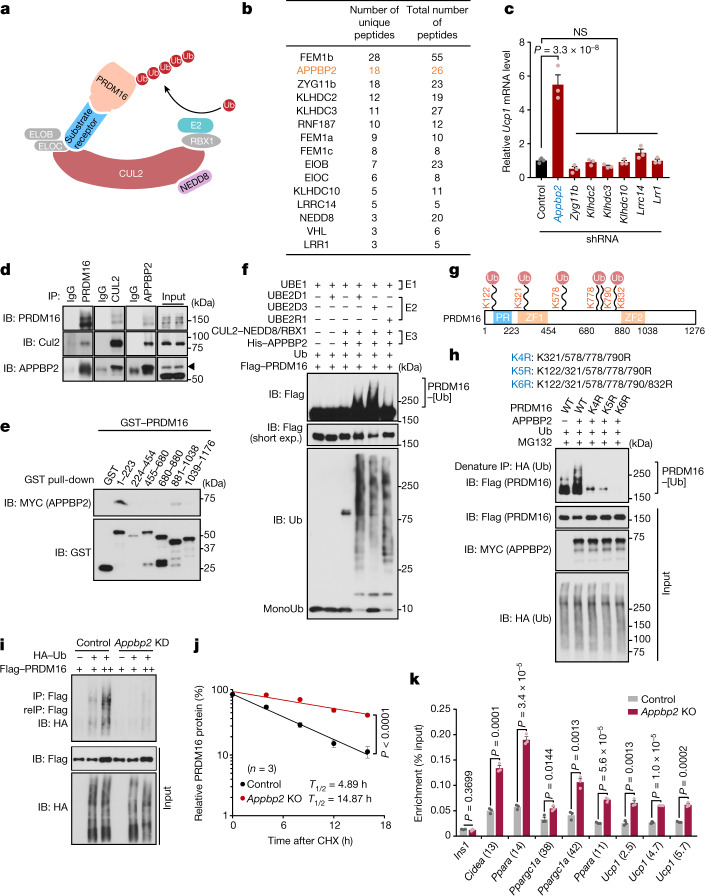
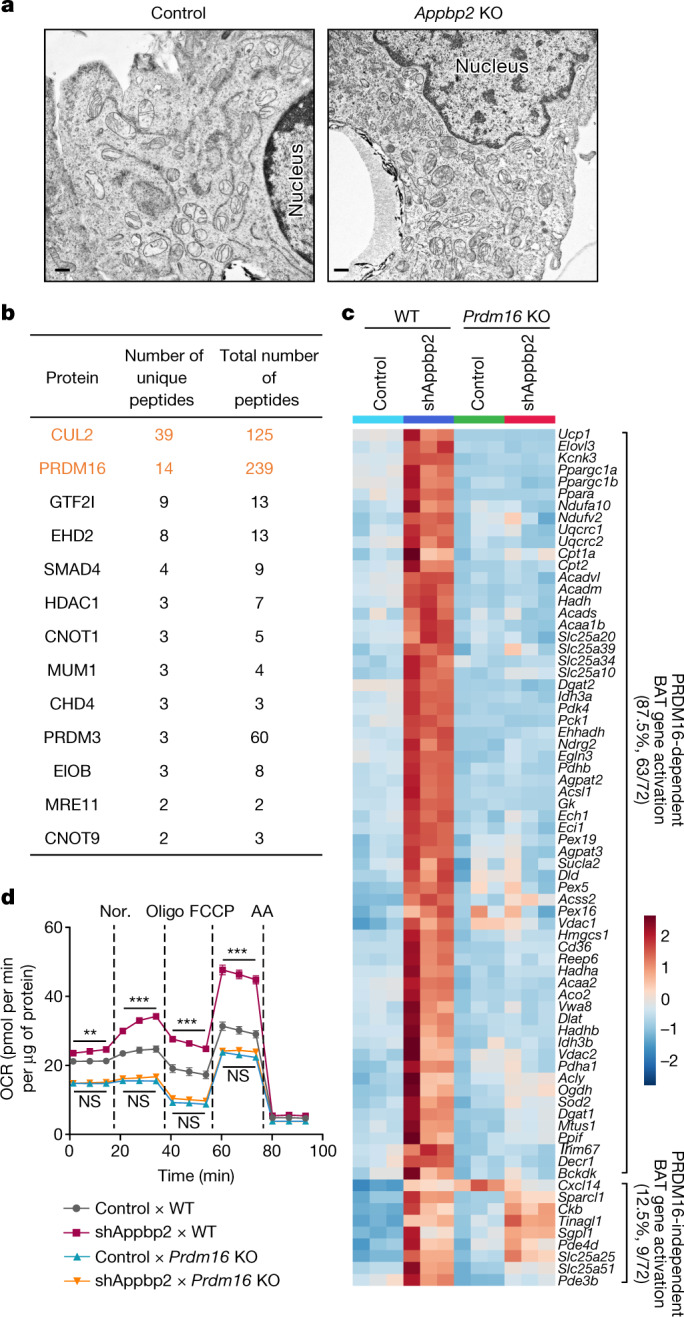
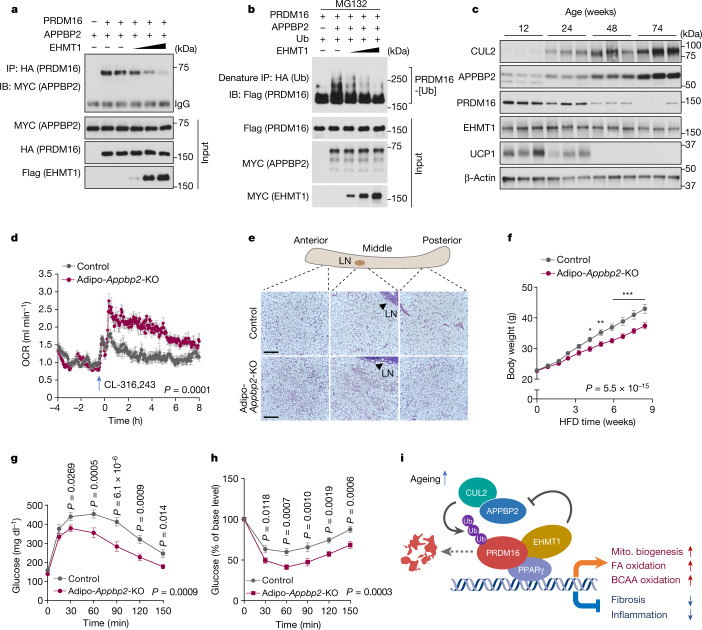
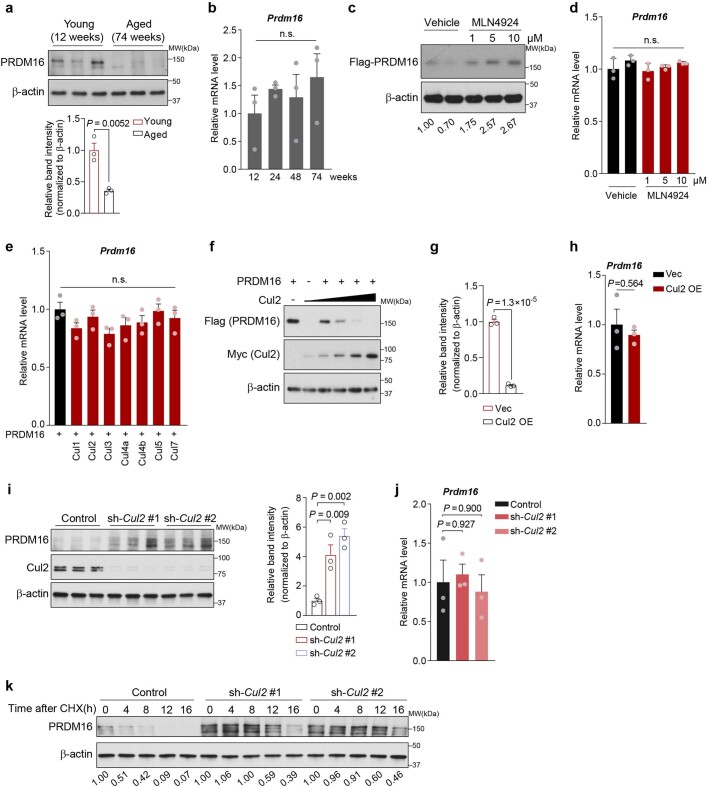
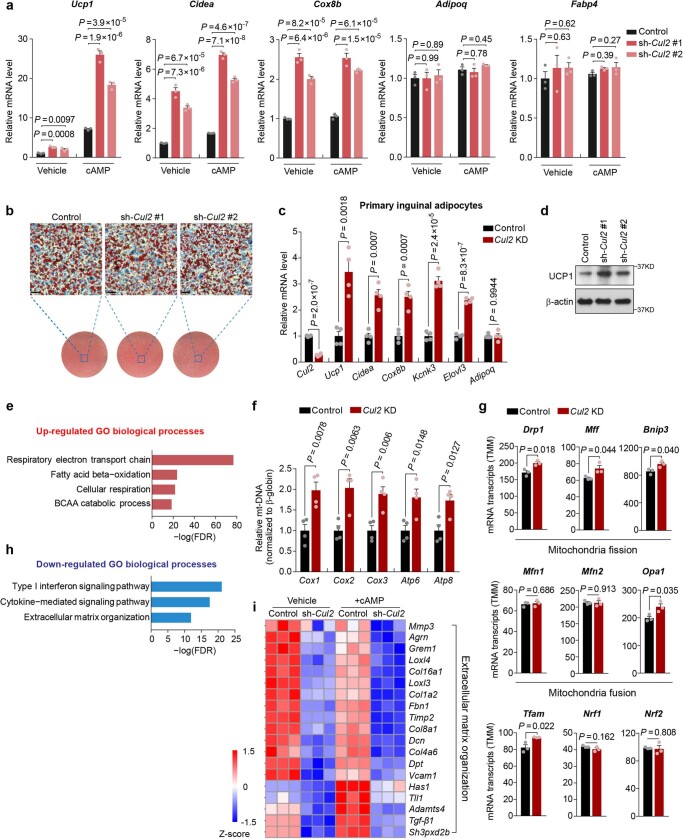
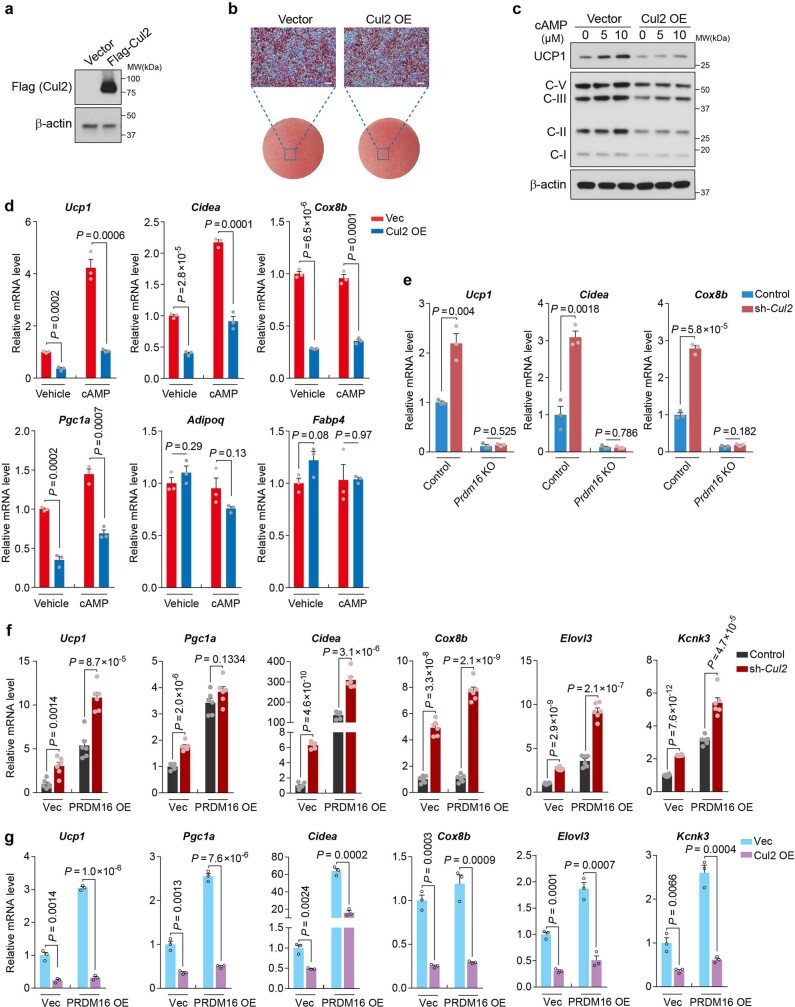
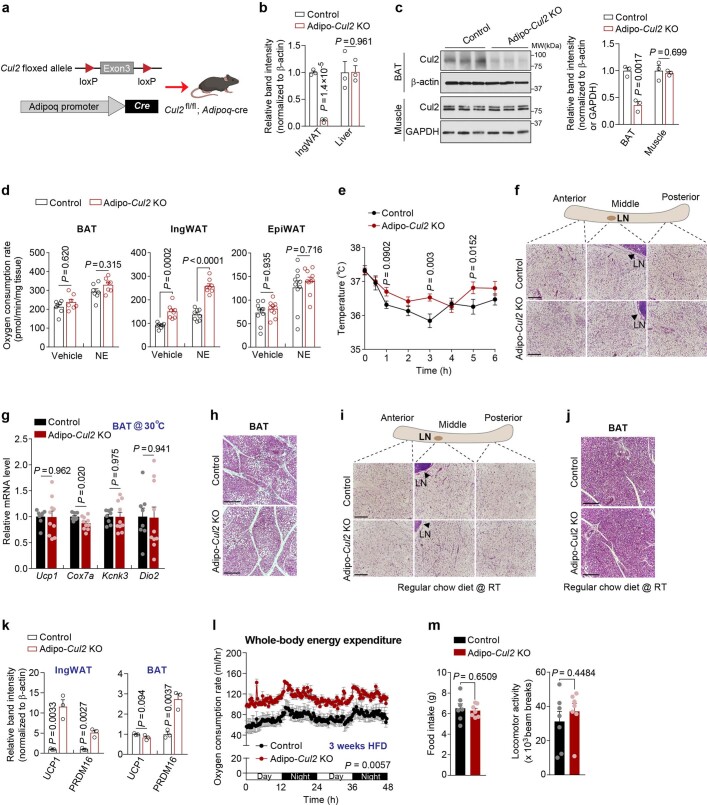
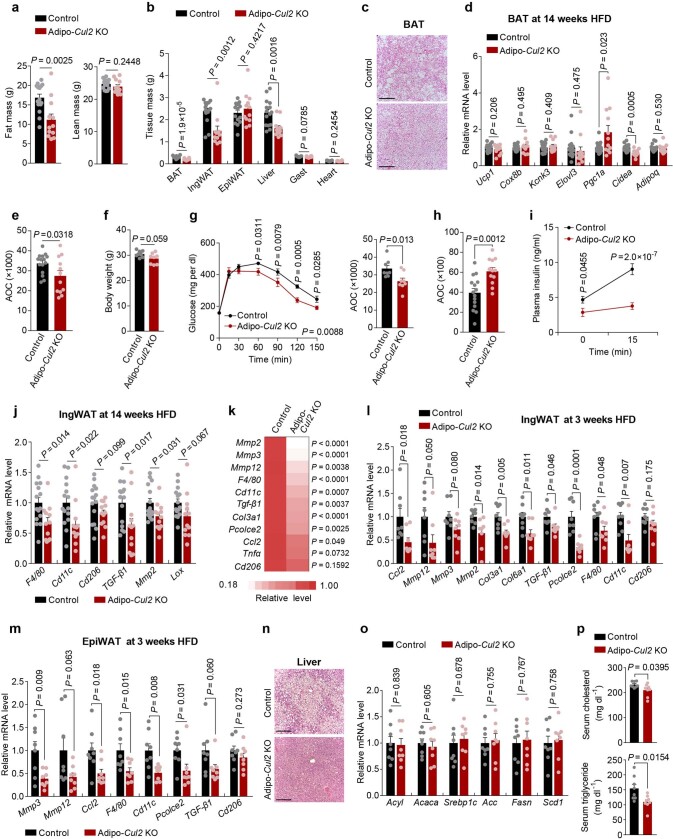
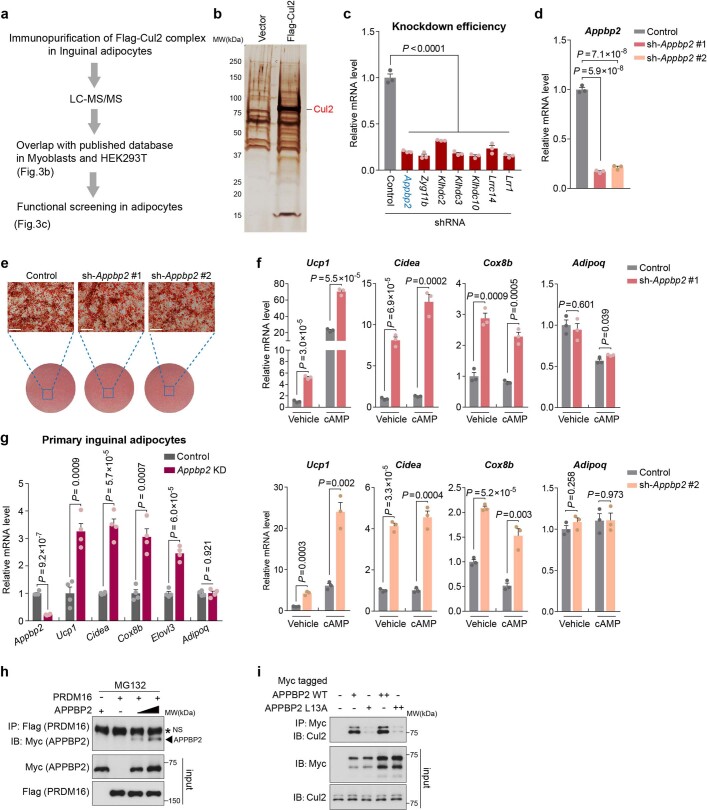
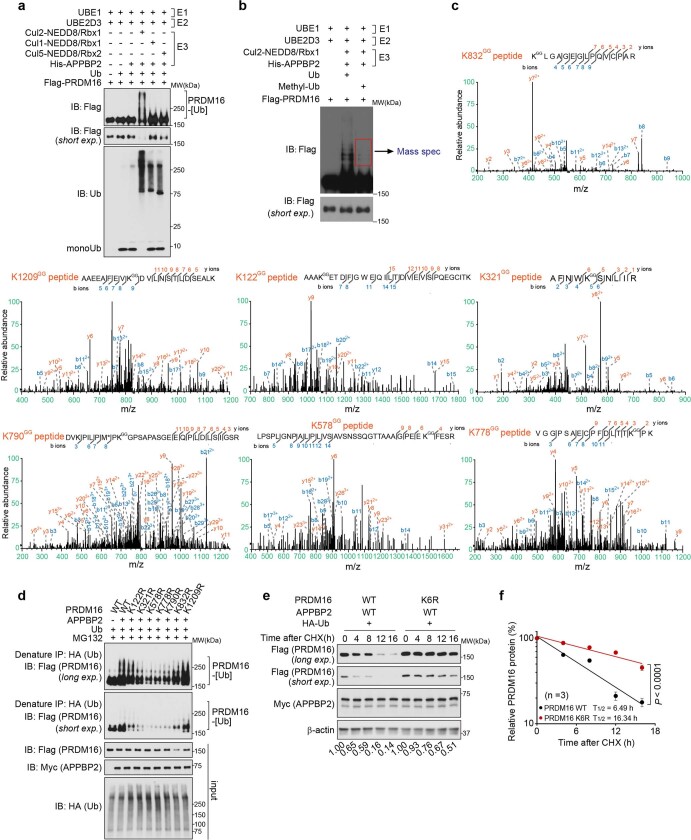
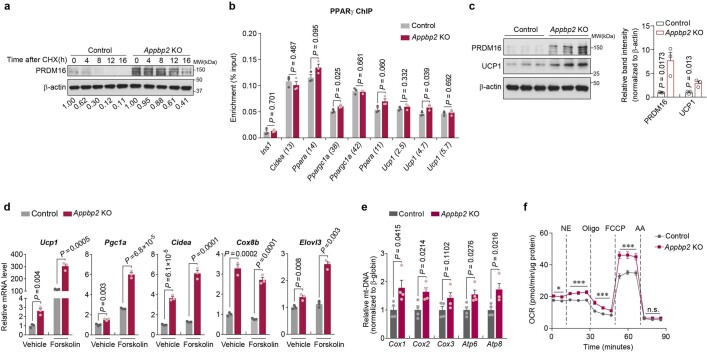
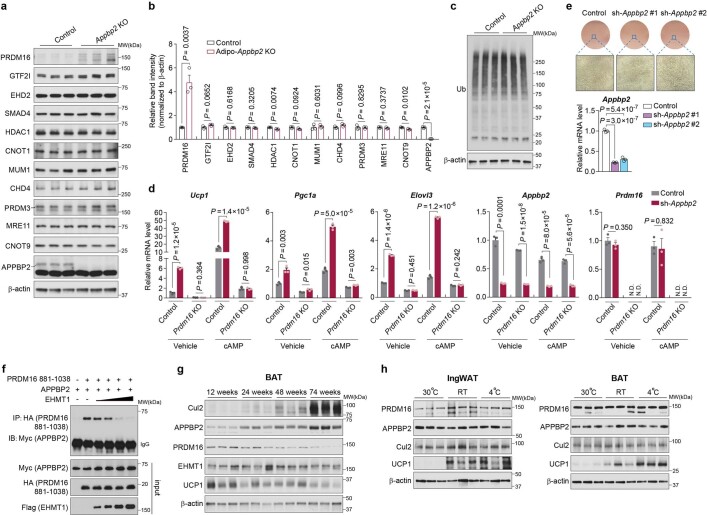
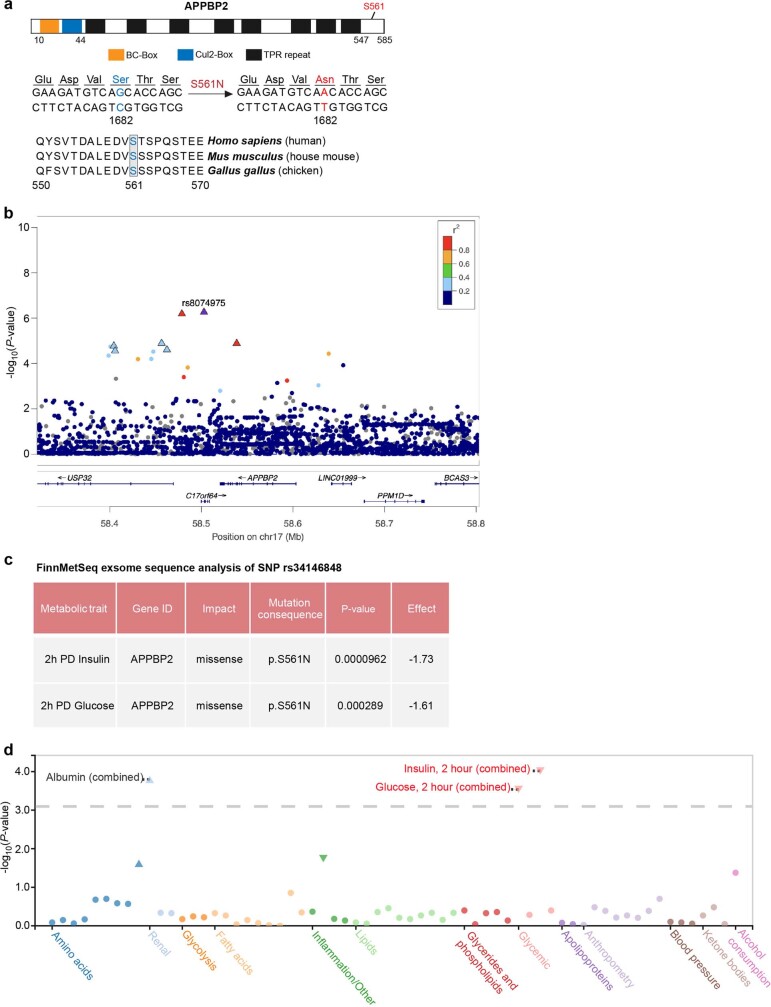
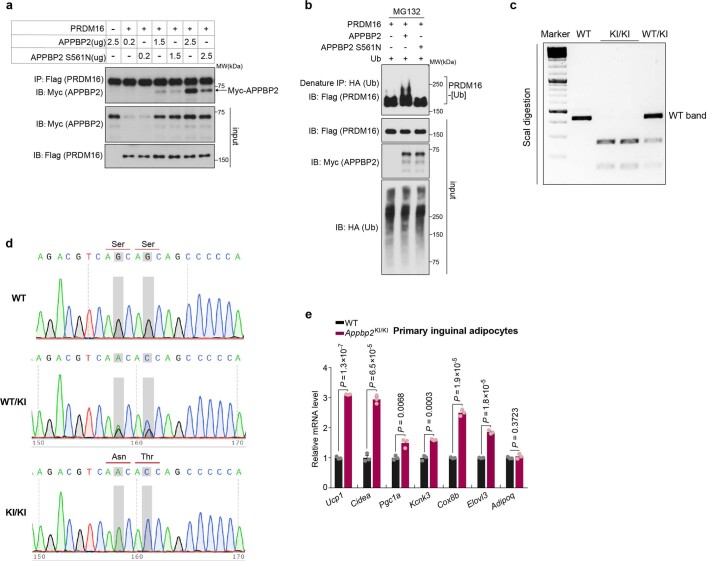
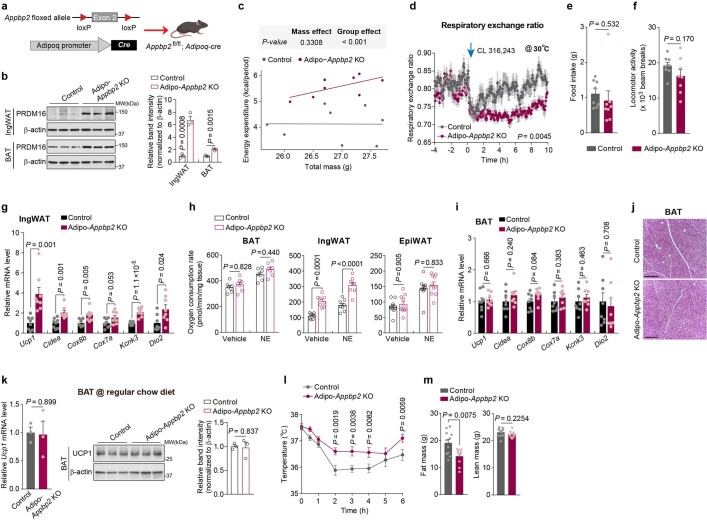
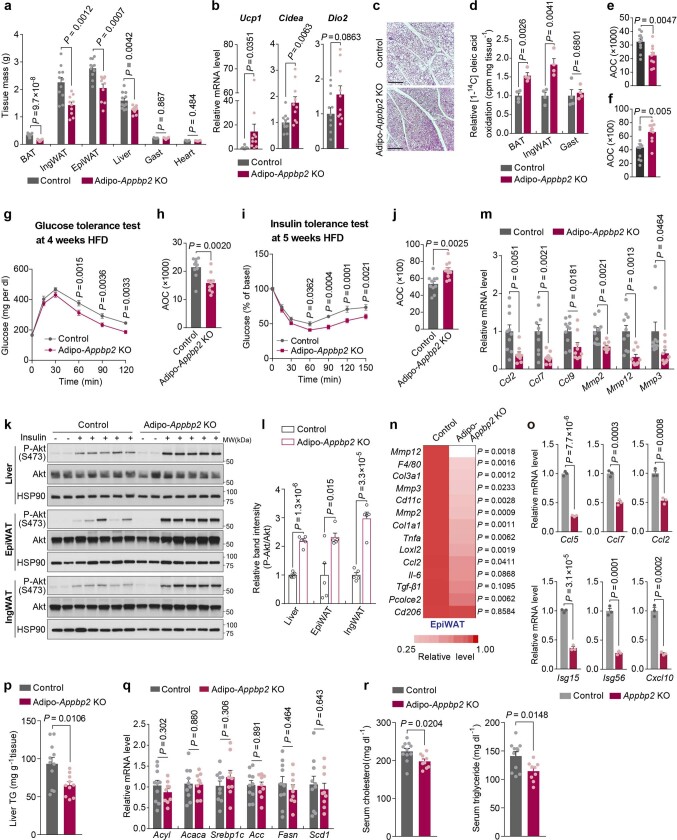
Compelling evidence shows that brown and beige adipose tissue are protective against metabolic diseases1,2. PR domain-containing 16 (PRDM16) is a dominant activator of the biogenesis of beige adipocytes by forming a complex with transcriptional and epigenetic factors and is therefore an attractive target for improving metabolic health3-8. However, a lack of knowledge surrounding the regulation of PRDM16 protein expression hampered us from selectively targeting this transcriptional pathway. Here we identify CUL2-APPBP2 as the ubiquitin E3 ligase that determines PRDM16 protein stability by catalysing its polyubiquitination. Inhibition of CUL2-APPBP2 sufficiently extended the half-life of PRDM16 protein and promoted beige adipocyte biogenesis. By contrast, elevated CUL2-APPBP2 expression was found in aged adipose tissues and repressed adipocyte thermogenesis by degrading PRDM16 protein. Importantly, extended PRDM16 protein stability by adipocyte-specific deletion of CUL2-APPBP2 counteracted diet-induced obesity, glucose intolerance, insulin resistance and dyslipidaemia in mice. These results offer a cell-autonomous route to selectively activate the PRDM16 pathway in adipose tissues.


Conflict of interest statement

The authors declare no competing interests.

Figures

Fig. 1
Fig. 1. CUL2 controls PRDM16 protein stability and beige fat biogenesis.
a, Immunoblotting of Flag-tagged PRDM16 protein in HEK293T cells co-expressing Myc-tagged cullin proteins or an empty vector (Vec). b, Immunoblotting of endogenous PRDM16 protein in inguinal adipocytes overexpressing (OE) Flag-tagged CUL2 or Vec. β-Actin was used as the loading control. c, Changes in endogenous PRDM16 stability in inguinal adipocytes expressing a scrambled control shRNA (control) or shRNAs targeting Cul2 (1 and 2). Immunoblotting data are provided in Extended Data Fig. 1k. n = 3 per group. CHX, cycloheximide. d, Heat map of the RNA-seq transcriptome in differentiated inguinal adipocytes expressing a scrambled control (control) or shRNA targeting Cul2 in the presence or absence of forskolin (+cAMP). n = 3 per group. All of the listed genes are significantly different (false-discovery rate (FDR) < 0.05) by edgeR. e, The OCR in differentiated inguinal adipocytes expressing a scrambled control shRNA or shCul2. OCR values were normalized by total protein (μg). n = 7 (control) and n = 6 (Cul2 knockdown). AA, antimycin A; Nor., noradrenaline. f, The OCR in inguinal adipocytes expressing an empty vector or Cul2 normalized by total protein (μg). n = 9 for both groups. g, The OCR in inguinal adipocytes expressing a scrambled control shRNA or shCul2 from WT and Prdm16-KO mice. n = 8 (control × WT), n = 7 (shCul2 × WT), n = 9 (control × Prdm16 KO) and n = 9 (shCul2 × Prdm16 KO). For a and b, representative results are shown from two independent experiments. Gel source data are presented in Supplementary Fig. 1. For bg, data are from biologically independent samples. For c and eg, data are mean ± s.e.m. Two-sided P values were calculated using two-way analysis of variance (ANOVA) (c) or two-way repeated-measures ANOVA (e and f) followed by Tukey test (g). *P < 0.05, **P < 0.01, ***P < 0.001; NS, not significant. Exact P values are shown in Supplementary Table 2. Source data
Fig. 2
Fig. 2. Fat-specific loss of Cul2 counteracts diet-induced obesity, insulin resistance and dyslipidaemia.
a, Immunoblot analysis of CUL2 protein in the inguinal WAT (IngWAT) and liver of Adipo-Cul2-KO and littermate control mice. n = 3 per group. b, Relative mRNA levels of the indicated genes in the inguinal WAT of Adipo-Cul2-KO mice (n = 10) and littermate controls (n = 8) on a regular chow diet at 30 °C. c, Oleic acid oxidation normalized to tissue mass (mg) in the interscapular BAT, inguinal WAT and gastrocnemius (Gast) muscle of mice on a regular chow diet. n = 4 per group. cpm, counts per minute. d, Immunoblot analysis of UCP1 and PRDM16 in the inguinal WAT and BAT of mice on an HFD. n = 3 per group. e, Regression-based analysis of energy expenditure against body mass. n = 7 per group. Data were analysed using CaIR-ANCOVA with energy expenditure as a dependent variable and body mass as a covariate. P values are shown at the bottom. f, Body weight of Adipo-Cul2-KO mice (n = 12) and littermate controls (n = 15) on an HFD at 22 °C. CLAMS, comprehensive laboratory animal monitoring system. g, Glucose-tolerance test of mice at 9 weeks of HFD. h, Insulin-tolerance test of mice at 10 weeks of HFD. i, Pyruvate-tolerance test of mice at 11 weeks of HFD. j, Triglyceride (TG) content in the liver of mice at 14 weeks of HFD. k, Serum cholesterol and triglyceride levels of the mice in j. For a and d, representative results from two independent experiments are shown. Gel source data are presented in Supplementary Fig. 1. For ak, data are from biologically independent samples. For b, c and fk, data are mean ± s.e.m. Two-sided P values were calculated using unpaired Student’s t-tests (b, c, j and k) or two-way repeated-measures ANOVA (fh) followed by Fisher’s least significant difference test (fi). *P < 0.05, **P < 0.01, ***P < 0.001. Exact P values are shown in Supplementary Table 2. Source data
Fig. 3
Fig. 3. APPBP2 is the substrate receptor in the CUL2 complex that catalyses the polyubiquitination of PRDM16.
a, A model of PRDM16 protein polyubiquitination by the CUL2–RING E3 ligase complex. b, Candidates of the substrate receptor in the CUL2 complex in adipocytes, HEK293T cells and myoblasts. APPBP2 is highlighted in orange. c, Relative mRNA levels of Ucp1 in differentiated inguinal adipocytes expressing a scrambled control shRNA (control) or shRNAs targeting substrate receptor candidates. Appbp2 is highlighted in blue. d, Endogenous protein interaction between PRDM16, CUL2 and APPBP2 in differentiated inguinal adipocytes treated with MG132. Inputs are shown on the right. IB, immunoblot; IP, immunoprecipitation. e, In vitro binding assay of purified GST-tagged PRDM16 fragments and Myc-tagged APPBP2. f, In vitro polyubiquitination of purified PRDM16 protein. g, Ubiquitination sites in PRDM16 protein. Immunoblotting data and MS data are provided in Extended Data Fig. 7b,c. h, PRDM16 polyubiquitination in HEK293T cells expressing the WT and the indicated mutant forms of PRDM16 in the presence of MG132. i, Changes in PRDM16 polyubiquitination in HEK293T cells expressing a scrambled control (control) or shRNA targeting Appbp2 (Appbp2 KD) in the presence of MG132. reIP, reimmunoprecipitation. j, Changes in endogenous PRDM16 protein stability in control and Appbp2-KO inguinal adipocytes. Immunoblotting data are provided in Extended Data Fig. 8a. k, ChIP–quantitative PCR (ChIP–qPCR) analysis of PRDM16 recruitment onto the target loci of PRDM16 in control and Appbp2-KO inguinal adipocytes. Ins1 was used as a non-specific binding site. For df, h, i, representative results are shown from two independent experiments. Gel source data are presented in Supplementary Fig. 1. For c, j and k, n = 3 biologically independent samples per group. For c, j and k, data are mean ± s.e.m. Two-sided P values were calculated using one-way ANOVA followed by Dunnett’s test (c), two-way ANOVA (j) or unpaired Student’s t-tests (k). Source data
Fig. 4
Fig. 4. APPBP2 loss promotes beige adipocyte biogenesis through PRDM16.
a, Cellular morphology of control and Appbp2-KO adipocytes by electron microscopy. Scale bar, 500 nm. Representative images from two biologically independent samples per group. b, Substrate candidates of APPBP2 in adipocytes. Cul2 and PRDM16 are highlighted in orange. c, Heat map of the RNA-seq transcriptome in WT or Prdm16-KO adipocytes expressing a scrambled control (control) or shRNA targeting Appbp2 (shAppbp2) in the presence or absence of forskolin. n = 3 biologically independent samples per group. All of the listed genes are significantly different (FDR < 0.05) on the basis of analysis using edgeR. d, The OCR in inguinal adipocytes from WT and Prdm16-KO mice. n = 8 (control × WT), n = 10 (shAppbp2 × WT), n = 9 (control × Prdm16 KO), n = 9 (shAppbp2 × Prdm16 KO) biologically independent samples. Data are mean ± s.e.m. Two-sided P values were calculated using two-way repeated-measures ANOVA followed by Tukey test. **P < 0.01, ***P < 0.001. Source data
Fig. 5
Fig. 5. APPBP2 controls whole-body energy metabolism.
a, Changes in the PRDM16–APPBP2 interaction in the presence of EHMT1. b, Changes in PRDM16 polyubiquitination in the presence of EHMT1. c, Immunoblot analysis of the indicated proteins in the inguinal WAT of mice aged 12, 24, 48 and 74 weeks. β-Actin was used as the loading control. n = 3 per group. d, The whole-body OCR of Adipo-Appbp2-KO and littermate control mice on a regular chow diet at 30 °C in response to treatment with CL-316,243. n = 8 for both groups. e, H&E staining of the inguinal WAT (anterior, middle and posterior regions) in Adipo-Appbp2-KO and control mice in d. Scale bars, 210 μm. Representative images from two biologically independent samples per group. LN, lymph node. f, The body weight of mice on an HFD. n = 10 (Adipo-Appbp2-KO) and n = 11 (control). g, Glucose-tolerance test of mice at 9 weeks of feeding on an HFD. h, Insulin-tolerance test of mice at 10 weeks of feeding on an HFD. i, A model of how CUL2–APPBP2 controls PRDM16 protein stability and beige fat biogenesis. The CUL2–APPBP2 E3 ligase complex catalyses polyubiquitination of PRDM16. Inhibition of CUL2–APPBP2 potently extends the protein half-life of PRDM16, leading to the activation of brown/beige fat genes as well as the repression of pro-inflammatory and pro-fibrosis genes in adipocytes. CUL2–APPBP2 expression in adipose tissues increases with age, showing an inverse correlation with the age-associated decline in PRDM16 protein. EHMT1 stabilizes PRDM16 protein by blocking the PRDM16–APPBP2 interaction. Mito., mitochondrial. For ac, representative results are shown from two independent experiments. Gel source data are presented in Supplementary Fig. 1. For c, d and fh, data are from biologically independent samples. For d, f, g and h, data are mean ± s.e.m. Two-sided P values were calculated using two-way repeated-measures ANOVA (d and fh) followed by Fisher’s least significant difference test (fh). *P < 0.05, **P < 0.01, ***P < 0.001. Exact P values are shown in Supplementary Table 2. Source data
Extended Data Fig. 1
Extended Data Fig. 1. Regulation of PRDM16 protein and mRNA levels.
a, Immunoblotting of indicated proteins in the inguinal WAT of mice at 12 and 74 weeks old. Lower panel: Quantification of PRDM16 protein levels and normalized to β-actin levels. b, Relative mRNA levels of Prdm16 in the inguinal WAT of mice at indicated age. c, d, Immunoblotting of indicated proteins (c) and relative mRNA levels of Prdm16 (d) in inguinal adipocytes expressing Flag-tagged PRDM16 in the presence or absence of MLN4924. e, Relative mRNA levels of Prdm16 in HEK293T cells expressing indicated constructs. f, Immunoblotting of Flag-tagged PRDM16 protein in HEK293T cells expressing indicated constructs. g, Quantification of PRDM16 protein levels in Fig. 1b by Image J software and normalized to β-actin levels. h, Relative mRNA levels of Prdm16 in inguinal adipocytes expressing Flag-tagged Cul2 or an empty vector. i, Left: Immunoblotting of endogenous PRDM16 and Cul2 in inguinal adipocytes expressing a scrambled control shRNA (Control) or two independent shRNAs targeting Cul2 (#1, #2). Right: Quantification of PRDM16 protein levels by Image J software and normalized to β-actin levels. j, Relative mRNA levels of Prdm16 in inguinal adipocytes expressing a scrambled control shRNA (Control) or two independent shRNAs targeting Cul2. k, Changes in endogenous PRDM16 protein stability in inguinal adipocytes expressing a scrambled control shRNA (Control) or shRNA targeting Cul2. PRDM16 protein levels were quantified by Image J software and normalized to β-actin levels. Representative results in a, c, f, i, k from two independent experiments. Gel source data are presented in Supplementary Fig. 1. a, b, d, e, g-j, n = 3 per group, biologically independent samples. Data are mean ± s.e.m.; two-sided P values by one-way ANOVA followed by Dunnett’s test (b, d, e, i, j) or unpaired Student’s t-test (a, g, h). n.s., not significant. Source data
Extended Data Fig. 2
Extended Data Fig. 2. Depletion of Cul2 promotes thermogenesis in white adipocytes.
a, Relative mRNA levels of indicated genes in inguinal adipocytes expressing a scrambled control shRNA (Control) or shRNAs targeting Cul2 with or without forskolin. n = 3 per group. b, Oil-Red-O staining of inguinal adipocytes stably expressing a scrambled control shRNA (Control) or shRNAs targeting Cul2. Scale bar, 100 μm. c, Relative mRNA levels of indicated genes in control and Cul2 KD primary inguinal adipocytes. n = 4 per group. d, Immunoblotting of UCP1 and β-actin in inguinal adipocytes expressing a scrambled control shRNA (Control) or shRNAs targeting Cul2. e, Gene ontology (GO) analysis of RNA-seq data in Fig. 1d showing upregulated biological processes in Cul2-depleted inguinal adipocytes relative to control adipocytes. f, Indicated mitochondrial DNA transcripts in control and Cul2 KD inguinal adipocytes. n = 4 per group. g, Expression levels (Trimmed Mean of M-values, TMM) of indicated genes in the differentiated inguinal adipocytes expressing a scrambled control (Control) or shRNA targeting Cul2 (Cul2 KD). n = 3 per group. h, GO analysis of RNA-seq data in Fig. 1d showing downregulated biological processes in Cul2-depleted inguinal adipocytes relative to control adipocytes. i, Heat-map of transcriptome showing the changes in mRNA levels of indicated genes involving in the extracellular matrix organization in inguinal adipocytes expressing scrambled control (Control) or shRNA targeting Cul2 (sh-Cul2 #1) with or without forskolin (+ cAMP). n = 3 per group. All the listed genes are significantly different (FDR < 0.01) by edgeR. Representative results in b and d from two independent experiments. Gel source data are presented in Supplementary Fig. 1. a, c, f, g, i, biologically independent samples. Data are mean ± s.e.m.; two-sided P values by one-way ANOVA followed by Dunnett’s test (a) or unpaired Student’s t-test (c, f, g). Source data
Extended Data Fig. 3
Extended Data Fig. 3. Cul2 overexpression inhibits fat thermogenesis without affecting adipogenesis.
a, Immunoblotting of Cul2 (Flag) proteins in inguinal adipocytes expressing an empty vector or Flag-tagged Cul2 (Cul2 OE). β-actin was used as a loading control. b, Oil-Red-O staining of inguinal adipocytes stably expressing an empty vector or Flag-tagged Cul2 (Cul2 OE). Scale bar, 50 μm. c, Immunoblotting for UCP1 and indicated mitochondrial proteins in inguinal adipocytes stably expressing an empty vector or Flag-tagged Cul2 (Cul2 OE). Differentiated inguinal adipocytes were treated with or without 5 μM or 10 μM forskolin (cAMP) for 8 h. β-actin was used as a loading control. d, Relative mRNA levels of indicated genes in inguinal adipocytes stably expressing an empty vector or Flag-tagged Cul2 in the presence or absence of forskolin (cAMP). n = 3 per group. e, Relative mRNA levels of indicated genes in control and Prdm16 KO inguinal adipocytes expressing a scrambled control shRNA or shRNA targeting Cul2. n = 3 per group. f, Relative mRNA levels of indicated genes in differentiated inguinal adipocytes that expressed Prdm16 (PRDM16 OE) or a control vector and a scrambled control shRNA or shRNA targeting Cul2. n = 6 per group. g, Relative mRNA levels of indicated genes in differentiated inguinal WAT-derived adipocytes expressing Prdm16 (PRDM16 OE) or a control vector and/or Flag-tagged Cul2 (Cul2 OE). n = 3 per group. Representative results in ac from two independent experiments. Gel source data are presented in Supplementary Fig. 1. dg, biologically independent samples. Data are mean ± s.e.m.; two-sided P values by unpaired Student’s t-test (dg). Source data
Extended Data Fig. 4
Extended Data Fig. 4. Characterization of Adipo-Cul2 KO mice on a regular chow diet.
a, Schematic illustration of adipocyte-selective Cul2 knockout mice. The cartoon was created with Biorender. b, Quantification of Cul2 protein levels in Fig. 2a normalized to β-actin levels. n = 3 per group. c, Left: Immunoblotting of Cul2 protein in BAT and gastrocnemius muscle. The right panel shows the quantification normalized to β-actin or GAPDH. n = 3 per group. Representative results from two independent experiments. Gel source data are presented in Supplementary Fig. 1. d, Tissue OCR in Fig. 2c normalized by per mg of tissue. n = 7 for BAT in both groups, n = 8 for IngWAT in both groups, n = 10 for EpiWAT in both groups. e, Changes in rectal temperature of mice during adaptation to 8 °C from 30 °C. n = 7 per group. f, Representative H&E staining of inguinal WAT in e. LN, lymph node. g, Relative mRNA levels of indicated genes in iBAT of mice at 30 °C. n = 10 (Adipo-Cul2 KO), n = 8 (Control). h, Representative H&E staining of iBAT in e. i, j, Representative H&E staining of inguinal WAT (i) and iBAT (j) of mice on a regular chow diet at room temperature. k, Quantification of indicated protein levels in Fig. 2d normalized to β-actin levels. n = 3 per group. l, Whole-body oxygen consumption rate of mice at 3 weeks of HFD. n = 7 for both groups. m, Total food intake and locomotor activity of mice in l. Representative images in f, hj from two biologically independent samples. Scale bar, 210 μm. be, g, km, biologically independent samples. Data are mean ± s.e.m.; two-sided P values by unpaired Student’s t-test (b, c, g, k, m), one-way ANOVA followed by Tukey’s test (d) or two-way repeated-measures ANOVA (l) followed by Fisher’s LSD test (e). Source data
Extended Data Fig. 5
Extended Data Fig. 5. Adipo-Cul2 KO mice on a HFD.
a, Fat mass and lean mass at 8 weeks of HFD. n = 12 (Adipo-Cul2 KO), n = 15 (Control). b, Tissue weight at 14 weeks of HFD. n = 12 (Adipo-Cul2 KO), n = 15 (Control). c, Representative H&E staining of the iBAT at 14 weeks of HFD. Scale bar, 210 μm. d, Relative mRNA levels of indicated genes in the BAT. n = 12 (Adipo-Cul2 KO), n = 15 (Control). e, Area of curve (AOC) of Fig. 2g was calculated by Graphpad software. f, Body weight at 3 weeks of HFD. n = 8 per group. g, Left: Glucose tolerance test at 3 weeks of HFD. n = 8 per group. P-value was determined by two-way repeated-measures ANOVA followed by Fisher’s LSD test. Right: AOC by Graphpad software. P-value was determined by unpaired Student’s t-test. h, AOC of Fig. 2h. i, Plasma insulin levels under fasted and glucose-stimulated conditions at 9 weeks of HFD. n = 12 (Adipo-Cul2 KO), n = 15 (Control). j, Relative mRNA levels of pro-inflammatory genes and pro-fibrosis genes in the IngWAT at 14 weeks of HFD. n = 12 (Adipo-Cul2 KO), n = 15 (Control). k, Heatmap of mRNA levels of indicated genes in the epididymal WAT at 14 weeks of HFD. n = 12 (Adipo-Cul2 KO), n = 15 (Control). l, m, Relative mRNA levels of indicated genes in the IngWAT (l) and EpiWAT (m) at 3 weeks of HFD. n = 8 per group. n, Representative H&E staining of the liver at 14 weeks of HFD. Scale bar, 210 μm. o, Relative mRNA levels of indicated hepatic genes at 3 weeks of HFD. n = 8 per group. p, Serum cholesterol and triglyceride levels at 3 weeks of HFD. n = 8 per group. Representative images in c and n from two biologically independent samples per group. a, b, dm, o, p, biologically independent samples. Data are mean ± s.e.m.; two-sided P values by unpaired Student’s t-test (a, b, df, h, jm, o, p) or two-way repeated-measures ANOVA followed by Fisher’s LSD test (i). Source data
Extended Data Fig. 6
Extended Data Fig. 6. Depletion of Appbp2 promotes fat thermogenesis.
a, The experimental scheme for identifying the substrate receptor for PRDM16. b, Silver-stained gel of immuno-purified Flag-Cul2 complex in inguinal adipocytes. c, Relative mRNA levels of indicated genes in differentiated inguinal adipocytes expressing a scrambled control shRNA (Control) or shRNAs targeting respective substrate receptors. n = 3 per group. d, Relative mRNA levels of Appbp2 in inguinal adipocytes stably expressing a scrambled control shRNA (Control) or two distinct shRNAs targeting Appbp2 (#1, #2). n = 3 per group. e, Oil-Red-O staining of inguinal adipocytes stably expressing a scrambled control shRNA (Control) or shRNAs targeting Appbp2 (#1, #2). Scale bar, 200 μm. f, Relative mRNA levels of indicated genes in inguinal adipocytes stably expressing a scrambled control shRNA (Control) or shRNAs targeting Appbp2 (Upper: sh-Appbp2 #1; Lower: sh-Appbp2 #2) in the presence or absence of forskolin (cAMP). n = 3 per group. g, Relative mRNA levels of indicated genes in control and Appbp2 KD primary inguinal adipocytes. n = 4 per group. h, The protein interaction between APPBP2 and PRDM16. *NS, non-specific band. i, The protein interaction between Cul2 and wild-type (WT) or L13A mutant form of APPBP2. Representative results in b, e, h, i from two independent experiments. Gel source data are presented in Supplementary Fig. 1. c, d, f, g, biologically independent samples. Data are mean ± s.e.m.; two-sided P values by one-way ANOVA followed by Dunnett’s test (c, d) or unpaired Student’s t-test (f, g). Source data
Extended Data Fig. 7
Extended Data Fig. 7. Cul2APPBP2 E3-ligase complex catalyses the polyubiquitination of PRDM16.
a, Reconstitution of PRDM16 polyubiquitination by indicated purified proteins. b, In vitro mono-ubiquitination of purified PRDM16 protein. Ubiquitinated PRDM16 was detected by immunoblotting with an anti-Flag antibody and subsequently analysed by LC-MS/MS. c, Identification of ubiquitin sites on PRDM16 by mass spectrometry. The KGG indicates that the lysine residue is modified by the addition of a di-glycine remnant. Predicted b- and y-type ions, are listed above and below the peptide sequence, respectively. Ions observed are labelled above the corresponding ion peaks in the spectrum. Seven sites of lysine ubiquitination were mapped to PRDM16. d, Polyubiquitination of the wild-type and indicated mutant forms of PRDM16. e, Changes in protein stability of the wild-type and ubiquitin-deficient form (K6R) of PRDM16. β-actin was used as a loading control. f, Expression levels of PRDM16 in e were quantified by Image J software and normalized to β-actin levels. n = 3 per group, biologically independent samples. Data are mean ± s.e.m.; two-sided P values by two-way ANOVA. Representative results in a, b, d, e from two independent experiments. Gel source data are presented in Supplementary Fig. 1. Source data
Extended Data Fig. 8
Extended Data Fig. 8. APPBP2 loss promotes PRDM16 protein stability and beige adipocyte biogenesis.
a, Changes in endogenous PRDM16 protein stability in control and Appbp2 KO inguinal adipocytes. PRDM16 protein levels were quantified by Image J software and normalized to β-actin levels. b, ChIP-qPCR analysis of PPARγ recruitment onto the PRDM16’s target loci in control and Appbp2 KO inguinal adipocytes. Ins1 was used as a nonspecific binding site. n = 3 per group. c, Left: Immunoblotting of indicated proteins in control and Appbp2 KO inguinal adipocytes. Right: Protein quantification normalized to β-actin levels. n = 3 per group. d, Relative mRNA levels of indicated genes in control and Appbp2 KO inguinal adipocytes in the presence or absence of forskolin. n = 3 per group. e, Mitochondrial DNA transcripts normalized to β-globin. n = 4 per group. f, OCR in control and Appbp2 KO adipocytes. OCR values were normalized by total protein (μg). n = 10 (Appbp2 KO), n = 9 (Control). Representative results in a and c from two independent experiments. Gel source data are presented in Supplementary Fig. 1. bf, biologically independent samples. Data are mean ± s.e.m.; two-sided P values by unpaired Student’s t-test (be) or two-way repeated-measures ANOVA (f). * P < 0.05, *** P < 0.001. n.s., not significant. Exact P-values are in Supplementary Table 2. Source data
Extended Data Fig. 9
Extended Data Fig. 9. APPBP2 loss promotes adipocyte thermogenesis via PRDM16.
a, Immunoblotting of indicated endogenous protein levels in control and Appbp2 KO inguinal adipocytes. β-actin was used as a loading control. b, Quantification of indicated proteins in a normalized to β-actin levels. c, Global ubiquitin level in control and Appbp2 KO inguinal adipocytes. d, Relative mRNA levels of indicated genes in control and Prdm16 KO inguinal adipocytes expressing a scrambled control (Control) or shRNA targeting Appbp2 (sh-Appbp2). N.D., not detected. e, Upper: Oil-Red-O staining of C2C12 myoblasts expressing a scrambled control (Control) or shRNAs targeting Appbp2. Lower: Relative Appbp2 mRNA levels in C2C12 myoblasts. f, Protein interaction between PRDM16 (aa. 881–1038) and APPBP2 in the presence and absence of EHMT1. g, Immunoblotting of indicated proteins in the interscapular BAT of mice at 12, 24, 48, and 74 weeks old. h, Expression of indicated proteins in the inguinal WAT and interscapular BAT of 12-weeks-old mice at 30 °C for 2 weeks, at room temperature, and at 4 °C for 24 h. Representative results in a, c, f-h from two independent experiments. Gel source data are presented in Supplementary Fig. 1. ae, g, h, n = 3 per group, biologically independent samples. Data are mean ± s.e.m.; two-sided P values by unpaired Student’s t-test (b, d) or one-way ANOVA followed by Dunnett’s test (e). Source data
Extended Data Fig. 10
Extended Data Fig. 10. Association between human APPBP2 variants and metabolic health.
a, Upper: The linear domain structure of APPBP2. Ser 561 is indicated. Middle: The rs34146848 SNP causes a Ser561 to Asn mutation in the APPBP2 protein. Lower: The amino acid Ser 561 is evolutionally conserved among indicated vertebrates. b, LocusZoom regional association plot between SNPs in the APPBP2 gene locus and waist-hip ratio adjusted for BMI in individuals of African descent. X-axis represents chromosomal location. Y-axis represents -log10 (P-value). Each point is an SNP coloured by linkage disequilibrium correlation with the lead SNP (rs8074975). SNPs denoted by triangles are in the 95% credible set of the association. c, APPBP2 rs34146848 variant is significantly associated with lower levels of 2-h postprandial (PD) glucose and 2-h postprandial (PD) insulin. The data are obtained from the FinnMetSeq exome sequence analysis. d, The Phenome-wide association (PheWAS) plot shows the significant (P < 0.05) associations of 17:58525018:C:T/rs34146848 for all available traits, generated by bottom-line meta-analysis across all datasets in the Common Metabolic Diseases Knowledge Portal (CMDKP).
Extended Data Fig. 11
Extended Data Fig. 11. Functional characterization of the human APPBP2 S561N mutant.
a, Protein interaction between PRDM16 and the wild-type (WT) or S561N mutant form of APPBP2. b, PRDM16 polyubiquitination catalysed by the wild-type (WT) or S561N mutant form of APPBP2. c, Genotyping of S561N knock-in mice that carried the S561N mutation in mouse Appbp2 gene by PCR followed by enzymatic digestion with ScaI. d, Sanger sequencing of S561N knock-in mice. Note that the amino acid sequence of APPBP2 is well conserved between mice and humans in the C-terminus with the exception at T562 (S562 for mouse APPBP2, see Extended Data Fig. 10a). To recapitulate the human S561N variant of APPBP2 in mice, we introduced mutations at S561N and S562T of mouse APPBP2. e, Relative mRNA levels of indicated genes in primary inguinal WAT-derived adipocytes from S561N knock-in mice and control (WT) mice. Primary SVFs from the inguinal WAT were differentiated in culture. n = 3 per group, biologically independent samples. Data are mean ± s.e.m.; P-value was determined by two-tailed unpaired Student’s t-test. Representative results in a, b, from two independent experiments. Gel source data are presented in Supplementary Fig. 1. Source data
Extended Data Fig. 12
Extended Data Fig. 12. Characterization of Adipo-Appbp2 KO mice.
a, Schematic illustration of Adipo-Appbp2 KO mice. The cartoon was created with Biorender. b, Left: Immunoblotting of indicated proteins. n = 3 per group. Right: Quantification of PRDM16 protein levels normalized to β-actin levels. n = 3 per group. c, Regression-based analysis of energy expenditure in Fig. 5d by CaIR-ANCOVA. d, Respiratory exchange ratio of mice in Fig. 5d. e, f, Total food intake (e) and locomotor activity (f) in Fig. 5d. g, Relative mRNA levels of indicated genes in the IngWAT in Fig. 5d. h, OCR in indicated tissues in Fig. 5d normalized by per mg of tissue. n = 7 for BAT in both groups, n = 8 for IngWAT in both groups, n = 10 for EpiWAT in both groups. i, Relative mRNA levels of indicated genes in the iBAT in Fig. 5d. n = 8 per group. j, H&E staining of iBAT in Fig. 5d. Scale bar, 210 μm. Representative images from two biologically independent samples. k, Left: Relative mRNA levels of Ucp1 in the iBAT of mice on a regular chow diet at room temperature. n = 3 per group. Middle: Immunoblotting of UCP1 protein in the BAT. n = 3 per group. Right: Quantification of UCP1 protein levels normalized to β-actin levels. n = 3 per group. l, Changes in rectal temperature of mice during adaptation to 8 °C from 30 °C. n = 7 (Adipo-Appbp2 KO), n = 6 (Control). m, Fat mass and lean mass at 8 weeks of HFD. n = 10 (Adipo-Appbp2 KO), n = 11 (Control). Representative results in b, k from two independent experiments. Gel source data are presented in Supplementary Fig. 1. b-i, k-m, biologically independent samples. Data are mean ± s.e.m.; two-sided P values by unpaired Student’s t-test (b, eg, i, k, m), one-way ANOVA followed by Tukey’s test (h) or two-way repeated-measures ANOVA (d) followed by Fisher’s LSD test (l). Source data
Extended Data Fig. 13
Extended Data Fig. 13. Metabolic profile of Adipo-Appbp2 KO mice on HFD.
a, Tissue weight at 12 weeks of HFD. n = 10 (Adipo-Appbp2 KO), n = 11 (Control). b, Relative mRNA levels of indicated genes in the IngWAT of mice in Fig. 5f. c, H&E staining in the iBAT of mice in Fig. 5f. Scale bar, 210 μm. Representative images from two biologically independent samples per group. d, Oleic acid oxidation in the indicated tissues at 10 weeks of HFD. n = 4 per group. e, f, AOC of in Fig. 5g (e) and Fig. 5h (f). g, Glucose tolerance test at 4 weeks of HFD. n = 10 per group. h, AOC of g. i, Insulin tolerance test at 5 weeks of HFD. n = 10 per group. j, AOC of i. k, l, Immunoblotting of phosphorylated (S473) and total Akt protein in the liver, EpiWAT and IngWAT at 4 weeks of HFD. n = 7 (Adipo-Appbp2 KO), n = 7 (Control) relative to HSP90 (k). Right: Quantification of phosphorylated (S473) AKT protein levels normalized to total AKT protein levels. n = 5 per group (l). m, Relative mRNA levels of indicated genes in the IngWAT at 4 weeks of HFD. n = 9 (Adipo-Appbp2 KO), n = 10 (Control). n, Heat-map of indicated genes in the epididymal WAT at 12 weeks of HFD. o, Relative mRNA levels of indicated genes in Extended Data Fig. 8d. n = 3 per group. p, Hepatic TG content at 12 weeks of HFD. q, Relative mRNA levels of indicated hepatic genes at 4 weeks of HFD. n = 9 (Adipo-Appbp2 KO), n = 10 (Control). r, Serum cholesterol and triglyceride levels in p. a, b, dr, biologically independent samples. Data are mean ± s.e.m.; two-sided P values by unpaired Student’s t-test (a, b, df, h, j, lr) or two-way repeated-measures ANOVA followed by Fisher’s LSD test (g, i). Source data

Comment in

References

    1. Cohen P, Kajimura S. The cellular and functional complexity of thermogenic fat. Nat. Rev. Mol. Cell Biol. 2021;22:393–409. doi: 10.1038/s41580-021-00350-0. - DOI - PMC - PubMed
    1. Wolfrum C, Gerhart-Hines Z. Fueling the fire of adipose thermogenesis. Science. 2022;375:1229–1231. doi: 10.1126/science.abl7108. - DOI - PubMed
    1. Seale P, et al. Transcriptional control of brown fat determination by PRDM16. Cell Metab. 2007;6:38–54. doi: 10.1016/j.cmet.2007.06.001. - DOI - PMC - PubMed
    1. Kajimura S, et al. Regulation of the brown and white fat gene programs through a PRDM16/CtBP transcriptional complex. Genes Dev. 2008;22:1397–1409. doi: 10.1101/gad.1666108. - DOI - PMC - PubMed
    1. Seale P, et al. PRDM16 controls a brown fat/skeletal muscle switch. Nature. 2008;454:961–967. doi: 10.1038/nature07182. - DOI - PMC - PubMed