. 2022 Sep;609(7925):128-135.
doi: 10.1038/s41586-022-05074-5. Epub 2022 Aug 17.

Endocytosis in the axon initial segment maintains neuronal polarity

Affiliations

Endocytosis in the axon initial segment maintains neuronal polarity

Kelsie Eichel et al. Nature. 2022 Sep.

Erratum in

Abstract

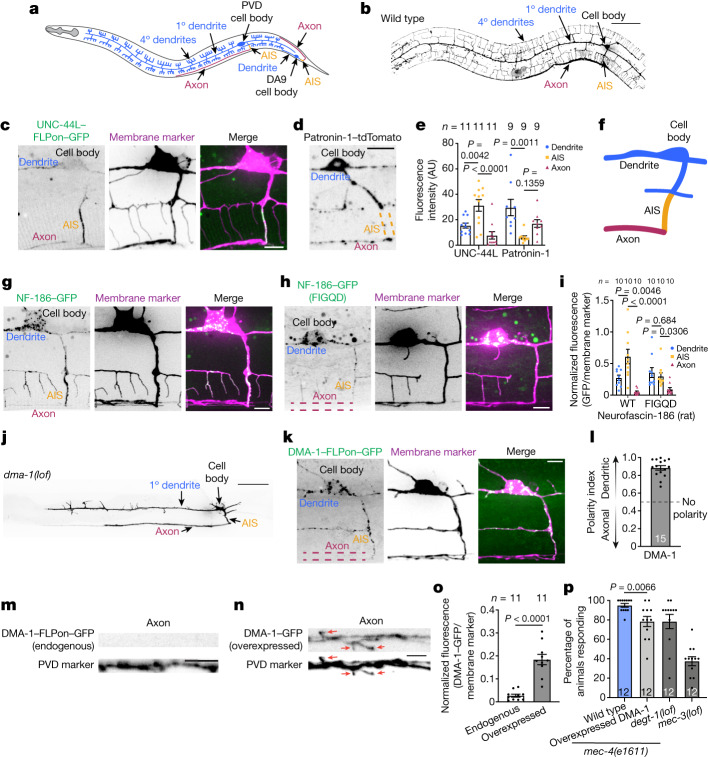
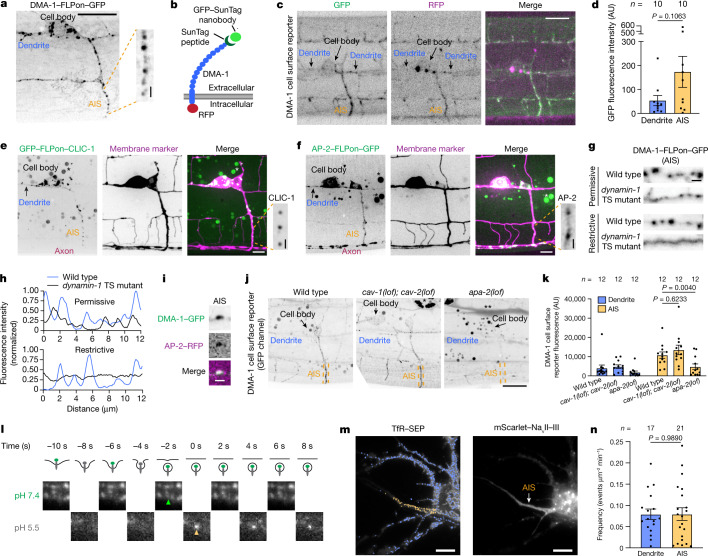
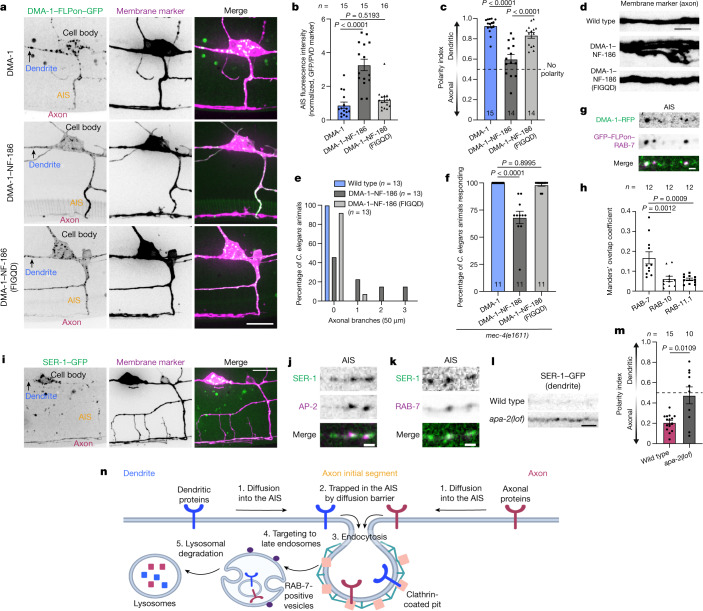
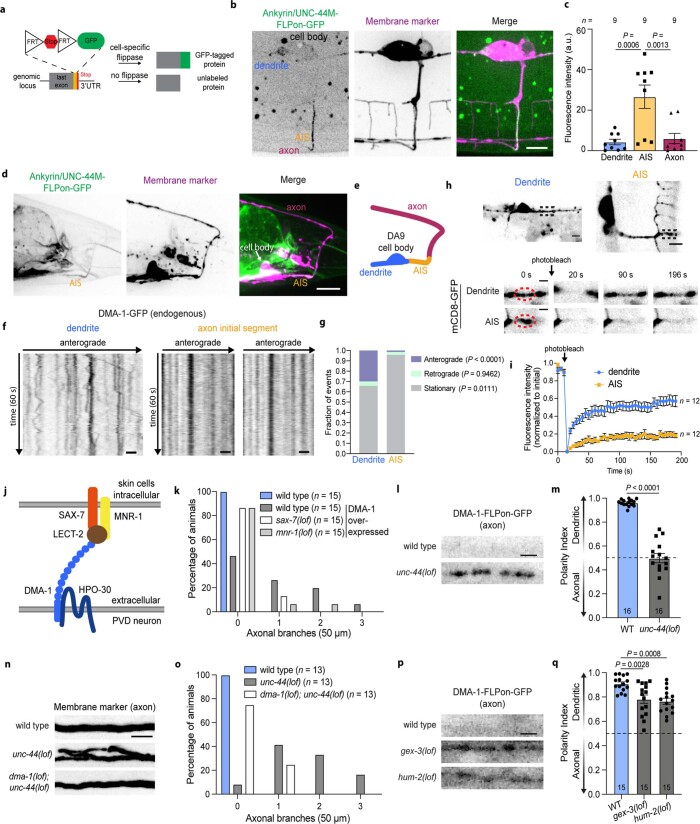
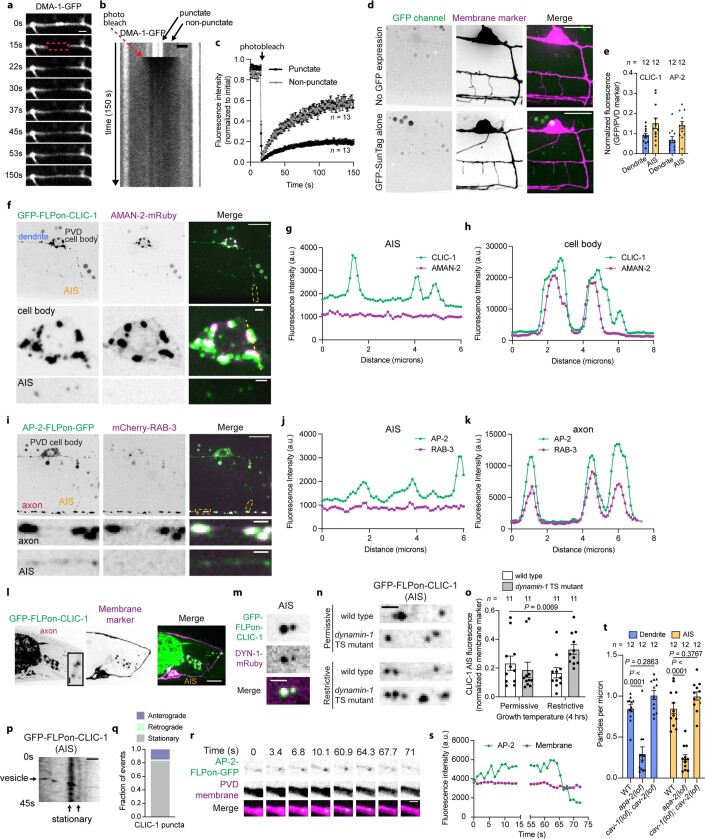
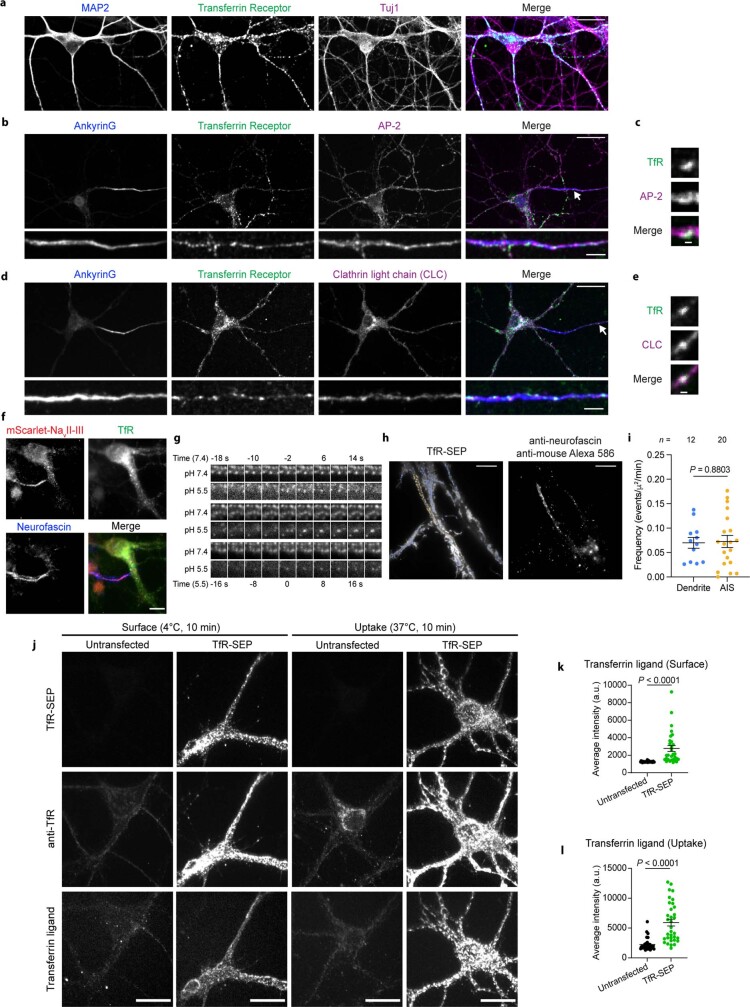
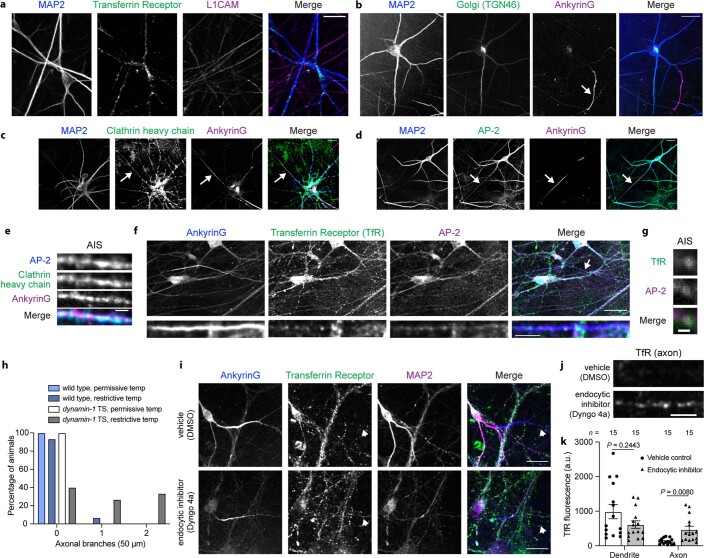
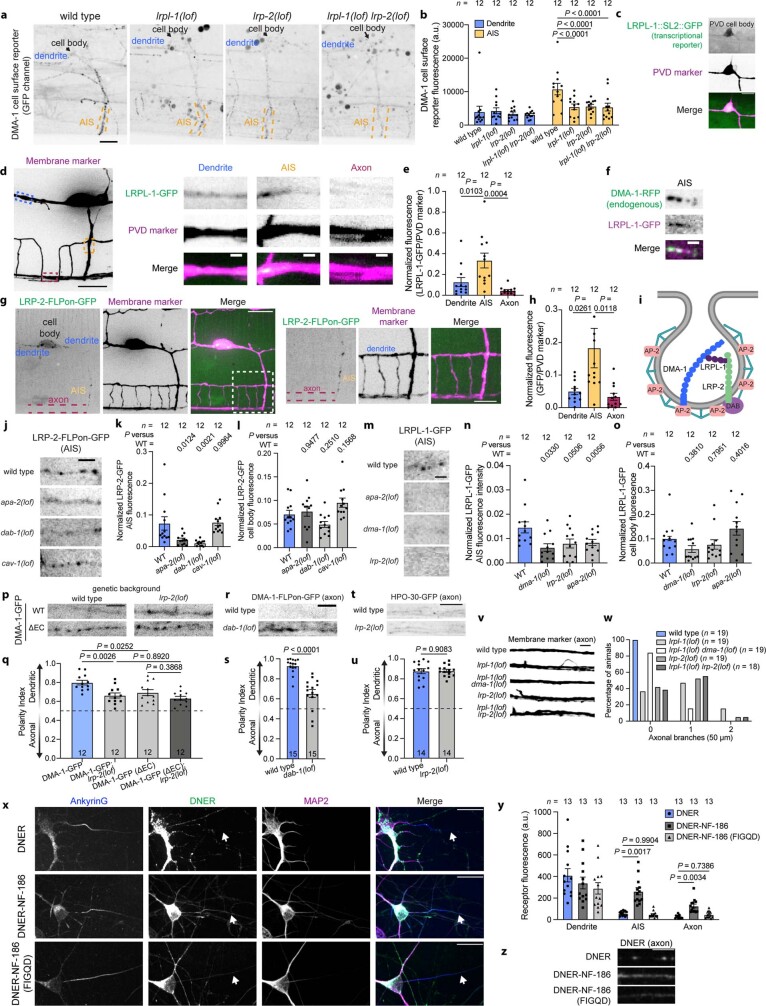
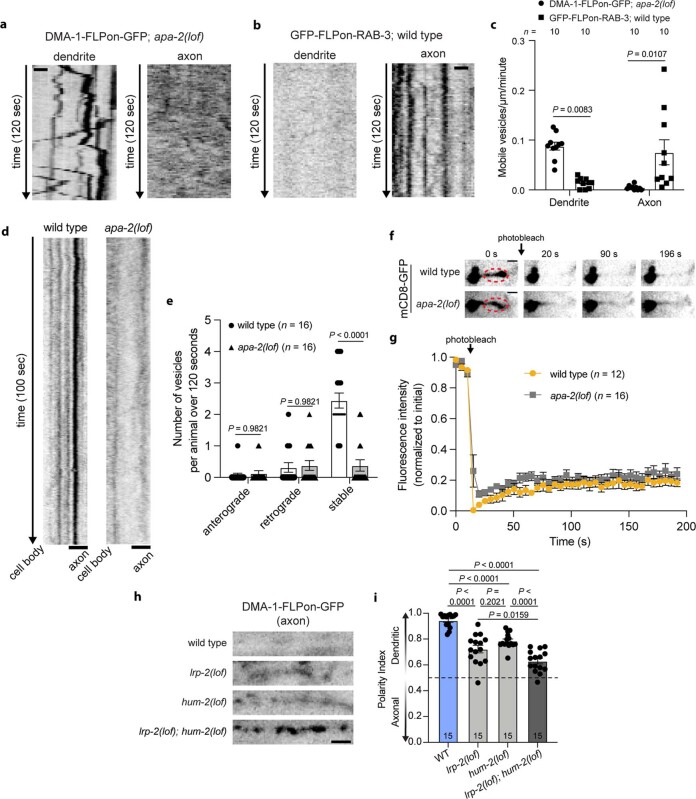
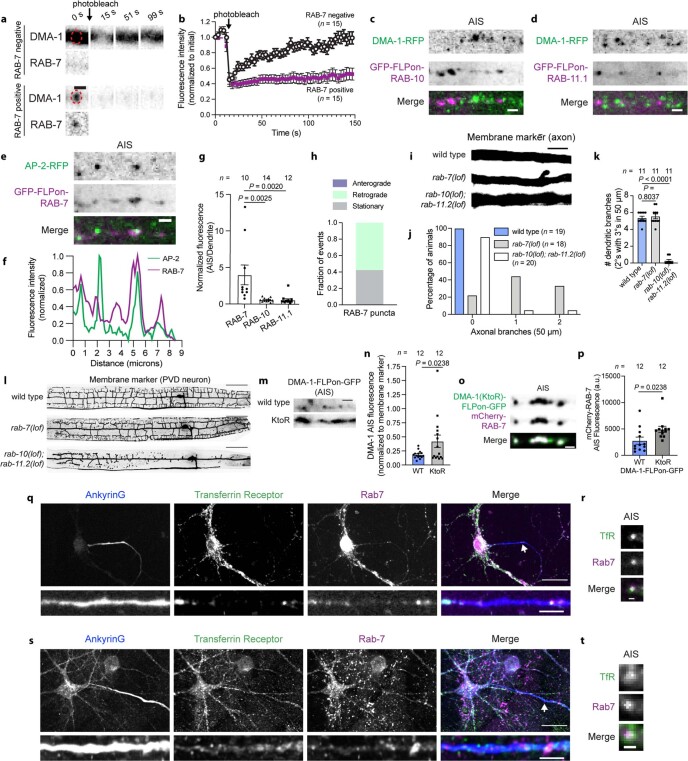
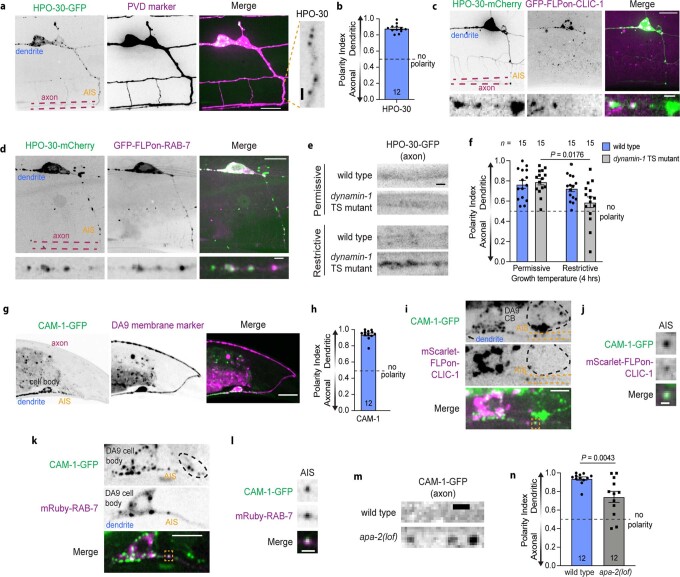
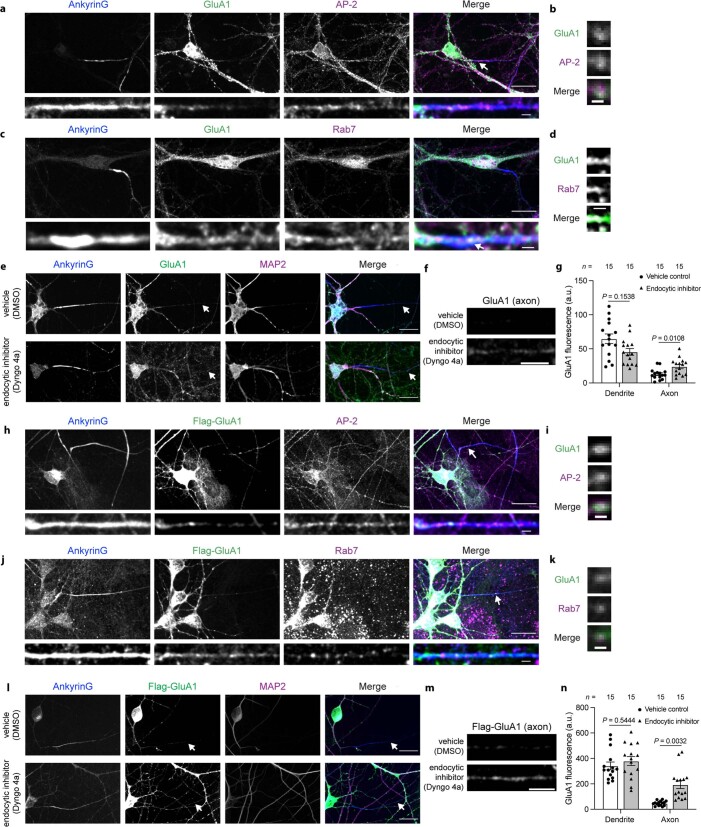
Neurons are highly polarized cells that face the fundamental challenge of compartmentalizing a vast and diverse repertoire of proteins in order to function properly1. The axon initial segment (AIS) is a specialized domain that separates a neuron's morphologically, biochemically and functionally distinct axon and dendrite compartments2,3. How the AIS maintains polarity between these compartments is not fully understood. Here we find that in Caenorhabditis elegans, mouse, rat and human neurons, dendritically and axonally polarized transmembrane proteins are recognized by endocytic machinery in the AIS, robustly endocytosed and targeted to late endosomes for degradation. Forcing receptor interaction with the AIS master organizer, ankyrinG, antagonizes receptor endocytosis in the AIS, causes receptor accumulation in the AIS, and leads to polarity deficits with subsequent morphological and behavioural defects. Therefore, endocytic removal of polarized receptors that diffuse into the AIS serves as a membrane-clearance mechanism that is likely to work in conjunction with the known AIS diffusion-barrier mechanism to maintain neuronal polarity on the plasma membrane. Our results reveal a conserved endocytic clearance mechanism in the AIS to maintain neuronal polarity by reinforcing axonal and dendritic compartment membrane boundaries.


Conflict of interest statement

The authors declare no competing interests.

Figures

Fig. 1
Fig. 1. An in vivo intact animal system to study AIS function in neuronal polarity.
a, Schematic of C. elegans PVD and DA9 neurons. 1°, primary; 4°, quaternary. b, Localization of the myristoylated GFP membrane marker in the wild-type PVD neuron. Scale bar, 50 µm. c, Cell-specific endogenous labelling of the long isoform of UNC-44 (UNC-44L–FLPon–GFP) using flippase-mediated recombination. Scale bar, 5 µm. d, Patronin-1–tdTomato localization in the PVD neuron. Scale bar, 10 µm. e, Quantification of UNC-44L and patronin-1 in PVD neuronal domains. AU, arbitrary units. f, Schematic of PVD neuronal domains. g, Rat NF-186 localization in the PVD neuron. Scale bar, 5 µm. h, Rat NF-186(FIGQD) localization in the PVD neuron. Scale bar, 5 µm. i, Average fluorescence of rat wild-type and mutant NF-186 proteins in PVD neuronal domains. j, Localization of a myristoylated GFP membrane marker of the PVD neuron in dma-1(lof) C. elegans animals. Scale bar, 50 µm. k,l, Cell-specific endogenous labelling (k) and polarity index (l) of DMA-1–FLPon–GFP in C. elegans animals. Scale bar, 10 µm. m,n, The axonal region of C. elegans animals expressing endogenous (m) or overexpressed (n) DMA-1–GFP. The same imaging conditions and formatting were used in both panels. Scale bars, 5 µm. Red arrows indicate aberrant axonal branches. o, Mean normalized GFP fluorescence in the axon of C. elegans animals described in m,n. p, Escape behaviour in C. elegans animals in response to a harsh touch stimulus. C. elegans animals carrying mutations in degt-1 and mec-3, which encode a DEG/ENaC channel and a homeobox transcription factor that controls the differentiation of touch receptor neurons, respectively, were included as control animals with known behavioural defects. Data are shown as mean ± s.e.m. n represents the number of individual animals. e,i One-way ANOVA with Dunnett’s test. o, Two-tailed unpaired t-test with Welch’s correction. p, Two-tailed unpaired t-test. Source data
Fig. 2
Fig. 2. Endocytosis of dendritically polarized receptors in the AIS.
a, Endogenous DMA-1–FLPon–GFP in the C. elegans PVD neuron AIS. Scale bar, 10 µm (main image), 1 µm (expanded selection). b, Schematic of the DMA-1 cell-surface reporter assay. DMA-1 is labelled with RFP and a 4× SunTag peptide. GFP-tagged SunTag nanobody is secreted from adjacent muscle cells. c,d, Confocal images (c) and DMA-1 cell-surface reporter fluorescence (d). Scale bar, 10 µm. e,f, Cell-specific endogenous expression of clathrin light chain (GFP–FLPon–CLIC-1) (e) and AP-2–FLPon–GFP (f). Asterisk indicates unrelated gut autofluorescence. Scale bar, 10 µm (main images), 1 µm (expanded selection). g, DMA-1–FLPon–GFP in the AIS of wild-type or dynamin-1 temperature-sensitive (TS) C. elegans animals. Scale bar, 1 µm. h, Line scan analysis of DMA-1 from images in g. i, Endogenous DMA-1–GFP is concentrated into AP-2-labelled structures in the AIS. Scale bar, 1 µm. j, GFP signal from the DMA-1 cell-surface reporter. Scale bar, 10 µm. k, GFP fluorescence of the DMA-1 cell-surface reporter in C. elegans animals. l, Top, illustration of endocytosis and the SEP signal during the pulsed-pH protocol (grey represents quenching). Endocytic vesicle scission generates an acid-resistant fluorescent punctum in the subsequent pH 5.5 step. Bottom, AIS of a cultured rat neuron (DIV9) imaged during the pulsed-pH protocol. An endocytic event (yellow arrow) is indicated by a pH 5.5-resistant signal that corresponds to a pre-existing cluster at pH 7.4 (green arrow). Contrast is increased for the pH 5.5 frames. m, A transfected rat neuron in culture (DIV9). Crosses represent endocytic events detected during a 10-min pulsed-pH protocol in the AIS (yellow, 85 events) and other neuronal regions (blue, 797 events). Scale bars, 10 µm. n, Frequencies of events in the indicated region. Data are mean ± s.e.m. n represents the number of animals or cells. k, Two-way ANOVA with Šidák's multiple comparison test. d,n, Two-tailed unpaired t-test. Source data
Fig. 3
Fig. 3. Endocytosis maintains dendritic receptor compartmentalization and is critical for neuronal function.
a, Localization of endogenously labelled DMA-1–FLPon–GFP in the axon of wild-type or dynamin-1 temperature-sensitive C. elegans animals. Scale bar, 2 µm. b, DMA-1–FLPon–GFP polarity index of C. elegans animals described in a. c, Confocal images of DIV26 human neurons treated with vehicle control (DMSO) or the endocytosis inhibitor Dyngo 4a for 18 h prior to fixation and staining for the indicated endogenous proteins. Arrows indicate axonal regions. Scale bars, 20 µm. d, TfR fluorescence in the axon of neurons described in c. Scale bars, 5 µm. e, Average TfR fluorescence intensity in the dendrite and axon of neurons described in c. f, Localization of endogenous DMA-1–FLPon–GFP in axons of wild-type and endocytic mutant C. elegans animals. Scale bar, 2 µm. g, DMA-1–FLPon–GFP polarity index of C. elegans animals described in f. h, A PVD axon labelled with a myristoylated GFP membrane marker in C. elegans animals of the indicated genotype. Scale bars, 5 µm. i, Number of axonal branches in the 50 µm distal to the AIS in C. elegans animals of the indicated genotype. j, Escape behaviour in C. elegans animals in response to a harsh touch stimulus. Wild-type and degt-1 data are from Fig. 1p. Data are mean ± s.e.m. n represents the number of individual animals or cells for each condition. b,e, Two-way ANOVA with Šidák's multiple comparison test. g, Brown–Forsythe and Welch one-way ANOVA with Dunnett's test. j, One-way ANOVA with Dunnett’s test. Source data
Fig. 4
Fig. 4. Antagonizing DMA-1 AIS endocytosis and identifying dendritic receptor post-endocytic targeting to RAB-7 positive late endosomes.
a, Localization of endogenous DMA-1–FLPon–GFP and DMA-1–NF-186–FLPon–GFP chimeras in the C. elegans PVD neuron. Scale bar, 10 µm. b,c, AIS fluorescence (b) and polarity index (c) of chimaeras from C. elegans animals described in a. d, Axonal region of C. elegans animals expressing DMA-1–NF-186 chimaeras. Scale bar, 5 µm. e, Axonal branches in the 50 µm distal to the AIS in C. elegans animals described in d. f, Escape behaviour in C. elegans animals expressing DMA-1-NF-186 chimaeras in response to a harsh touch stimulus. g, Endogenous DMA-1–RFP is concentrated into GFP–FLPon–RAB-7 positive puncta in the AIS of the C. elegans PVD neuron. Scale bar, 1 µm. h, Manders’ overlap coefficient analysis for endogenous DMA-1 and endogenous Rab proteins in the PVD neuron. i, SER-1–GFP localization in the PVD neuron. Scale bar, 10 µm. j,k, SER-1–GFP is concentrated into AP-2-labelled clathrin-coated structures (j) and RAB-7-labelled late endosomes in the AIS (k) of the PVD neuron. Scale bars, 1 µm. l, SER-1–GFP localization in the dendrite of wild-type and apa-2 mutant animals. Scale bar, 2 µm. m, SER-1–GFP polarity index for C. elegans animals described in l. n, A model depicting the steps of polarized receptor endocytic clearance from the AIS. Axonal (red) and dendritic (blue) transmembrane proteins: (1) diffuse laterally into the AIS; (2) are trapped in the AIS by a diffusion barrier; (3) are captured for endocytosis by binding the clathrin-mediated endocytic machinery; (4) are targeted to RAB-7-positive late endosomes; and (5) are degraded through lysosomal pathways. Model created with BioRender.com. Data are mean ±s.e.m. n represents the number of individual C. elegans animals for each condition. b,c,f,h, One-way ANOVA with Dunnett’s test. m, Two-tailed unpaired t-test with Welch’s correction. Source data
Extended Data Fig. 1
Extended Data Fig. 1. C. elegans neurons have hallmarks of an AIS.
(a) Schematic of flippase-mediated GFP-tagging of proteins for cell-specific endogenous labeling. (b) Cell-specific endogenous expression of the medium isoform of ankyrin/UNC-44 (UNC-44M-FLPon-GFP) in the PVD neuron. (c) Average fluorescence intensity in each neuronal domain. (d) Cell-specific endogenous expression of UNC-44M-FLPon-GFP in the DA9 neuron. (e) Schematic of DA9 neuronal domains. (f) Kymograph analysis of endogenous DMA-1-GFP vesicular trafficking. (g) Quantification of DMA-1-GFP vesicular trafficking (n = 70 vesicles/region from 13 (dendrite) or 26 (AIS) animals over 6 experiments). (h) Confocal microscopy images of mCD8-GFP after fluorescence recovery after photobleaching (FRAP). Black squares indicate zoomed regions. (i) Fluorescence intensity of the red region in h. FRAP recovery kinetics are sensitive to neurite geometry, which may affect recovery rates. P< 0.0001 using a two-way ANOVA. (j) Schematic of the receptor complex mediating PVD dendrite branching. (k) Axonal branches in the 50 microns distal to the AIS. (l) Endogenous DMA-1-FLPon-GFP localization in the axon of the indicated genotypes. (m) DMA-1-FLPon-GFP polarity index of animals described in l. (n) Axonal region of animals of the indicated genotype. (o) Axonal branches in the 50 microns distal to the AIS. (p) Endogenous DMA-1-FLPon-GFP localization in the axon of the indicated genotypes. (q) DMA-1-FLPon-GFP polarity index of animals described in p. Data are shown as mean ± s.e.m. N-values are indicated on bar graphs and represent the number of animals. P values in c and q were calculated using a one-way ANOVA with Dunnett’s. P values in g were calculated with a mixed model ANOVA with Šidák multiple comparison test. P values in m were calculated using an unpaired two tailed t test with Welch’s correction. Scale bars, 10 µm (d), 5 µm (b, h top, n), and 2 µm (f, h bottom, l, p). Source data
Extended Data Fig. 2
Extended Data Fig. 2. Characterization of endocytic vesicles in the AIS.
(a) FRAP of DMA-1-GFP pools in the PVD dendrite. (b) Kymograph analysis of FRAP experiment in a. (c) FRAP analysis of DMA-1-GFP pools (n = 13 animals/condition; P< 0.0001 using a two-way ANOVA). (d) Confocal images of DMA-1 cell surface assay controls in PVD. (e) Quantification of cell-specific endogenous proteins. (f) Cell specific expression of endogenous GFP-FLPon-CLIC-1 and Golgi-localized alpha mannosidase/AMAN-2[1-84aa]-mRuby in PVD. The Golgi network contains several Golgi-stacks. Linescan analysis of fluorescence intensity in the (g) AIS and (h) cell body from the regions marked by yellow in f. (i) AP-2-FLPon-GFP and mCherry-RAB-3 expression in PVD. Linescan analysis of fluorescence intensity in the (j) AIS and (k) axon from the regions marked by yellow in i. (l) Cell-specific endogenous expression of GFP-FLPon-CLIC-1 in DA9. Inset shows AIS zoom. (m) Cell-specific endogenous GFP-FLPon-CLIC-1 and dynamin-1-mRuby colocalize in the AIS. (n) Cell-specific endogenous GFP-FLPon-CLIC-1 puncta in the AIS of the indicated animals. (o) Average fluorescence intensity of experiments described in n. (p) Kymograph of cell-specific endogenous GFP-FLPon-CLIC-1 in the PVD AIS. (q) GFP-FLPon-CLIC-1 puncta dynamics in the AIS (n = 40 vesicles). (r) Montage and (s) fluorescence intensity of AP-2-FLPon-GFP in the AIS. (t) GFP-positive puncta density from the DMA-1 cell surface reporter assay in the AIS of the indicated animals. Data are shown as mean ± s.e.m. N-values are indicated on bar graphs and represent the number of animals. P values were calculated as follows: o using a Brown-Forsythe and Welch one-way ANOVA, and t using two-way ANOVA with Tukey’s multiple comparisons test. Scale bars, 10 µm (d, f top, i top, l), 2 µm (a, b, m, n), 1 µm (f middle, f bottom, i middle, i bottom, l inset, p, r). Source data
Extended Data Fig. 3
Extended Data Fig. 3. Endocytosis of dendritic receptors in the AIS of cultured mouse and rat neurons.
(a, b) Confocal images of mouse neurons fixed and stained at DIV14 for the indicated endogenous proteins, including MAP2 (dendrites) and Tuj1 (all neurites). AIS zoom is shown on the bottom, and brightness is increased for better visibility. (c) AP-2 labelled structure containing TfR from the AIS of the image shown in b (white arrow). Brightness is increased for better visibility. (d) Confocal images of mouse neurons fixed and stained at DIV14 for the indicated endogenous proteins. AIS zoom is shown on the bottom, and brightness is increased for better visibility. (e) Clathrin-coated structure containing TfR in the AIS of the image shown in d (white arrow). Brightness is increased for better visibility. (f) Neurons transfected with TfR-SEP and mScarlet-NavII-III, fixed at DIV10, and stained with anti-neurofascin (NF) antibody (clone A12/18) and anti-mScarlet antibody. Intense staining of both mScarlet-NavII-III and NF defines the AIS. 18/20 transfected neurons (from 3 cultures) showed colocalization with endogenous NF. (g) Scission/endocytic example events from Fig. 2m, as defined as the appearance of a TfR-SEP cluster (i.e. an endocytic vesicle) at pH 5.5 (time 0) and corresponding to a preexisting cluster at pH 7.4 (time −2). Note that these vesicles remain visible at pH 5.5 for 3 frames or more. Contrast is increased for pH 5.5 frames for better visibility. (h) Same analysis as Fig. 2m for neurons transfected with TfR-SEP and incubated with anti-NF antibody (clone A12/18). (i) Frequencies of endocytic events in the AIS (20 recordings from 4 different cultures) and selected dendrites (12 recordings). Event frequency is similar between both AIS visualization methods: for neurons expressing mScarlet-NavII-III, the frequency is 0.080 ± 0.015 events/μm2/min (n = 21) and for neurons stained with anti-NF antibody, the frequency is 0.073 ± 0.012 events/μm2/min (n = 20); P = 0.72 using an unpaired t test. (j) Hippocampal neurons (untransfected and TfR-SEP transfected) with surface bound or internalized transferrin ligand labelled with Alexa647, fixed and labelled with anti-transferrin receptor antibody (anti-TfR, clone H68.4). (k) Fluorescence intensity of surface transferrin ligand labeled with Alexa647 bound at 4 °C (surface) is 2.19 fold higher in TfR-SEP transfected neurons: 1266 ± 12 arbitrary units (a.u). in control (n = 32) versus 2773 ± 341 a.u. in TfR-SEP transfected neurons (n = 30) across 3 cultures. (l) Fluorescence intensity of internalized transferrin ligand labelled with Alexa647 is 2.64 fold higher in TfR-SEP transfected neurons: Control (2238 ± 174 a.u., n = 33) versus TfR-SEP (5911 ± 568 a.u., n = 34) across 3 cultures. P values in i, k, and l were calculated with a two-tailed unpaired t test. All data are shown as mean ± s.e.m. N-values are indicated on bar graphs and represent the number of neuronal regions scored for each condition. Scale bars, 20 µm (a, b top, d top, j), 10 µm (f, h), 5 µm (b bottom, d bottom) and 1 µm (c, e). Source data
Extended Data Fig. 4
Extended Data Fig. 4. Endocytosis of dendritic receptors in the AIS of human neurons.
(a) Dendritically polarized TfR and axonal L1CAM are polarized to their appropriate domains in induced human neurons that were fixed and stained at DIV26. (b) Induced human neurons have a single ankyrinG-labelled AIS when co-cultured with glial cells. (c, d) Confocal images of human neurons fixed and stained at DIV26 for endocytic proteins. Arrows designate the AIS. (e) AIS of induced human neurons that were fixed and stained at DIV26 for ankyrinG, AP-2, and clathrin heavy chain. (f) Confocal images of human neurons fixed and stained at DIV26 for the indicated endogenous proteins. Bottom images show the AIS (brightness is increased for better visibility). Note that extra-neuronal fluorescence represents endogenous staining in co-cultured glial cells. (g) Zoomed in region from f of an endocytic vesicle in the AIS. Brightness is increased for better visibility. (h) Histogram analysis of axonal branches in the 50 microns distal to the AIS in the indicated animals (n = 15 animals/genotype). (i) Confocal images of cultured mouse neurons pretreated with vehicle control (top, DMSO) or endocytic inhibitor (bottom, Dyngo 4a) for 5 h prior to being fixed and stained at DIV14. Arrows designate the axon. (j) Endogenous TfR fluorescence in the axon from neurons described in i. Arrows designate the cropped region. (k) Average TfR fluorescence in the axon compared to the dendrite. All data are shown as mean ± s.e.m. N-values are indicated on bar graphs and represent the number of individual cells scored for each condition. P values in k were calculated using a two-way ANOVA with Šidák multiple comparison test. Scale bars, 20 µm (a, b, c, d, f top, i), 5 µm (f bottom, j), 2 µm (e), 1 µm (g). Source data
Extended Data Fig. 5
Extended Data Fig. 5. LRPL-1 interacts with the DMA-1 extracellular domain.
(a) Cell-specific endogenous DMA-1-FLPon-GFP localization in the AIS of the indicated animals. DMA-1(ΔYFGI) is a genomic deletion of the putative AP-2-binding motif YXXΦ. (b) DMA-1 punctate measure of animals described in a. (c) Schematic of DMA-1 endocytic motifs. (d) Localization of wild type and extracellular domain deletion (ΔEC) versions of DMA-1-GFP. (e) Punctate measure of animals described in d. (f) Z-scores (signal defined as standard deviations over mean value of measurements) in the extracellular interactome assay (ECIA) for 380 C. elegans ectodomains as prey against Fc-tagged DMA-1 as bait (top), and Z-scores DMA-1-AP5 as prey (bottom). See Supplementary Table 1 for raw data. (g) Phylogenetic tree analysis created using Clustal Omega multiple sequence alignments. (h) Protein domain structures: LY repeats are indicative of LRP-type beta-propeller domains, known as YWTD domains. (i) Protein binding between four ectodomains using ECIA. Weaker DMA-1-Fc binding to LRPL-1-AP5 is due to LRPL-1-AP5 lower expression (see Extended Data Fig. 5j). (j) Western blot analysis of protein purification for ECIA experiments in Extended Data Fig. 5i. Western blot was to confirm protein expression and thus not repeated. Gel source data in Supplementary Fig. 1. (k) Surface plasmon resonance experiment for an LRPL-1-immobilized Biacore Streptavidin chip against DMA-1 ectodomain as analyte. Left: Blank-subtracted SPR sensorgrams for DMA-1 at 78 nM to 10 µM with kinetic model fits shown in black. Right: Binding isotherm for the SPR data fit to the Langmuir 1:1 binding model. The estimated KD, 6.9 ± 0.7 µM (±: standard error of the fit), is depicted with a red dashed line. All data are shown as mean ± s.e.m. N-values are indicated on bar graphs and represent the number of animals. P values in b were calculated using a two-way ANOVA with Šidák multiple comparison test. P values in e were calculated using a two-tailed unpaired t test. Scale bars, 2 µm (a, d). Source data
Extended Data Fig. 6
Extended Data Fig. 6. Molecular dissection and manipulation of AIS endocytic mechanisms.
(a) GFP channel of the DMA-1 cell surface reporter in wild type and LRP protein mutant animals. (b) Quantification of GFP fluorescence from animals described in a. Wild type data is from Fig. 2k. (c) An SL2-GFP fusion at the C-terminus of the LRPL-1 endogenous locus showing LRPL-1 transcription in PVD. (d) Cell-specific expression of LRPL-1-GFP in PVD. Maximum Z projection of a 15 micron stack of the PVD membrane marker (left). Maximum Z projection of 0.65 micron stacks of the outlined regions on the left image (right). (e) Cell-specific LRPL-1-GFP fluorescence in PVD. (f) Endogenous DMA-1-RFP colocalizes with LRPL-1-GFP puncta in the AIS. (g) Cell-specific endogenous labelling of LRP-2-FLPon-GFP in PVD. Zoomed in region (indicated by the white box) is shown on the right. (h) Average LRP-2 fluorescence in neuronal subregions. (i) Model depicting two pathways for DMA-1 endocytosis. (j) Cell-specific endogenous LRP-2-FLPon-GFP localization in the AIS requires AP-2/APA-2 and DAB-1 function but not CAV-1. Average LRP-2-FLPon-GFP fluorescence in the (k) AIS and (l) cell body. (m) LRPL-1-GFP punctate localization in the AIS is dependent upon apa-2, dma-1, and lrp-2. Average LRPL-1-GFP fluorescence in the (n) AIS and the (o) cell body. (p) Cell-specific localization of wild type DMA-1-GFP or DMA-1 lacking its extracellular domain (DMA-1(ΔEC)) in the PVD neuron axon of wild type and lrp-2 loss of function mutant animals. (q) DMA-1-FLPon-GFP polarity index of animals described in p. (r) Cell-specific endogenous DMA-1-FLPon-GFP localization in the axon of dab-1 loss of function mutant animals. (s) DMA-1-FLPon-GFP polarity index of animals described in r. (t) Axonal regions of wild type and lrp-2 loss of function mutant animals cell-specifically expressing HPO-30-GFP. (u) HPO-30-GFP polarity index of animals described in t. (v) PVD axon labelled with a myristoylated GFP membrane marker in animals of the indicated genotype. (w) Axonal branches within the 50 microns distal to the AIS in animals described in v (n = 19 animals/genotype, except lrpl-1 lrp-2 for which n = 18 animals). (x) Chimera localization in induced human neurons fixed and stained at DIV14. (y) Chimera fluorescence in the specified neuronal region. (z) Chimera fluorescence in the axon of cells shown in x. Arrows designate the cropped region. Brightness was increased for better visibility, and all conditions were processed the same. Data are shown as mean ± s.e.m. N-values are indicated on bar graphs and represent the number of animals or cells. P values were calculated as follows: b, e, h, k, l, n, o, and q using a two-way ANOVA with Šidák multiple comparison test; s and u using an unpaired two-tailed t test; y using a two-way ANOVA with Tukey’s multiple comparison test. Scale bars, 20 µm (x), 10 µm (d left, g left), 5 µm (a, c, g right, p, r, t, v, z), 2 µm (j) 1 µm (d right, f, m). Source data
Extended Data Fig. 7
Extended Data Fig. 7. AIS endocytosis works in conjunction with known polarity mechanisms in the AIS to maintain neuronal polarity.
(a) Time-lapse imaging of cell-specific endogenous DMA-1-FLPon-GFP in apa-2 loss of function mutants shows robust vesicular trafficking in the dendrite but not axon. (b) Time-lapse imaging of cell-specific endogenous GFP-FLPon-RAB-3 shows robust vesicular localization and movement in the axon but not dendrite. (c) Quantification of vesicle dynamics described in a, b. (d) Kymograph analysis from time-lapse imaging of DMA-1-FLPon-GFP vesicles in the AIS of wild type and apa-2(lof) mutant animals. (e) Quantification of DMA-1-FLPon-GFP vesicular trafficking in the proximal AIS of wild type and apa-2(lof) endocytic mutant animals. (f) FRAP of mCD8-GFP in the AIS of wild type and apa-2(lof) endocytic mutants. P= 0.5842 using a two-way ANOVA to compare the two genotypes. (g) Fluorescence intensity of the red circled regions in f. Wild type data are from Extended Data Fig. 1i. (h) Cell-specific endogenous DMA-1-FLPon-GFP localization to the axon in the indicated animals. (i) DMA-1-FLPon-GFP polarity index of animals described in h. All data are shown as mean ± s.e.m. N-values are indicated on bar graphs and represent the number of individual animals scored for each condition. P values in c and e were calculated using a two-way ANOVA with Šidák multiple comparison test. P values in i were calculated using a one-way ANOVA with Šidák multiple comparison test. Scale bar, 2 µm (d, f, h), 1 µm (a, b). Source data
Extended Data Fig. 8
Extended Data Fig. 8. Dendritically polarized receptors are targeted to Rab7-positive late endosomes in the AIS.
(a) DMA-1-GFP FRAP dynamics. (b) Quantification of FRAP experiments described in a. Endogenously labelled DMA-1-RFP and (c) GFP-FLPon-RAB-10 or (d) GFP-FLPon-RAB-11.1 in the AIS. (e) AP-2-RFP and endogenous GFP-FLPon-RAB-7 puncta rarely colocalize in the AIS. (f) Linescan analysis of fluorescence intensity of images in e. (g) Endogenous RAB protein average fluorescence. (h) Endogenous GFP-FLPon-RAB-7 vesicle dynamics in the AIS (n = 19 vesicles from 15 animals). (i) PVD axon labeled with a myristoylated GFP membrane marker in the indicated animals. (j) Axonal branches in the 50 µm distal to the AIS in animals described in i. (k) Number of secondary dendritic branches with tertiary branches in the proximal 50 µm of the anterior dendrite. (l) PVD neuron labelled with a myristoylated GFP marker in the indicated animals. (m) AIS localization of cell-specific endogenous DMA-1-FLPon-GFP with lysine to arginine mutations in the cytoplasmic tail (KtoR: K536R, K583R, K595R). (n) Endogenous DMA-1 fluorescence of animals described in m. (o) Cell-specific endogenous DMA-1-FLPon-GFP (KtoR) colocalizes with mCherry-RAB-7 in the AIS. (p) Endogenous DMA-1-FLPon-GFP (KtoR) increases mCherry-RAB-7 fluorescence in the AIS. (q) Confocal images of cultured mouse neurons fixed and stained at DIV14 for the indicated endogenous proteins. Bottom shows AIS zoom, and brightness is increased to improve visibility. (r) Zoomed in region of a Rab7-labelled vesicle in the AIS from the image shown in q (arrow designates the cropped region). Brightness is increased for better visibility. (s) Confocal images of human neurons fixed and stained at DIV26 for the indicated endogenous proteins. Bottom shows AIS zoom. Brightness is increased for better visibility. Extra-neuronal Rab7 fluorescence is from co-cultured glia. (t) Rab7-labelled vesicle containing TfR in the AIS from the image in s (arrow designates the cropped region). Brightness is increased for better visibility. Data are shown as mean ± s.e.m. N-values are indicated on bar graphs and represent the number of animals or cells. P values in g and k were calculated using a one-way ANOVA with Šidák multiple comparison test. P values in n and p were calculated using a two-tailed unpaired t test. Scale bars, 50 µm (l), 20 µm (q top, s top), 5 µm (i, q bottom, s bottom), 1 µm (a, c, d, e, m, o, r, t). Source data
Extended Data Fig. 9
Extended Data Fig. 9. Diverse polarized receptors in C. elegans neurons are endocytosed in the AIS and require endocytosis for their polarity.
(a) HPO-30-GFP localization in the PVD neuron. HPO-30-GFP is punctate in the AIS (inset). (b) HPO-30-GFP polarity index of animals described in a. (c) HPO-30-mCherry overlaps with CLIC-1-FLPon-GFP in the PVD neuron AIS. (d) HPO-30-mCherry overlaps with GFP-FLPon-RAB-7 in the PVD neuron AIS. (e) HPO-30-GFP in the axon of wild type or dynamin-1 temperature sensitive (TS) mutants grown at the permissive (20 °C) or restrictive temperatures (32 °C, 4 h). (f) HPO-30-GFP dendritic polarity of animals described in e. (g) CAM-1-GFP localization in the DA9 neuron. (h) CAM-1-GFP polarity index of animals described in g. (i) CAM-1-GFP colocalizes with mScarlet-FLPon-CLIC-1 in the DA9 neuron AIS (left). Outlined in black is a neighbouring cell body. (j) Clathrin-coated vesicle containing CAM-1-GFP in the AIS of the animal shown in i. Yellow box indicates cropped region. (k) CAM-1-GFP colocalizes with mRuby-RAB-7 in the DA9 neuron AIS. Outlined in black is a neighbouring cell body. (l) RAB-7 labelled vesicle containing CAM-1-GFP in the AIS of animal shown in k. Yellow box indicates cropped region. (m) CAM-1-GFP mislocalizes to the axon in apa-2 loss of function mutant animals. (n) CAM-1-GFP polarity index of animals described in k. Wild-type data are from Extended Data Fig. 9h. All data are shown as mean ± s.e.m. N-values are indicated on bar graphs and represent the number of individual animals. P values in n were calculated using a two-tailed unpaired t test. P values in f were calculated using a two-way ANOVA with Šidák multiple comparison test. Scale bars, 10 µm (a, c top, d top, g), 5 µm (i, k), 2 µm (e), 1 µm (a inset, c bottom, d bottom, j, l, m). Source data
Extended Data Fig. 10
Extended Data Fig. 10. Dendritically polarized GluA1 receptors are endocytosed in the AIS and targeted to Rab7 positive late endosomes.
(a) Confocal images of mouse neurons fixed and stained at DIV14 for the indicated endogenous proteins. Bottom shows AIS zoom (brightness is increased for better visibility). (b) AP-2 labelled vesicle containing GluA1 in the AIS from the neuron shown in a (arrow designates cropped region). Brightness is increased for better visibility. (c) Confocal images of mouse neurons fixed and stained at DIV14 for the indicated endogenous proteins. Bottom shows AIS zoom. (d) Rab7 labelled vesicle containing GluA1 in the AIS from the neuron shown in c (arrow designates cropped region). (e) Confocal images of mouse neurons pretreated with vehicle control (top, DMSO) or endocytic inhibitor (bottom, Dyngo 4a) for 5 h prior to being fixed and stained at DIV14. Arrows designate the proximal axon. (f) Proximal axonal region of neurons described in e (arrows show location of cropped region). (g) Average GluA1 fluorescence in the dendrite or proximal axon. (h) Confocal images of human neurons fixed and stained at DIV26 for the indicated proteins. Bottom shows AIS zoom (brightness is increased for better visibility). (i) AP-2 labelled vesicle containing Flag-GluA1 in the AIS from the neuron shown in h (arrow designates cropped region). Brightness is increased for better visibility. (j) Confocal images of human neurons fixed and stained at DIV26 for the indicated proteins. Bottom shows AIS zoom (brightness is increased for better visibility). (k) Rab7 labelled vesicle containing Flag-GluA1 in the AIS from the neuron shown in j (arrow designates cropped region). Brightness is increased for better visibility and extra-neuronal Rab7 fluorescence signal is from co-cultured glial cells. (l) Confocal images of human neurons pretreated with vehicle control (top, DMSO) or endocytic inhibitor (bottom, Dyngo 4a) for 18 h prior to being fixed and stained at DIV26. Arrows designate the axon. (m) Axonal region of neuron in l (arrows designate cropped region). (n) Average Flag-GluA1 fluorescence in the dendrite or axon. Data are shown as mean ± s.e.m. N-values are indicated on bar graphs and represent the number of cells. P values in g and n were calculated using a two-way ANOVA with Šidák multiple comparison test. Scale bars, 20 µm (a top, c top, e, h top, j top, l), 5 µm (f, m), 2 µm (a bottom, c bottom, d, h bottom, j bottom), 1 µm (b, i, k). Source data

References

    1. Bentley, M. & Banker, G. The cellular mechanisms that maintain neuronal polarity. Nat. Rev. Neurosci.17, 611–622 (2016). - PubMed
    1. Huang, C. Y.-M. & Rasband, M. N. Axon initial segments: structure, function, and disease. Ann. N. Y. Acad. Sci.1420, 46–61 (2018). - PMC - PubMed
    1. Leterrier, C. The axon initial segment: an updated viewpoint. J. Neurosci.38, 2135–2145 (2018). - PMC - PubMed
    1. Wheeler, R. J. & Hyman, A. A. Controlling compartmentalization by non-membrane-bound organelles. Phil. Trans. R. Soc. B373, 20170193 (2018). - PMC - PubMed
    1. Takano, T., Funahashi, Y. & Kaibuchi, K. Neuronal polarity: positive and negative feedback signals. Front. Cell Dev. Biol.7, 69 (2019). - PMC - PubMed

Substances