. 2022 Sep;609(7926):354-360.
doi: 10.1038/s41586-022-05105-1. Epub 2022 Aug 17.

MYB orchestrates T cell exhaustion and response to checkpoint inhibition

Affiliations

MYB orchestrates T cell exhaustion and response to checkpoint inhibition

Carlson Tsui et al. Nature. 2022 Sep.

Abstract

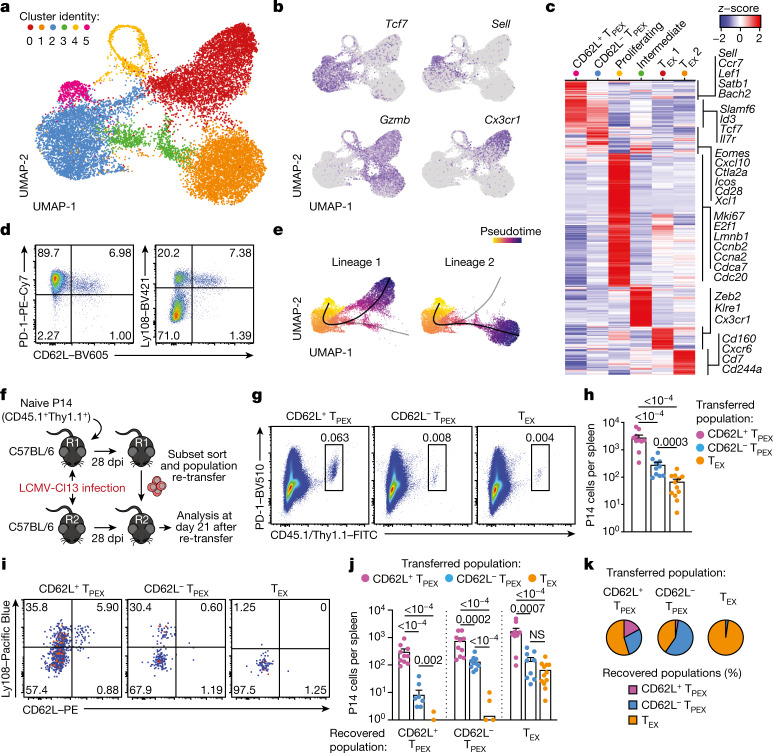
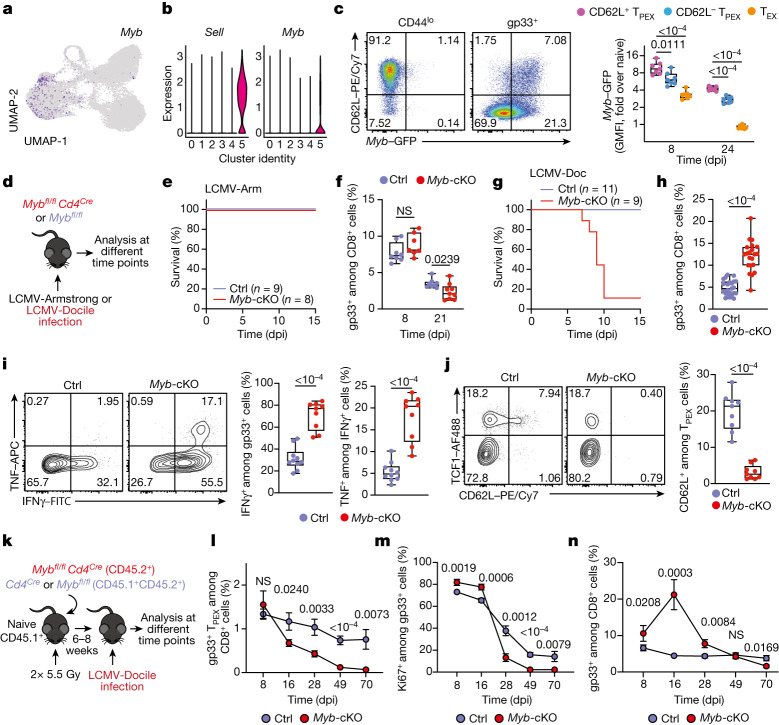
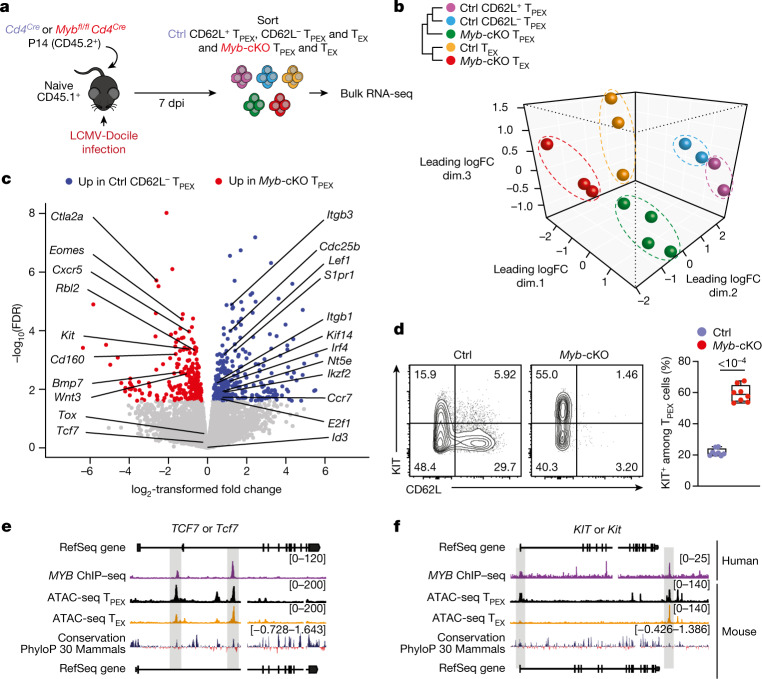
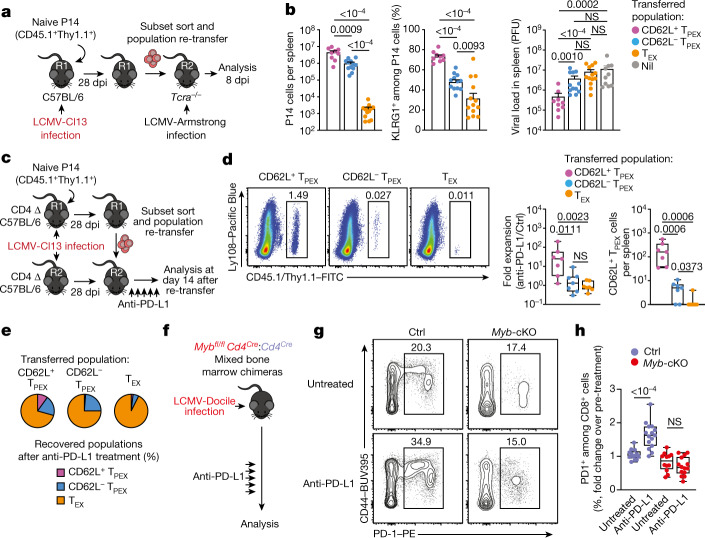
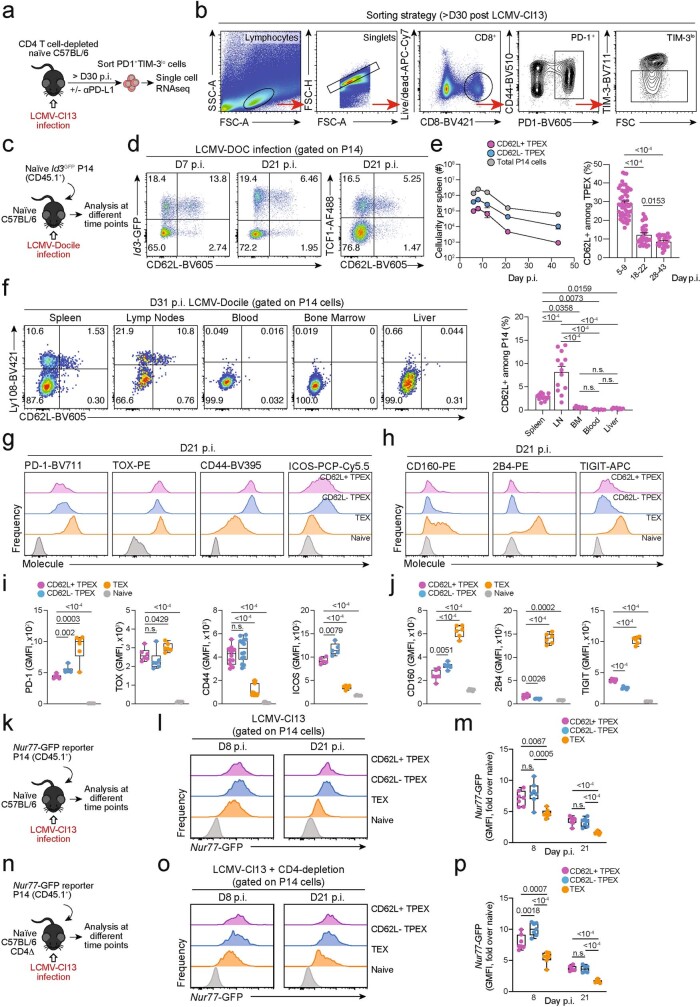
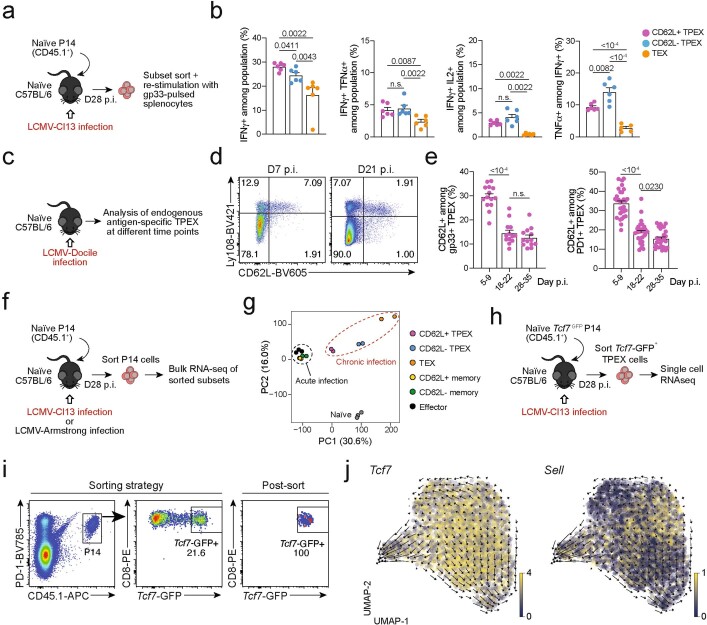
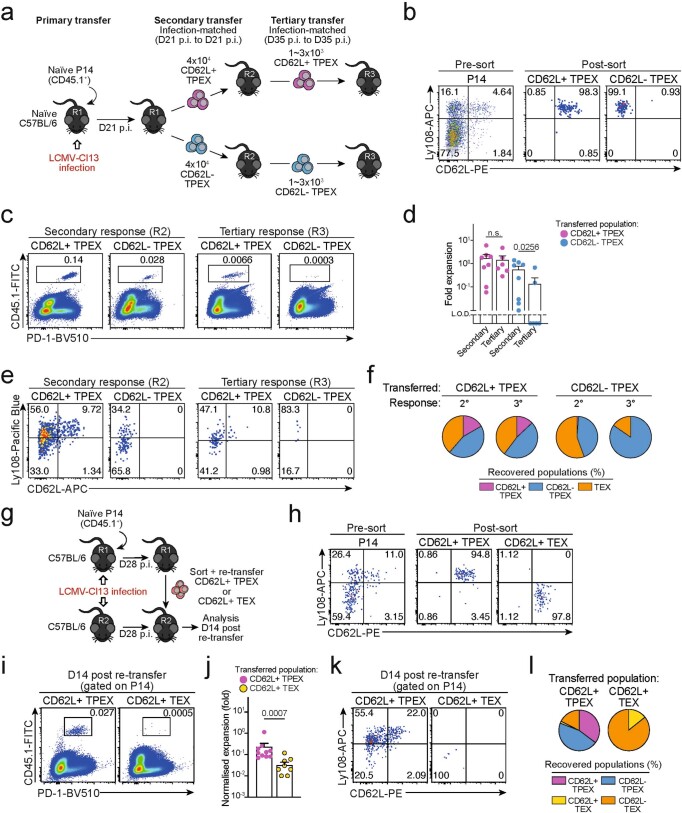
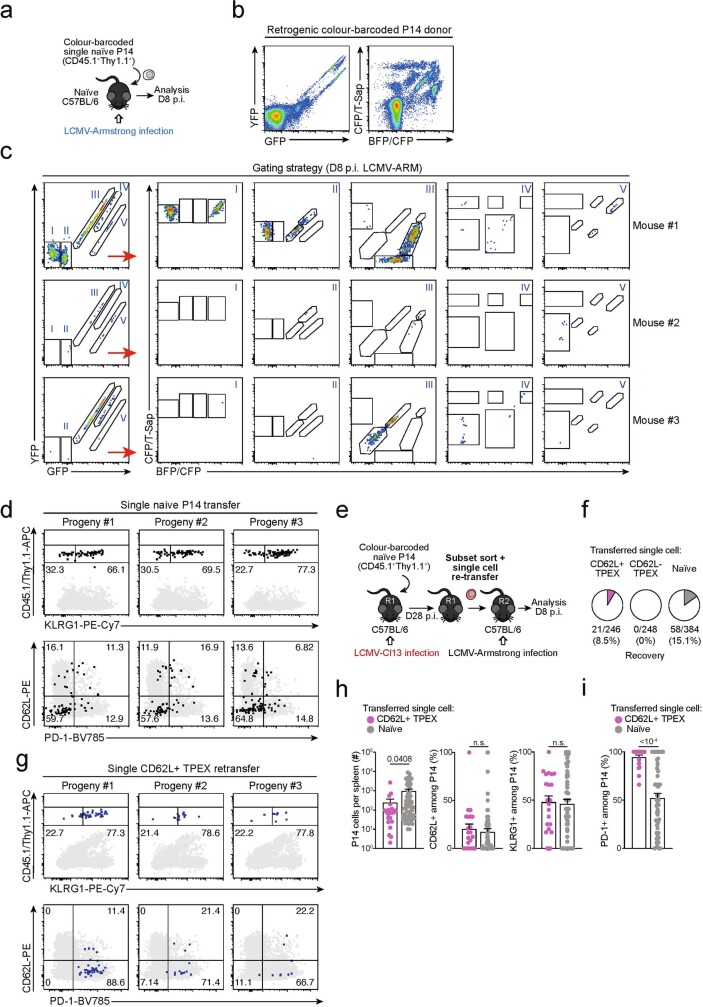
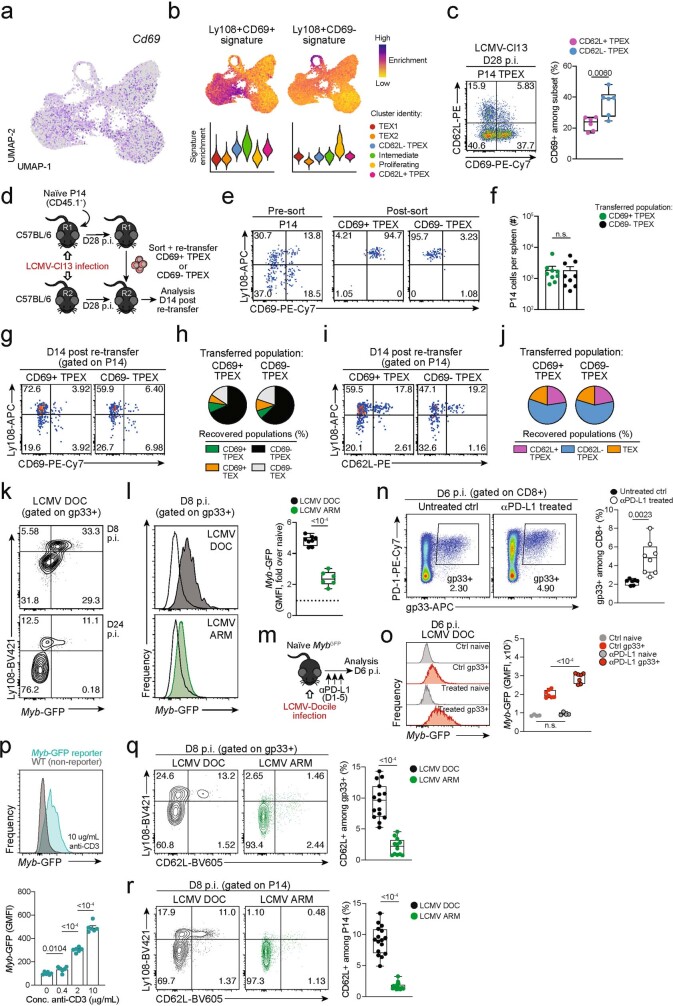
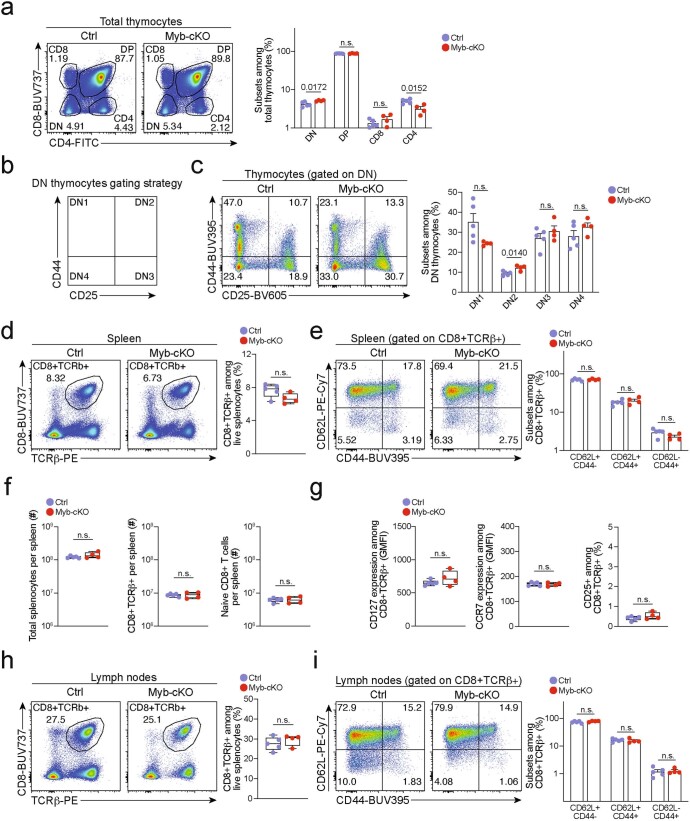
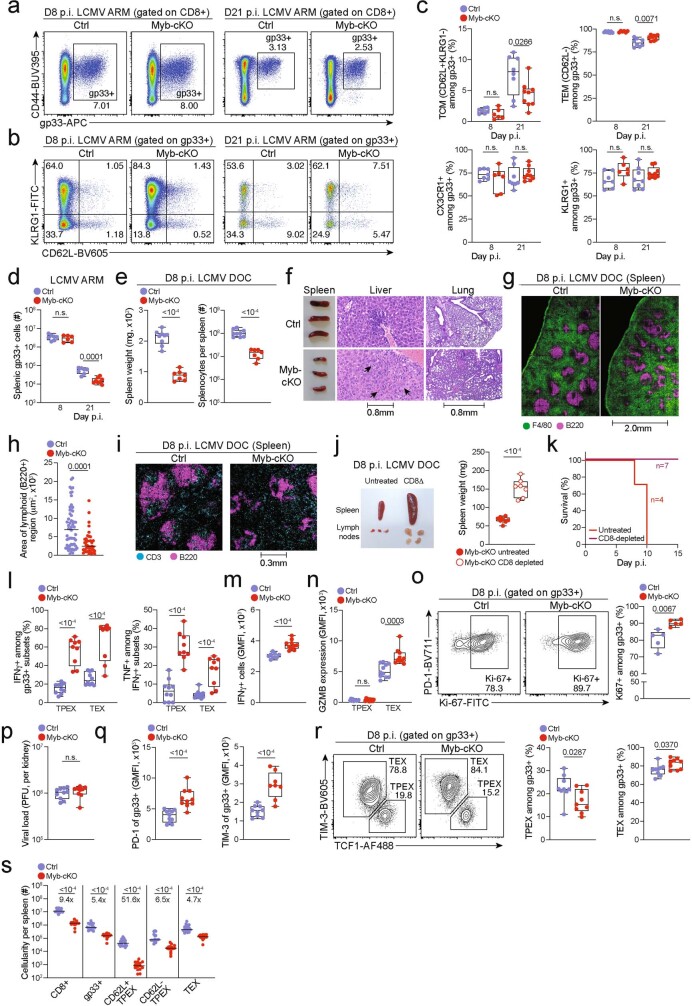
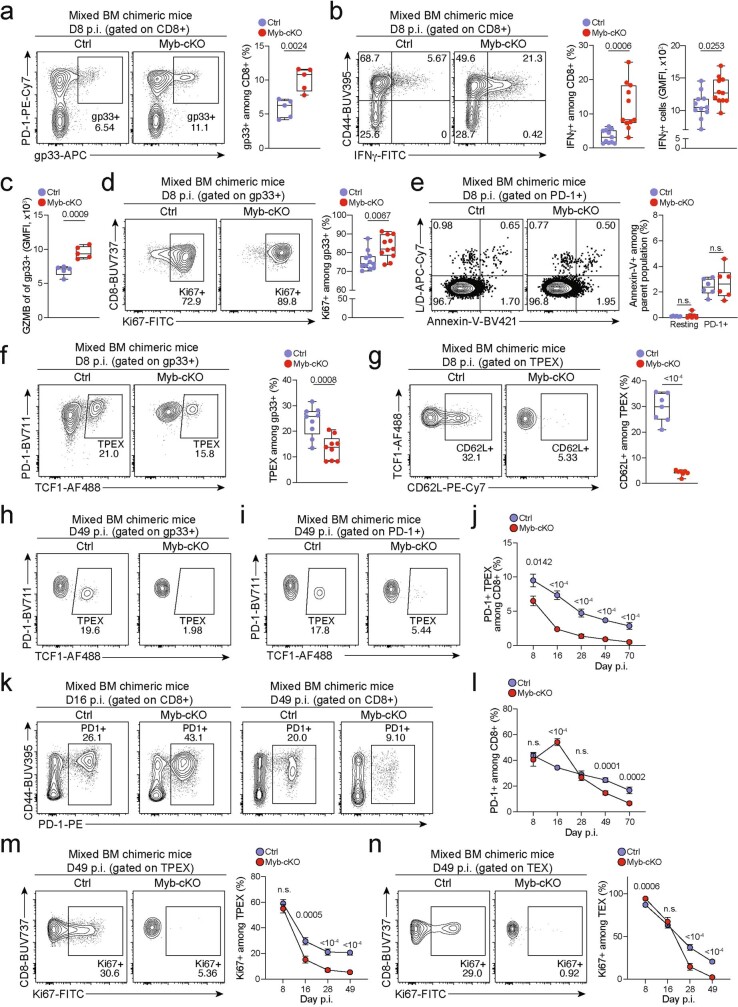
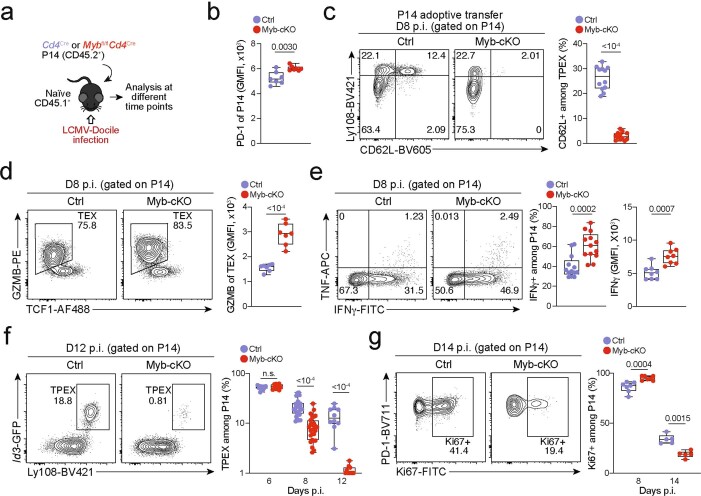
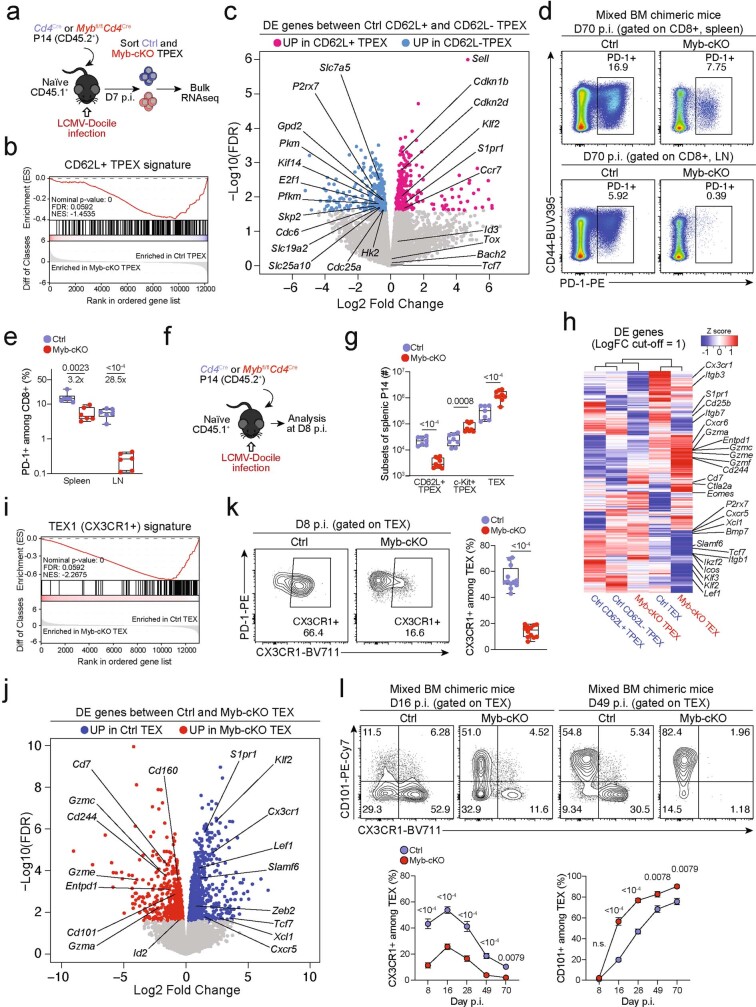
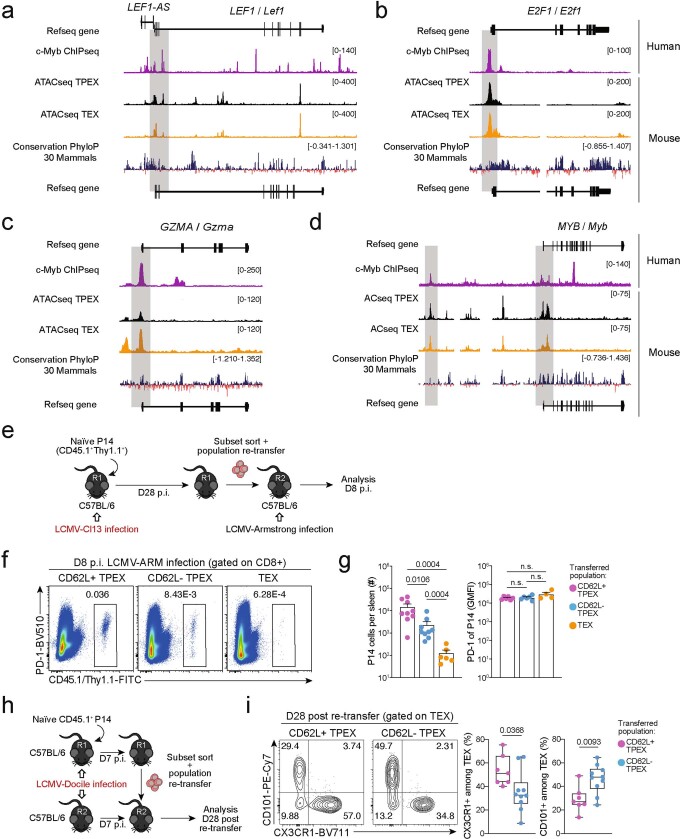
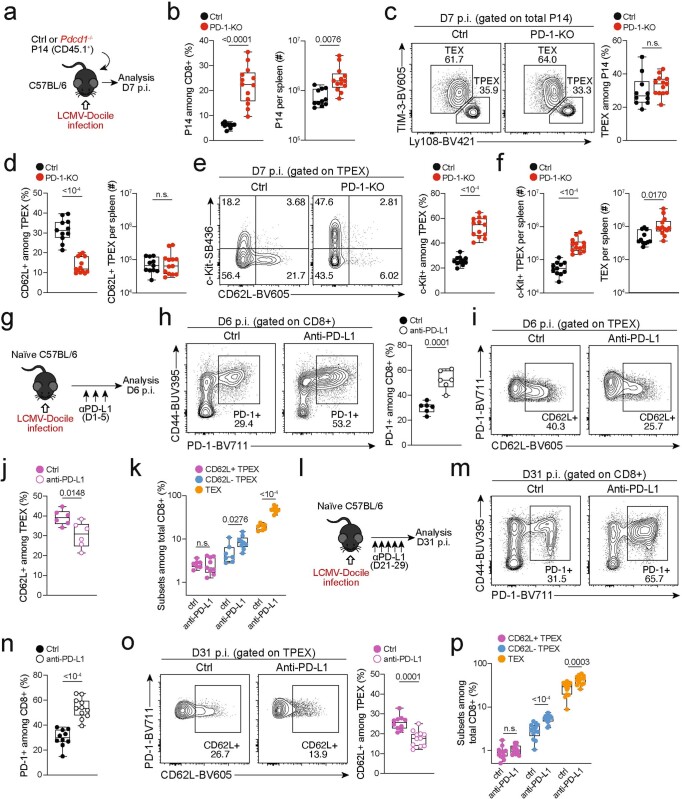
CD8+ T cells that respond to chronic viral infections or cancer are characterized by the expression of inhibitory receptors such as programmed cell death protein 1 (PD-1) and by the impaired production of cytokines. This state of restrained functionality-which is referred to as T cell exhaustion1,2-is maintained by precursors of exhausted T (TPEX) cells that express the transcription factor T cell factor 1 (TCF1), self-renew and give rise to TCF1- exhausted effector T cells3-6. Here we show that the long-term proliferative potential, multipotency and repopulation capacity of exhausted T cells during chronic infection are selectively preserved in a small population of transcriptionally distinct CD62L+ TPEX cells. The transcription factor MYB is not only essential for the development of CD62L+ TPEX cells and maintenance of the antiviral CD8+ T cell response, but also induces functional exhaustion and thereby prevents lethal immunopathology. Furthermore, the proliferative burst in response to PD-1 checkpoint inhibition originates exclusively from CD62L+ TPEX cells and depends on MYB. Our findings identify CD62L+ TPEX cells as a stem-like population that is central to the maintenance of long-term antiviral immunity and responsiveness to immunotherapy. Moreover, they show that MYB is a transcriptional orchestrator of two fundamental aspects of exhausted T cell responses: the downregulation of effector function and the long-term preservation of self-renewal capacity.


Conflict of interest statement

The authors declare no competing interests.

Figures

Fig. 1
Fig. 1. CD62L marks transcriptionally distinct and functionally superior TPEX cells during chronic infection.
ac, Naive wild-type mice were infected with LCMV-Cl13 and TPEX-cell-enriched (PD-1+TIM-3lo) CD8+ T cells were sorted and subjected to scRNA-seq at 30 dpi. The resulting data were combined with publicly available scRNA-seq datasets from mouse exhausted CD8+ T cells, and analysed. a, Uniform manifold approximation and projection (UMAP) plot of 15,743 single exhausted T cells coloured according to cluster classification. b, Normalized gene expression of Tcf7, Sell, Gzmb and Cx3cr1 projected onto the UMAP. c, Heat map showing the expression of all identified cluster signature transcripts. d, Congenically marked naive P14 cells were transferred into recipient mice, which were subsequently infected with LCMV-Docile and analysed at 21 dpi. Flow cytometry plots show the expression of PD-1, Ly108 and CD62L in splenic P14 T cells. e, UMAP plot showing two predicted developmental trajectories generated using Slingshot analysis. Cells are colour-coded on the basis of pseudotime prediction. fk, Congenically marked naive P14 T cells were transferred into primary recipient (R1) mice, which were then infected with LCMV-Cl13. The indicated subsets of P14 T cells were sorted at 28 dpi and 3 × 103–15 × 103 cells were re-transferred to infection-matched secondary recipient (R2) mice. Splenic P14 T cells of R2 mice were analysed at day 21 after re-transfer. f, Schematic of the experimental set-up. g,h, Flow cytometry plots (g) and cell numbers (h) of recovered progenies at day 21 after re-transfer (gated on CD4CD19 cells). ik, Flow cytometry plots (i), numbers (j) and average percentages (k) of recovered CD62L+ TPEX, CD62L TPEX and TEX cells per spleen in R2 mice. Cells were gated on P14 cells (day 21 after re-transfer). Dots in graphs represent individual mice (h,j); horizontal lines and error bars of bar graphs indicate mean and s.e.m., respectively. Data are representative of at least two independent experiments. P values are from Mann–Whitney tests (h,j); P > 0.05, not significant (NS). Source data
Fig. 2
Fig. 2. The transcription factor MYB is required for the generation of CD62L+ TPEX cells and the functional exhaustion of T cells during chronic infection.
a, Normalized gene expression of Myb projected onto the UMAP plot. b, Violin plots showing normalized expression of Sell and Myb. c, MybGFP reporter mice were infected with LCMV-Docile and splenic CD8+ T cells were analysed at the indicated time points after infection. Left, representative flow cytometry plots showing the expression of CD62L and Myb–GFP among naive (CD44lo) and gp33+ CD8+ T cells. Right, quantification showing the geometric mean fluorescence intensity (GMFI) of Myb–GFP among CD62L+ TPEX, CD62L TPEX and TEX cells as fold change over naive CD8+ T cells. dj, Mybfl/flCd4Cre (Myb-cKO) and littermate Mybfl/fl control (Ctrl) mice were infected with either LCMV-Armstrong (LCMV-Arm) or LCMV-Docile (LCMV-Doc). d, Schematic of the experimental set-up. eh, Survival curves of Myb-cKO and control mice and box plots showing the frequencies of gp33+CD8+ T cells at the indicated time points after infection with LCMV-Armstrong (e,f) or LCMV-Docile (g,h). i,j, Flow cytometry plots and quantification showing the expression of IFNγ and TNF after gp33 peptide restimulation (i) and the frequencies of CD62L+ TPEX cells (j). Cells were gated on gp33+ cells; 8 dpi. kn, Mixed bone marrow chimeric mice containing Myb-cKO and Cd4Cre control T cells were infected with LCMV-Docile and analysed at the indicated time points. k, Schematic of the experimental set-up. ln, Quantifications show the frequencies of gp33+ TPEX cells (l), Ki67+ cells (m) and gp33+ cells (n). Dots represent individual mice; symbols and error bars represent mean and s.e.m., respectively; box plots indicate minimum and maximum values (whiskers), interquartile range (box limits) and median (centre line). Data are representative of all analysed mice (e,g), two (c,f,i,j,ln) or three independent experiments (h). P values are from two-tailed unpaired t-tests (c,f,hj) and Mann–Whitney tests (ln). Source data
Fig. 3
Fig. 3. MYB regulates the expression of genes that are critical for the function and maintenance of exhausted T cells.
ac, Congenically marked Mybfl/flCd4Cre (Myb-cKO) and Cd4Cre (control) P14 T cells were adoptively transferred into naive recipient mice, which were then infected with LCMV-Docile. Splenic P14 subsets were sorted at 7 dpi and processed for bulk RNA-seq. a, Schematic of the experimental set-up. b, Sample dendrogram and three-dimensional scaling plot of all the samples. logFC, log-transformed fold change. c, Volcano plot highlighting genes that are differentially expressed (false discovery rate (FDR) < 0.15) between Myb-cKO TPEX and control CD62L TPEX cells, with genes of interest annotated. d, Flow cytometry plots and quantification show the frequencies of KIT+ cells among control and Myb-cKO TPEX P14 T cells at day 8 after infection with LCMV-Docile (gated on TPEX cells). e,f, Tracks show MYB chromatin immunoprecipitation followed by sequencing (ChIP–seq) peaks in the TCF7 (e) and KIT (f) gene loci of human Jurkat T cells and assay for transposase-accessible chromatin using sequencing (ATAC-seq) peaks of TPEX and TEX cells in the corresponding mouse gene loci aligned according to sequence conservation. Dots in graph represent individual mice; box plots indicate minimum and maximum values (whiskers), interquartile range (box limits) and median (centre line). Data are representative of two independent experiments (d). P values are from two-tailed unpaired t-tests (d). Source data
Fig. 4
Fig. 4. CD62L+ TPEX cells show enhanced potential for effector cell generation and selectively mediate responsiveness to PD-1 checkpoint blocking therapy.
a,b, Congenically marked naive P14 T cells were transferred into primary recipient (R1) mice, which were subsequently infected with LCMV-Cl13. Exhausted T cell subsets were sorted at 28 dpi and 1.0 × 104–2.5 × 104 cells or no cells (Nil) were re-transferred into secondary Tcra−/ recipient (R2) mice. Splenic P14 T cells of R2 mice were analysed 8 days after infection with LCMV-Armstrong. a, Schematic of the experimental set-up. b, Numbers of recovered P14 T cells (left), percentages of KLRG1+ (middle) and splenic viral loads (right). PFU, plaque-forming units. ce, Congenically marked naive P14 T cells were transferred into CD4-depleted R1 mice, which were subsequently infected with LCMV-Cl13. Exhausted T cell subsets were sorted at 28 dpi and re-transferred to infection-matched CD4-depleted (CD4 Δ) R2 mice, treated with anti-PD-L1 antibodies or phosphate-buffered saline (PBS) on days 1, 4, 7, 10 and 13 and analysed at day 14 after re-transfer. c, Schematic of the experimental set-up. d, Representative flow cytometry plots of splenic progeny derived from transferred T cell subsets after treatment with anti-PD-L1, at day 14 after re-transfer (cells were gated on CD4CD19PD-1+ cells). Box plots show the relative progeny expansion in anti-PD-L1-treated versus PBS-treated mice (left) and the numbers of CD62L+ TPEX cells among progeny after anti-PD-L1 treatment (right). e, Average subset distribution. fh, Mixed bone marrow chimeric mice containing congenically marked Myb-cKO and Cd4Cre (control) T cells, infected with LCMV-Docile, were treated with anti-PD-L1 on days 33, 36, 39, 42 and 45 and analysed at 49 dpi. f, Schematic of the experimental set-up. g,h, Representative flow cytometry plots (g) and box plot (h) showing the fold change of frequencies of splenic polyclonal PD1+CD8+ T cells in anti-PD-L1-treated versus PBS-treated mice. Cells were gated on CD8+ cells; 49 dpi. Dots in graphs represent individual mice; box plots indicate minimum and maximum values (whiskers), interquartile range (box limits) and median (centre line); horizontal lines and error bars of bar graphs indicate mean and s.e.m., respectively. Data are representative of at least two independent experiments (b,d–e,gh). P values are from two-tailed unpaired t-tests (b (middle), h) and Mann–Whitney tests (b (left, right, d). Source data
Extended Data Fig. 1
Extended Data Fig. 1. Isolation of polyclonal exhausted T cells for scRNA-seq and phenotypic characterization of CD62L+ TPEX cells in chronic infection.
(a, b) CD4+ T cell-depleted naive mice were infected with LCMV-Cl13, treated with or without anti-PD-L1, and exhausted PD-1+TIM-3lo T cells were sorted at >day 30 post-infection as described. (a) Schematic of the experimental set-up. (b) Flow cytometry plots showing the sorting strategy. (c–j) Naive congenically marked (CD45.1+) Id3-GFP P14 cells were transferred to naive recipients (Ly.5.2), which were then infected with LCMV-Docile. Splenic P14 T cells were analysed at the indicated time points after infection. (c) Schematic of the experimental set-up. (d) Flow cytometry plots showing the expression of Id3-GFP, TCF1 and CD62L among splenic P14 T cells at 7 and 21 dpi. (e) Quantification showing absolute numbers of splenic CD62L+ TPEX, CD62L TPEX and total P14 cells (left) and frequencies of CD62L+ cells among TPEX cells (right) at the indicated time points after infection (f) Flow cytometry plots showing the expression of Ly108 and CD62L and quantification of CD62L+ TPEX cells among P14 T cells in the spleen, lymph nodes, blood, bone marrow and liver at day 31 post LCMV-Docile infection. (g–j) Histograms (g, h) and quantification (i, j) of expression of molecules as indicated in P14 T cell subsets and naive CD8+ T cells. (k–p) Congenically marked naive Nur77-GFP reporter P14 T cells were transferred into naive (k–m) or CD4-T-cell-depleted (n–p) recipient mice, which were subsequently infected with LCMV-Cl13. Nur77-GFP expression was analysed at indicated time points post-infection. (k, n) Schematics of the experimental set-up. Histograms (l, o) and quantifications (m, p) showing Nur77-GFP expression in the indicated P14 T cell subsets at 8 and 21 dpi. GMFI, geometric mean fluorescence intensity. Dots in graphs represent individual mice; box plots indicate range, interquartile and median; horizontal lines and error bars of bar graphs indicate mean and s.e.m. Data are representative of two independent experiments (e, f, i, j) and all analysed mice (m, p). P values are from two-tailed unpaired t-tests (e, i, j), two-way ANOVA (f), and one-way ANOVA (m, p); P > 0.05, not significant (n.s.). Source data
Extended Data Fig. 2
Extended Data Fig. 2. Functional and transcriptional profiling of exhausted T cell subsets and RNA velocity analysis showing that differentiation streams originate from CD62L+ TPEX cells.
(a, b) Congenically marked naive P14 T cells were adoptively transferred into naive recipient mice, which were then infected with LCMV-Cl13. Splenic P14 T cells from each group were sorted at day 28 post-infection and restimulated independently using gp33-pulsed splenocytes in vitro. (a) Schematic of the experimental set-up. (b) Quantifications showing cytokine production of each subset after restimulation. (c–e) Wild-type mice were infected with LCMV-Docile and splenic CD8+ T cells were analysed at the indicated time points after infection. (c) Schematic of the experimental set-up. (d) Flow cytometry plots showing the expression of CD62L in TPEX (Ly108hi) and TEX (Ly108lo) cells among endogenous gp33-specific CD8+ T cells. (e) Quantification showing the proportions of CD62L-expressing cells among gp33+ TPEX cells (left) and polyclonal PD-1+ TPEX cells (right) at the indicated time points after infection (f, g) Congenically marked naive P14 T cells were adoptively transferred into naive recipient mice, which were then infected with LCMV-Cl13 or LCMV-Armstrong. Splenic P14 compartments from each group were sorted at 28 dpi and processed for bulk RNA-seq. (f) Schematic of the experimental set-up. (g) Principal component plot showing the transcriptional landscapes of sorted populations as indicated. (h–j) Congenically marked naive Tcf7-GFP P14 T cells were adoptively transferred into naive mice, which were then infected with LCMV-Cl13. P14 TPEX cells were sorted at day 28 post-infection based on the expression of Tcf7-GFP. (h) Schematic of the experimental set-up. (i) Flow cytometry plots showing the sorting strategy and post-sort purity. (j) RNA velocity analysis showing developmental trajectories of TPEX cells, together with the expression of Tcf7 (left) and Sell (right). Horizontal lines and error bars of bar graphs indicate mean and s.e.m., respectively. Data are representative of two independent experiments (b) and all analysed mice (e). P values are from Mann–Whitney tests (b) and two-tailed unpaired t-tests (e); P > 0.05, not significant (n.s.). Source data
Extended Data Fig. 3
Extended Data Fig. 3. Capacity for self-renewal and multipotent differentiation is restricted to the CD62L+ TPEX cell compartment.
(a–f) Congenically marked naive P14 T cells were transferred into primary recipient mice (R1), which were then infected with LCMV-Cl13. The indicated subsets of P14 T cells were sorted at 21 dpi and 4×10⁴ cells were re-transferred to infection-matched secondary recipient mice (R2). The indicated subsets of P14 T cells were sorted from R2 mice at 35 dpi and 1~3×10³ cells were re-transferred to infection-matched tertiary recipient mice (R3). Splenic P14 T cells of R3 mice were analysed at day 14 post re-transfer. (a) Schematic of the experimental set-up. (b) Representative flow cytometry plots showing the sorting strategy and post-sort purities. Flow cytometry plots (c) and calculated fold expansion (d) of recovered P14 progenies at day 14 after secondary and tertiary re-transfers. Flow cytometry plots and quantifications showing expression of Ly108 and CD62L of splenic P14 cells in R2 and R3 mice (e) and average percentages of recovered CD62L+ TPEX, CD62L TPEX and TEX cells per spleen in R2 and R3 mice (f) at day 14 post re-transfer, respectively. (g–l) Congenically marked naive P14 T cells were transferred into primary recipient mice (R1), which were then infected with LCMV-Cl13. The indicated subsets of P14 T cells were sorted at 28 dpi and 3–30 x 103 cells were re-transferred to infection-matched secondary recipient mice (R2). Splenic P14 T cells of R2 mice were analysed at day 14 post re-transfer. Of note, maximum cell numbers attainable for each subset were transferred to allow for reliable evaluation of phenotypic diversification in expanded progenies. Fold expansion of recovered progenies was then normalized to distinct input numbers. (g) Schematic of the experimental set-up. (h) Representative flow cytometry plots showing the sorting strategy and post-sort purities. Flow cytometry plots (i) and fold expansion (j) of recovered progenies at day 14 post re-transfer. Flow cytometry plots and quantifications showing expression of Ly108 and CD62L of splenic P14 cells of R2 mice (k) and average percentages of recovered CD62L+ TPEX, CD62L TPEX, CD62L+ TEX and CD62L TEX cells per spleen (l) in R2 mice at day 14 post re-transfer. Dots in graphs represent individual mice; horizontal lines and error bars of bar graphs indicate mean and s.e.m., respectively. Data are representative of two independent experiments (b, c, e, h, i, k) and all analysed mice (d, f, j, l). P values are from Mann–Whitney tests (d, j); P > 0.05, not significant (n.s.). Source data
Extended Data Fig. 4
Extended Data Fig. 4. Single CD62L+ TPEX cells show a stem-like capacity for self-renewal and multipotent differentiation.
(a–d) Single naive colour-barcoded P14 T cells were transferred to primary recipient mice, which were then infected with LCMV-Armstrong. Splenic P14 T cells were analysed at day 8 post LCMV-Armstrong infection. (a) Schematic of the experimental set-up for the naive P14 single-cell transfer. (b) Flow cytometry plots showing expression of GFP and YFP (left) or BFP/CFP and CFP/T-Sap (right) in peripheral blood of retrogenic P14 donor mice (pre-gated on CD8+CD44loCD45.1+). (c) Tracking of colour-barcoded single-cell-derived progenies at 8 dpi in the spleens of three representative recipient mice. Recovered progenies were distinguished according to their combinatorial expression of GFP and YFP into populations I, II, III, IV and V, which were further subdivided by their expression of T-Sapphire, CFP, and BFP into progenies characterized by their unique combinatorial colour barcode. Note: in the display used, CFP emission appears on the diagonal between the BFP (x-axis) and T-Sapphire signal (y-axis) and is therefore indicated on both axes. (d) Flow cytometry plots depicting combined staining of CD45.1 and Thy1.1 with KLRG1 (upper row), or CD62L with PD-1 (lower row) for three progenies derived from adoptively transferred single naive P14 cells (grey: endogenous CD4CD19 cells). (e–i) Colour-barcoded naive P14 T cells were transferred into primary recipient mice (R1), which were subsequently infected with LCMV-Cl13. P14 T cells were sorted at 28 dpi and single CD62L+ or CD62L TPEX cells were re-transferred into naive secondary recipient mice (R2), which were subsequently infected with LCMV-Armstrong. Splenic P14 T cells were analysed at day 8 post LCMV-Armstrong infection. (e) Schematic of the experimental set-up. (f) Percentages of transferred single cells of CD62L+ TPEX, CD62L TPEX cell or naive phenotype from which progenies were recovered at 8 dpi. (g) As in (d), but for adoptively re-transferred single CD62L+ TPEX cells. (h) Size of single-T-cell-derived progenies and frequencies of CD62L+, KLRG1+ and (i) PD-1+ cells therein. Dots in graphs represent individual clones derived from a single transferred cell. Horizontal lines and error bars of bar graphs indicate mean and s.e.m., respectively. Data show all analysed mice (h, i). P values are from Mann–Whitney tests (h–i); P > 0.05, not significant (n.s.). Source data
Extended Data Fig. 5
Extended Data Fig. 5. CD69 expression in TPEX cells does not correlate with CD62L expression and does not predict developmental and repopulation potential; chronic LCMV infection and strong TCR stimuli favour MYB expression and the formation of stem-like CD62L+ TPEX cells.
(a) Normalized expression of Cd69 projected on the UMAP of scRNA-seq data as in Fig. 1. (b) Enrichment of Ly108+CD69+ (“TEX prog1”) and Ly108+CD69 (“TEX prog2”) signatures at single-cell and cluster levels. (c) Flow cytometry plots and quantification showing CD69 expression in CD62L+ and CD62L P14 TPEX cells on day 28 post LCMV-Cl13 infection. (d–j) Congenically marked naive P14 T cells were transferred into primary recipient mice (R1), which were then infected with LCMV-Cl13. The indicated subsets of P14 T cells were sorted at 28 dpi and re-transferred to infection-matched secondary recipient mice (R2). Splenic P14 T cells of R2 mice were analysed at day 14 post re-transfer. (d) Schematic of the experimental set-up. (e) Representative flow cytometry plots showing the sorting strategy and post-sort purities. (f) Quantification of recovered P14 cells at day 14 post re-transfer. (g) Flow cytometry plots and quantifications showing expression of Ly108 and CD69 of splenic P14 cells of R2 mice and (h) average percentages of recovered CD69+ TPEX, CD69 TPEX, CD69+ TEX and CD69 TEX cells per spleen in R2 mice at day 14 post re-transfer. (i) Flow cytometry plots and quantifications showing expression of Ly108 and CD62L of splenic P14 cells of R2 mice and (j) average percentages of recovered CD62L+ TPEX, CD62L TPEX and TEX cells per spleen in R2 mice at day 14 post re-transfer. (k-l) Naive MybGFP reporter mice were infected with either LCMV-Docile or LCMV-Armstrong and CD8+ T cells were analysed at the indicated time points after infection. (k) Representative flow cytometry plots depict Ly108 and Myb-GFP expression among antigen-specific (gp33+) CD8+ T cells. (l) Histograms (filled) show Myb-GFP expression of gp33+ CD8+ T cells in mice infected with LCMV-Docile (top) and LCMV-Armstrong (bottom). Empty histograms depict Myb-GFP expression in naive CD8+ T cells in the same samples. Corresponding quantification show the fold change of geometric mean fluorescence intensity (GMFI) of Myb-GFP in the indicated populations. (m–o) LCMV-Docile-infected MybGFP reporter mice were treated with or without anti-PD-L1. Splenic CD8+ T cells were analysed at 6 dpi. (m) Schematic of the experimental set-up. (n) Flow cytometry plots and quantification showing frequencies of splenic gp33+ CD8+ T cells in anti-PD-L1-treated and untreated control mice at 6 dpi. (o) Histograms showing Myb-GFP expression of gp33+ and naive (gated on CD62L+CD44) CD8+ T cells in the same mice. (p) Naive MybGFP and wild-type (non-reporter, control) CD8+ T cells were stimulated and cultured in vitro using plate-bound anti-CD3. Representative histogram and normalized quantification show GMFI of Myb-GFP expression in CD8+ T cells stimulated with plate-bound anti-CD3 at the indicated concentrations. (q) Flow cytometry plots and quantification show the frequencies of Ly108+ and CD62L+ cells among splenic antigen-specific (gp33+) T cells in wild-type mice at day 8 post LCMV-Docile or LCMV-Armstrong infection. (r) Congenically marked P14 T cells were adoptively transferred into naive recipient mice, which were then infected with either LCMV-Docile or LCMV-Armstrong. Splenic P14 T cells were analysed at 8 dpi. Flow cytometry plots and quantification show the frequencies of Ly108+ and CD62L+ cells among splenic P14 T cells. Dots in graphs represent individual mice (c, f, l, o, q, r) and individual wells (p); box plots indicate range, interquartile and median; horizontal lines and error bars in indicate mean and s.e.m., respectively. Data are representative of two independent experiments (c, l, o, p) and all analysed mice (f, q, r). P values are from two-tailed unpaired t-tests (c, l, o–r) and Mann–Whitney tests (f); P > 0.05, not significant (n.s.). Source data
Extended Data Fig. 6
Extended Data Fig. 6. Development of mature CD8+ T cells is largely normal in Mybfl/flCd4Cre mice.
Adult 8-12 weeks Mybfl/flCd4Cre (Myb-cKO) and littermate Mybfl/fl control (Ctrl) mice were euthanized, and T cell populations were analysed in the thymus, spleen and lymph nodes. Flow cytometry and quantifications showing (a–c) frequencies of thymocyte subsets, (d–f) frequencies and abundance of mature splenic CD8+ T cells, (g) surface expression of CD127 (IL-7R), CCR7 and CD25 (IL-2R) of splenic CD8+ T cells and (h, i) frequencies of mature CD8+ T cells residing in lymph nodes. (h). Dots in graphs represent individual mice; box plots indicate range, interquartile and median. All data are representative of two independent experiments. P values are from two-tailed unpaired t-tests (d, f–h) and Mann–Whitney tests (a, c, e, i); P > 0.05, not significant (n.s.). Source data
Extended Data Fig. 7
Extended Data Fig. 7. MYB is required to limit CD8+ T cell expansion and cytotoxicity in response to chronic infection.
(a–s) Mybfl/flCd4Cre (Myb-cKO) mice and littermate Mybfl/fl control mice (Ctrl) were infected with either LCMV-Armstrong (a–d) or LCMV-Docile (e–s). (a–b) Flow cytometry plots showing (a) splenic antigen-specific (gp33+) CD8+ cells and (b) expression of CD62L and KLRG1 among antigen-specific cells in Myb-cKO and control mice at indicated time points post LCMV-Armstrong infection. (c) Quantification of central memory (TCM), effector memory (TEM), CX3CR1+ and KLRG1+ cells among gp33+ CD8+ cells in Myb-cKO and control mice at indicated time points post LCMV-Armstrong infection. (d) Numbers of splenic gp33+CD8+ T cells in Myb-cKO and control mice at indicated time points post LCMV-Armstrong infection. (e) Box plots showing the weights of spleens (left) and the total numbers of splenocytes (right) in Myb-cKO and control mice at day 8 post LCMV-Docile infection. (f) Spleen size (left) and haematoxylin and eosin staining of sections showing infiltration of immune cells (arrows) in livers (middle) and lungs (right) in Myb-cKO and control mice at 8 dpi. (g) Confocal images of F4/80 and B220 expression in frozen spleen sections and (h) quantification showing the cellular organization and area of lymphoid regions in Myb-cKO and control mice at day 8 post LCMV-Docile infection. (i) Confocal images of CD3 and B220 expression in frozen spleen sections showing the distribution of B and T cells in the spleens of Myb-cKO and control mice at day 8 post LCMV-Docile infection. (j) Image and box plot showing the size and weights of spleens in untreated and CD8+ T-cell-depleted Myb-cKO mice at day 8 post LCMV-Docile infection. (k) Survival curve of CD8-depleted Myb-cKO mice post LCMV-Docile infection. (l) Proportion of cytokine-producing antigen-specific TPEX and TEX cell subsets after gp33 peptide restimulation of Myb-cKO and control mice at day 8 post LCMV-Docile infection. (m, n) Quantification of IFNγ expression (m), and granzyme B (GZMB) expression in TPEX and TEX cells (n) in Myb-cKO and control mice at day 8 post LCMV-Docile infection. (o) Flow cytometry plots and quantification showing the proportions of Ki67+ within the gp33+ compartment in Myb-cKO and control mice at day 8 post LCMV-Docile infection. (p) Box plots showing viral titres in the kidneys of Myb-cKO and control mice at day 8 post LCMV-Docile infection. (q) Box plots showing the expression of PD-1 (left) and TIM-3 (right) among gp33+ CD8+ T cells of control and Myb-cKO mice at day 8 post LCMV-Docile infection. (r) Flow cytometry plots and quantification show the frequencies of TPEX cells (TCF1+TIM-3) and TEX cells (TCF1-TIM-3+) among splenic gp33+ CD8+ T cells of Myb-cKO and control mice. (s) Quantification showing the absolute numbers of splenic CD8+, gp33+, CD62L+ TPEX, CD62L TPEX and TEX cells in Myb-cKO and control mice at day 8 post LCMV-Docile infection. GMFI, geometric mean fluorescence intensity. Dots in graphs represent individual mice; box plots indicate range, interquartile and median; horizontal lines in (h) indicate median. Data are representative of two independent experiments (c–e, k–r) or all mice (j, s) and images (h) analysed; P > 0.05, not significant (n.s.). Source data
Extended Data Fig. 8
Extended Data Fig. 8. MYB limits CD8+ T cell expansion and cytotoxicity during chronic infection in a cell-intrinsic manner.
(a–n) Naive CD45.1 mice were lethally irradiated and reconstituted using a mixture of Mybfl/flCd4Cre (Myb-cKO) and Cd4Cre or littermate Mybfl/fl control (Ctrl) bone marrow. Chimeric mice were subsequently infected with LCMV-Docile and analysed at the indicated time points after infection. Quantification showing the frequencies of (a) polyclonal antigen-specific gp33+ cells among Myb-cKO and control CD8+ T cells at 8 dpi. (b) Flow cytometry plots and quantification of IFNγ+ cells among Myb-cKO and control CD8+ T cells after peptide restimulation in vitro at 8 dpi. (c) Quantification of GZMB expression among gp33+ cells of the indicated genotypes. (d, e) Flow cytometry plots and quantification showing the frequencies of (d) Ki67+ cells and (e) annexin-V+ cells among Myb-cKO and control antigen-responsive CD8+ T cells. (f, g) Flow cytometry plots and quantification showing the frequencies of TCF1+ TPEX cells among antigen-specific T cells (f) and CD62L+ cells among TPEX cells (g) in Myb-cKO and control compartments at 8 dpi. (h) Flow cytometry plots showing the frequencies of TPEX cells among gp33+ cells at 49 dpi. (i–j) Flow cytometry plots (i) and quantification (j) showing kinetics of splenic polyclonal PD-1+ TPEX cells among Myb-cKO and control CD8+ T cells after infection. (k–l) Flow cytometry plots (k) and quantification (l) showing the frequencies of the entire antigen-responsive PD-1+ cell compartment among Myb-cKO and control CD8+ T cells at indicated time points after infection. (m, n) Flow cytometry plots and quantifications showing the frequencies of Ki67+ cells among Myb-cKO and control polyclonal TPEX (m) and TEX (n) cells at indicated time points after infection. GMFI, geometric mean fluorescence intensity. Dots in graphs represent individual mice; box plots indicate range, interquartile and median. Symbols and error bars represent mean and s.e.m., respectively. All data are representative of two independent experiments. P values are from two-tailed unpaired t-tests (a–g) and Mann–Whitney tests (j–n); P > 0.05, not significant (n.s.). Source data
Extended Data Fig. 9
Extended Data Fig. 9. MYB limits proliferation and cytotoxicity and sustains the long-term self-renewal of exhausted CD8+ T cells.
(a–g) Congenically marked naive control (Cd4Cre) and Mybfl/flCd4Cre (Myb-cKO) P14 T cells were adoptively transferred into naive recipient mice, which were subsequently infected with LCMV-Docile. Splenic P14 T cells were analysed at indicated time points post-infection (p.i). (a) Schematic of the experimental set-up. (b) Box plot showing PD-1 expression of transferred P14 cells at 8 dpi. (c) Flow cytometry plots and quantification showing frequencies of CD62L+ cells among Myb-cKO and control P14 TPEX cells. (d) Flow cytometry plots and quantification showing the expression of granzyme B (GZMB) in Myb-cKO and control TEX P14 cells at 8 dpi. (e) Flow cytometry plots and quantifications showing the production of cytokines as indicated from Myb-cKO and control P14 T cells after gp33 peptide restimulation at 8 dpi. (f) Flow cytometry plots and quantification showing the frequencies of TPEX cells among Myb-cKO and control P14 T cells at the indicated time points after infection. (g) Flow cytometry plots and quantification showing the frequencies of Ki67+ cells among Myb-cKO and control P14 T cells at indicated time points after infection. GMFI, geometric mean fluorescence intensity. Dots in graphs represent individual mice; box plots indicate range, interquartile and median; Data are representative of two independent experiments (b–g). P values are from two-tailed unpaired t-tests; P > 0.05, not significant (n.s.). Source data
Extended Data Fig. 10
Extended Data Fig. 10. MYB regulates the expression of multiple genes that are critical to exhausted T cell function and maintenance.
(a, b) Congenically marked Mybfl/flCd4Cre (Myb-cKO, CD45.2+) and Cd4Cre (Ctrl, CD45.2+ or CD45.2+CD45.1+) P14 T cells were adoptively transferred into separate naive recipient (CD45.1) mice, which were then infected with LCMV-Docile. Splenic P14 TPEX cells were sorted at day 7 post-infection and processed for bulk RNA-seq. (a) Schematic of the experimental set-up. (b) Gene set enrichment analysis showing loss of CD62L+ TPEX transcriptional signature in Myb-cKO TPEX cells compared to control TPEX cells. (c) Volcano plots highlighting genes differentially expressed (FDR < 0.15) between control CD62L+ TPEX and CD62L TPEX cells. (d–e) Mixed bone marrow chimeric mice containing congenically marked Myb-cKO and control CD8+ T cells were infected with LCMV-Docile. Flow cytometry plots (d) and quantification (e) showing the frequencies of the entire antigen-responsive PD-1+ cell compartment among Myb-cKO and control CD8+ T cells in the spleen and lymph nodes at day 70 post-infection. (f, g) Congenically marked Myb-cKO and Ctrl P14 T cells were adoptively transferred into separate naive recipient mice, which were then infected with LCMV-Docile. Splenic P14 TPEX cells were analysed at day 8 post-infection. (f) Schematic of the experimental set-up. (g) Quantification showing the abundances of the indicated P14 subsets per spleen. (h) Heat map depicting genes differentially expressed (FDR < 0.15, FC > 1) between control CD62L+ TPEX and CD62L TPEX cell or Myb-cKO and control TPEX and TEX cells, with genes of interest annotated. (i) Gene set enrichment analysis showing loss of CX3CR1+ TEX transcriptional signature in P14 Myb-cKO TEX cells compared to control TEX cells. (j) Volcano plot highlighting genes differentially expressed (FDR < 0.15) between control and Myb-cKO TEX cells with genes of interested annotated. (k) Flow cytometry plots and quantification show the frequencies of CX3CR1+ cells among control and Myb-cKO TEX P14 T cells at day 8 post LCMV-Docile infection. (l) Flow cytometry plots and quantifications showing CX3CR1 and CD101 expression in Myb-cKO and control TEX cells at the indicated time points after infection. Dots in graph represent individual mice; box plots indicate range, interquartile and median. Symbols and error bars in (l) represent mean and s.e.m., respectively Data are representative of two independent experiments (e, g, k, l). P values are from two-tailed unpaired t-tests; P > 0.05, not significant (n.s.). Source data
Extended Data Fig. 11
Extended Data Fig. 11. MYB directly regulates target gene expression, and CD62L+ TPEX cells have a superior potential to give rise to CX3CR1+ TEX cells.
(a–d) Representative tracks showing MYB ChIP–seq peaks in the LEF1 (a), E2F1 (b), GZMA (c), and MYB (d) gene loci of human Jurkat T cells and ATAC-seq peaks of TPEX and TEX cells in the corresponding mouse gene loci aligned according to the sequence conservation. (e–g) Congenically marked naive P14 cells were transferred to primary recipient mice (R1), which were subsequently infected with LCMV-Cl13. The indicated subsets of P14 cells were sorted at 28 dpi and re-transferred to naive secondary recipient mice (R2), which were then infected with LCMV-Armstrong. Splenic P14 T cells in R2 mice were analysed at 8 dpi. (e) Schematic of the experimental set-up. (f) Flow cytometry plots of progenies recovered at 8 dpi. (g) Cell numbers (left) and quantification of PD-1 expression (right) in P14 T cell populations derived from the indicated transferred subsets at 8 dpi. (h, i) Congenically marked naive P14 T cells were transferred into primary recipient mice (R1), which were then infected with LCMV-Docile. The indicated subsets of P14 T cells were sorted at 7 dpi and 7.5×10⁴ cells were re-transferred to infection-matched (LCMV-Docile) secondary recipient mice (R2). Splenic P14 T cells of R2 mice were analysed at day 28 post re-transfer. (h) Schematic of the experimental set-up. (i) Flow cytometry plots and box plots showing the frequencies of CX3CR1+ and CD101+ cells among recovered TEX cells derived from the indicated re-transferred TPEX subsets at day 28 post re-transfer. Data are representative of two independent experiments. P values are from Mann–Whitney tests (g) and two-tailed unpaired t-test (i); P > 0.05, not significant (n.s.). Source data
Extended Data Fig. 12
Extended Data Fig. 12. Effect of PD-1 signalling on CD62L+ TPEX cells.
(a–f) Congenically marked PD-1-deficient (Pdcd1−/−) and control P14 T cells were transferred to naive mice, which were subsequently infected with LCMV-Docile. Splenic P14 T cells were analysed at 7 dpi. (a) Schematic of the experimental set-up. (b) P14 T cell frequencies and numbers of indicated genotypes. (c) Flow cytometry plots and frequencies of TPEX (Ly108hiTIM-3lo) and TEX (Ly108loTIM-3hi) cells. (d) Box plots show frequencies and numbers of CD62L+ TPEX cells among control and PD-1-deficient P14 cells. Flow cytometry plots and box plots show (e) frequencies of KIT+ TPEX cells and (f) numbers of KIT+ TPEX and TEX cells per spleen. (g–k) Wild-type mice were infected with LCMV-Docile and treated with anti-PD-L1 at 200 μg/mouse at 1, 3 and 5 dpi. Splenic CD8+ T cells were analysed at 6 dpi. (g) Schematic of the experimental set-up. (h) Flow cytometry plots and quantification showing the frequencies of PD-1+ cells among splenic CD8+ T cells. (i–j) Flow cytometry plots (i) and quantification (j) showing expression of CD62L among polyclonal TPEX cells (Ly108hiTIM-3lo). (k) Quantification showing the population sizes of CD62L+ TPEX, CD62L TPEX and TEX cells among total CD8+ T cells in untreated and anti-PD-L1-treated mice. (l–p) Wild-type mice were infected with LCMV-Docile and treated with anti-PD-L1 at 200 μg/mouse at 21, 23, 25, 27 and 29 dpi. Splenic CD8+ T cells were analysed at 31 dpi. (l) Schematic of the experimental set-up. (m–n) Flow cytometry plots (m) and quantification (n) showing the frequencies of the PD-1+ cells among splenic CD8+ T cells. (o) Flow cytometry plots and quantification showing the expression of CD62L among polyclonal TPEX cells (Ly108hiTIM-3lo). (p) Quantification showing the population sizes of CD62L+ TPEX, CD62L TPEX and TEX cells among total CD8+ T cells in untreated and anti-PD-L1-treated mice. Dots in graphs represent individual mice; box plots indicate range, interquartile and median. Data are representative of at least two independent experiments. P values are from two-tailed unpaired t-tests; P > 0.05, not significant (n.s.). Source data

Comment in

References

    1. Hashimoto M, et al. CD8 T cell exhaustion in chronic infection and cancer: opportunities for interventions. Annu. Rev. Med. 2018;69:301–318. doi: 10.1146/annurev-med-012017-043208. - DOI - PubMed
    1. McLane LM, Abdel-Hakeem MS, Wherry EJ. CD8 T cell exhaustion during chronic viral infection and cancer. Annu. Rev. Immunol. 2019;37:457–495. doi: 10.1146/annurev-immunol-041015-055318. - DOI - PubMed
    1. Im SJ, et al. Defining CD8+ T cells that provide the proliferative burst after PD-1 therapy. Nature. 2016;537:417–421. doi: 10.1038/nature19330. - DOI - PMC - PubMed
    1. Kallies A, Zehn D, Utzschneider DT. Precursor exhausted T cells: key to successful immunotherapy? Nat. Rev. Immunol. 2020;20:128–136. doi: 10.1038/s41577-019-0223-7. - DOI - PubMed
    1. Utzschneider DT, et al. T Cell factor 1-expressing memory-like CD8+ T cells sustain the immune response to chronic viral infections. Immunity. 2016;45:415–427. doi: 10.1016/j.immuni.2016.07.021. - DOI - PubMed

MeSH terms

Substances