. 2022 Oct;9(28):e2203357.
doi: 10.1002/advs.202203357. Epub 2022 Aug 17.

Adipocyte-Derived Exosomal MTTP Suppresses Ferroptosis and Promotes Chemoresistance in Colorectal Cancer

Affiliations

Adipocyte-Derived Exosomal MTTP Suppresses Ferroptosis and Promotes Chemoresistance in Colorectal Cancer

Qiumo Zhang et al. Adv Sci (Weinh). 2022 Oct.

Abstract

Obesity is closely related to a poor prognosis in patients with advanced colorectal cancer (CRC), but the mechanisms remain unclear. Ferroptosis is a form of nonapoptotic cell death characterized by lipid reactive oxygen species (ROS) accumulation and iron dependency and is associated with the chemoresistance of tumors. Here, it is shown that adipose-derived exosomes reduce ferroptosis susceptibility in CRC, thus promoting chemoresistance to oxaliplatin. It is found that microsomal triglyceride transfer protein (MTTP) expression is increased in the plasma exosomes of CRC patients with a high body fat ratio, serving as an inhibitor of ferroptosis and reducing sensitivity to chemotherapy. Mechanistically, the MTTP/proline-rich acidic protein 1 (PRAP1) complex inhibited zinc finger E-box binding homeobox 1 expression and upregulated glutathione peroxidase 4 and xCT, leading to a decreased polyunsaturated fatty acids ratio and lipid ROS levels. Moreover, experiments are carried out in organoids, and a tumor implantation model is established in obese mice, demonstrating that the inhibition of MTTP increases the sensitivity to chemotherapy. The results reveal a novel intracellular signaling pathway mediated by adipose-derived exosomes and suggest that treatments targeting secreted MTTP might reverse oxaliplatin resistance in CRC.

Keywords: MTTP; adipose tissue; chemoresistance; colorectal cancer; exosomes; ferroptosis; organoids.


Conflict of interest statement

The authors declare no conflict of interest.

Figures

Figure 1
Figure 1
Characteristics of serum exosome protein expression in high body fat patients with CRC: A) Schematic diagram of patients with CRC presenting normal body fat and high body fat. B) Overall survival and progression‐free survival of patients with normal body fat and high body fat who were treated at Tianjin Medical University Cancer Institute and Hospital. C) Flow chart of methods used to collect plasma and separate plasma exosomes from patients with CRC. D) TEM image of exosomes isolated from human plasma (scale bar, 100 nm). E) Size range of the plasma exosomes detected using NTA. (F) Heatmap of plasma exosomal proteins that were differentially expressed in normal and obese patients. G) KEGG pathway enrichment analysis of plasma from obese patients compared with control normal weight patients.
Figure 2
Figure 2
Coculture model of adipose exosomes and CRC cells: A) Schematic diagram of adipocyte differentiation, exosome extraction and coculture of adipocyte exosomes with CRC cells. B) Photos of MSC/3T3‐L1 and MSC/3T3‐L1 cells induced to differentiate for 8 days, as well as Oil red O staining of mature adipocytes. C) Transmission electron microscopy image of MSC/3T3‐L1 exosomes (scale bar, 100 nm). D) Particle size distribution of MSC/3T3‐L1exosomes measured by nanoflow cytometer. E) Tsg101, Alix, CD9 and CD69 expression, as detected using WB. F) PKH26‐labeled MSC/3T3‐L1 exosomes were taken up by HCT116/SW480 cells.
Figure 3
Figure 3
Adipocyte‐secreted exosomes reverse erastin‐induced ferroptosis in CRC cells: A) CCK‐8 detection of the inhibition ratio of erastin‐exposed CRC cells treated with or without mature adipocyte‐secreted exosomes (n = 3). B,C) Effects of mature adipocyte exosomes on GPX4 and xCT protein levels in CRC cells treated with erastin (B). Levels of the GPX4 and xCT proteins were determined using WB assay and quantified using gray scale analysis (C). Relative levels of PTGS2 D) and CHAC1 E) mRNA expression in CRC cells treated with mature adipocyte exosomes or lip‐1 following treatment with erastin for 24 h. Relative levels of GSH F), MDA G), C11‐BODIPY H,I) and JC‐1 red: green fluorescence ratio J,K) in control, lip‐1 or mature adipocyte exosomes following treatment with erastin for 24 h. Scale bars in (K) = 20 µm. L) Representative TEM images (scale bars: upper panel, 5 µm; lower panel, 1 µm) of mitochondrial morphology and quantification of mitochondrial damage in SW480 cells treated with lip‐1 or mature adipocyte exosomes following treatment with erastin. Red arrows indicate the mitochondria. Data are presented as means ± SD of three simultaneously performed experiments (C to G, I and J). P value was calculated using one‐way ANOVA; *P < 0.05, **P < 0.01, ***P < 0.001.
Figure 4
Figure 4
Inhibition of MTTP promotes ferroptosis in colorectal cancer cells: A) Volcano plot of exosomal proteins that were differentially expressed in the plasma of normal and obese patients. Red and blue dots represent proteins with increased or decreased expression, respectively, in the plasma of obese patients compared with normal weight patients along with the fold change. B) Heatmap of metabolism‐related proteins that were differentially expressed in plasma exosomes from normal and obese patients. C) The overall survival and disease‐free survival curves of patients with CRC stratified based on MTTP expression in the GEPIA dataset. Means and SD are shown (num (high) = 132, num (low) = 135, *P < 0.05 as determined using t tests). D) WB revealed the expression levels of MTTP, xCT, and GPX4 in SW480 with MTTP knockdown and quantified using a gray scale analysis. E) Quantification of the expression levels of MTTP and two representative exosome‐specific markers, Tsg101 and Alix in preadipocyte, adipocyte and mature adipocyte exosomes. Relative mRNA expression levels of PTGS2 F) and CHAC1 G) in CRC cells with MTTP knockdown or treated with mature adipocyte exosomes following treatment with erastin for 24 h. Relative levels of GSH H), MDA I), C11‐BODIPY J,K) and JC‐1 red: green fluorescence ratio L,M) in control, MTTP knockdown or mature adipocyte exosome‐treated cells following treatment with erastin for 24 h. Scale bars in (M) = 20 µm. N) Representative TEM images (scale bars: upper panel, 2 µm; lower panel, 1 µm) of mitochondrial morphology and quantification of mitochondrial damage in SW480 cells with MTTP knockdown or treated with mature adipocyte exosomes following treatment with erastin. Red arrows indicate the mitochondria. Data are presented as means ± SD of three simultaneously performed experiments (D, F to I, K, and L). P value was calculated using one‐way ANOVA; *P < 0.05, **P < 0.01, ***P < 0.001.
Figure 5
Figure 5
The MTTP/PRAP1/ZEB1 axis inhibits ferroptosis: A) Cell lysates from HCT‐116/SW480 cells were immunoprecipitated (IP) with an HA antibody (Ab), FLAG Ab or IgG and then subjected to western blot analysis with HA Ab or FLAG Ab. The lanes labeled Input indicate the cell lysate (n = 3). B) IHC analysis of GPX4, MTTP, xCT and PRAP1 levels in paired paracarcinoma tissues and tumor tissues from patients with CRC (n = 20). Scale bar = 200 µm. C,D) WB revealed the expression levels of PRAP1, xCT and GPX4 in HCT116 C) and SW480 D) with PRAP1 knockdown and quantified using a gray scale analysis. E) Levels of the PRAP1 transcript were significantly higher and ZEB1 mRNA levels were significantly lower in colorectal cancer tissues than in normal tissues in the GEPIA dataset. Means and SD are shown (num (T) = 275, num (P) = 349, *P < 0.05 as determined using t tests). F) WB detection of ZEB1, xCT and GPX4 levels in HCT116 and SW480 cells transfected with ZEB1 siRNAs and quantified by gray scale analysis. G) WB detection of ZEB1, MTTP, Prap1, xCT, and GPX4 levels in HCT116 and SW480 cells transfected with the MTTP plasmid, MTTP siRNA, Prap1 plasmid, or Prap1 siRNA and quantified by gray scale analysis. H) WB detection of ZEB1, MTTP, PRAP1, xCT, and GPX4 levels in HCT116 and SW480 cells transfected with the MTTP or PRAP1 plasmid alone or in combination with or without the ZEB1 plasmid and quantified by gray scale analysis. I) WB detection of ZEB1, MTTP, PRAP1, xCT, and GPX4 levels in HCT116 and SW480 cells transfected with the MTTP siRNA or PRAP1 siRNA in combination with or without the ZEB1 siRNA and quantified by gray scale analysis. Data are presented as means ± SD of three simultaneously performed experiments (C, D and F to I). P value was calculated using one‐way ANOVA; *P < 0.05, **P < 0.01, ***P < 0.001.
Figure 6
Figure 6
Adipocyte exosomes reduce the sensitivity of CRC cells to L‐OHP (B): A) CCK‐8 detection of the inhibition ratio of L‐OHP in CRC cells treated with or without mature adipocyte exosomes (n = 3). B) Effects of the MTTP siRNA and mature adipocyte exosomes on MTTP, ACSL4, xCT, and GPX4 protein levels in CRC cells treated with L‐OHP and quantified by gray scale analysis. Relative levels of PTGS2 C) and CHAC1 D) mRNA expression in CRC cells treated with mature adipocyte exosomes or the MTTP siRNA following treatment with L‐OHP were examined. Relative levels of MDA E), GSH F), C11‐BODIPY G,H) and JC‐1 red: green fluorescence ratio I,J) in control, MTTP siRNA or mature adipocyte exosome‐treated cells following treatment with L‐OHP. Scale bar in (J) = 20 µm. K) Representative TEM images (scale bars: upper panel, 2 µm; lower panel, 1 µm) of mitochondrial morphology and quantification of mitochondrial damage in SW480 cells with MTTP knockdown or treated with mature adipocyte exosomes following treatment with erastin. Red arrows indicate the mitochondria. The experiment was repeated three times independently, with similar results. L) WB detection of MTTP levels in exosomes from preadipocytes, adipocytes and adipocytes treated with L‐OHP and quantified using a gray scale analysis (n = 3). M,N) WB detection of MTTP levels in HCT116 and SW480 cells treated with adipocyte exosomes and L‐OHP‐adipocyte exosomes and quantified using a gray scale analysis. Data are presented as means ± SD of three simultaneously performed experiments (B to F, H, I and L to N). P value was calculated using one‐way ANOVA; *P < 0.05, **P < 0.01, ***P < 0.001.
Figure 7
Figure 7
Adipocyte exosomes reduce the sensitivity of CRC organoids to L‐OHP: A) Schematic description of the organoids development. B) Representative images of organoids growth were recorded by bright‐field microscope. Scale bar = 100 µm. C) Multiplex Fluorescent Immunohistochemistry Staining images of organoids expressing specific markers CD44 (red), Ki67 (pink), CEA (yellow) and EP‐CAM (green) with blue DAPI staining (scale bar = 500 µm). D) Immunohistochemistry analysis of CD44, Ki67, CEA and EP‐CAM levels in serial organoids sections (scale bar = 500 µm). E) Cell viability assay detection of the viability of oxaliplatin‐exposed organoids. F) Representative images of organoids treated with L‐OHP, pretreated with MTTP siRNA, exosomes secreted by KD‐MTTP adipocytes or mature adipocyte exosomes and then treated with oxaliplatin (scale bar = 200 µm). G) Cell viability of organoids described in (F). Data are presented as means ± SD of three simultaneously performed experiments (G). P value was calculated using one‐way ANOVA; n.s., not significant; *P < 0.05, **P < 0.01, ***P < 0.001.
Figure 8
Figure 8
Exosomal MTTP inhibits ferroptosis by decreasing PUFA levels in CRC cells: A) WB revealed the expression levels of MTTP, ACSL4, xCT, and GPX4 in HCT116 and SW480 cells with MTTP knockdown and quantified by gray scale analysis. B,C) WB detection of ACSL4, xCT, and GPX4 levels in CRC cells with MTTP knockdown or treated with mature adipocyte exosomes secreted by MSC B) and 3T3‐L1 C) following treatment with erastin for 24 h. Then quantified by gray scale analysis. (D, E) CRC cells treated with erastin or adipocyte exosomes and erastin pretreated with arachidonic acid (AA) for 24 h (scale bar = 20 µm). Data are presented as means ± SD of three simultaneously performed experiments (A to C, E). P value was calculated using one‐way ANOVA; n.s., not significant; *P < 0.05, **P < 0.01, ***P < 0.001.
Figure 9
Figure 9
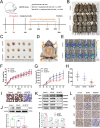
Effects of adipocyte exosomes on colorectal carcinoma in a murine model: A) Schematic description of the experimental design for the in vivo models. B,C) Photos of mice and tumors from all groups. D) Anatomical location of abdominal fat pad in ob/ob mouce. E) In vivo fluorescence signals were recorded by IVIS SPECTRUM. Fluorescence was detected at the abdominal fat pad. Mouse weights F), tumor volumes G) and tumor weights H) in each group (n = 5). I) IHC analysis of MTTP levels in abdominal fat pad in each group (n = 5). Scale bar = 50 µm. J) WB analysis of MTTP protein levels in abdominal fat pad in each group and quantified using a gray scale analysis. K) Expression of ZEB1, MTTP, GPX4 and xCT detected by western blot and quantified using a gray scale analysis (n = 5). L) IHC analysis of GPX4, xCT, ki67, and MTTP levels of tumors in each group (n = 5). Scale bar = 50 µm. Data are presented as means ± SD of three simultaneously performed experiments J,K). P value was calculated using one‐way ANOVA; *P < 0.05, **P < 0.01, ***P < 0.001.
Figure 10
Figure 10
Effects of adipocyte exosomes on colorectal carcinoma in a murine model: A) Schematic description of the experimental design for the in vivo models. B,C) Photos of mice and tumors from all groups. D) Numbers of liver metastases in each group (n = 5). Mouse weights E), tumor weights F), and tumor volumes G) in each group (n = 5). WB analysis of ZEB1, MTTP, GPX4, and xCT protein levels in tumors H) and quantified by a gray scale analysis I). J) Expression of MTTP, GPX4, xCT, and ki67 detected using IHC (n = 5). Data are presented as means ± SD of three simultaneously performed experiments (G,I). P value was calculated using one‐way ANOVA; *P < 0.05, **P < 0.01, ***P < 0.001.
Figure 11
Figure 11
A proposed model illustrating the role of adipose‐derived exosomal MTTP in regulating ferroptosis in CRC cells.

References

    1. Miller K. D., Nogueira L., Mariotto A. B., Rowland J. H., Yabroff K. R., Alfano C. M., Jemal A., Kramer J. L., Siegel R. L., Cancer treatment and survivorship statistics 2019 , CA: Cancer J. Clin. 2019, 69, 363. - PubMed
    1. Sung H., Ferlay J., Siegel R. L., Laversanne M., Soerjomataram I., Jemal A., Bray F., CA: Cancer J. Clin. 2021, 71, 209. - PubMed
    1. André T., Boni C., Navarro M., Tabernero J., Hickish T., Topham C., Bonetti A., Clingan P., Bridgewater J., Rivera F., De Gramont A., J. Clin. Oncol. 2009, 27, 3109. - PubMed
    1. Kuebler J. P, Wieand H. S, O'connell M. J., Smith R. E., Colangelo L. H., Yothers G., Petrelli N. J., Findlay M. P., Seay T. E., Atkins J. N., Zapas J. L., Goodwin J. W, Fehrenbacher L., Ramanathan R. K., Conley B. A., Flynn P. J., Soori G., Colman L. K., Levine E. A., Lanier K. S., Wolmark N., J. Clin. Oncol. 2007, 25, 2198. - PubMed
    1. Meng N., Chen M., Chen D., Chen X. H., Wang J. Z., Zhu S., He Y. T., Zhang X. L., Lu R. X., Yan G. R., Adv. Sci. 2020, 7, 1903233. - PMC - PubMed

Publication types

MeSH terms