. 2022 Aug 17;17(1):52.
doi: 10.1186/s13024-022-00554-8.

Transcriptome deregulation of peripheral monocytes and whole blood in GBA-related Parkinson's disease

Affiliations

Transcriptome deregulation of peripheral monocytes and whole blood in GBA-related Parkinson's disease

Giulietta Maria Riboldi et al. Mol Neurodegener. .

Abstract

Background: Genetic mutations in beta-glucocerebrosidase (GBA) represent the major genetic risk factor for Parkinson's disease (PD). GBA participates in both the endo-lysosomal pathway and the immune response, two important mechanisms involved in the pathogenesis of PD. However, modifiers of GBA penetrance have not yet been fully elucidated.

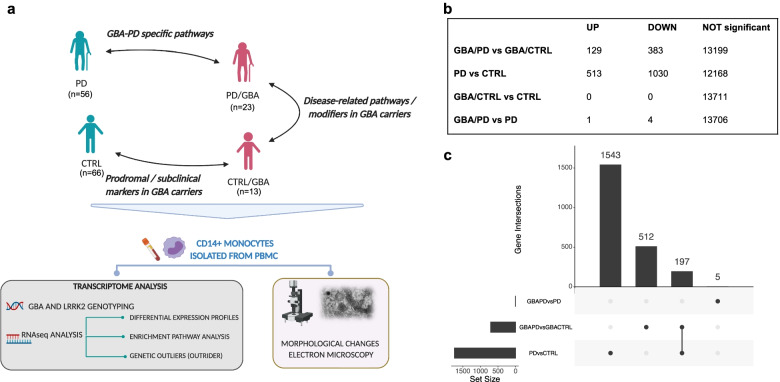
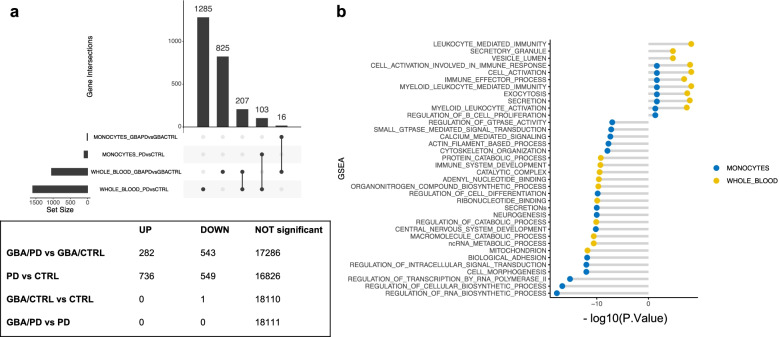
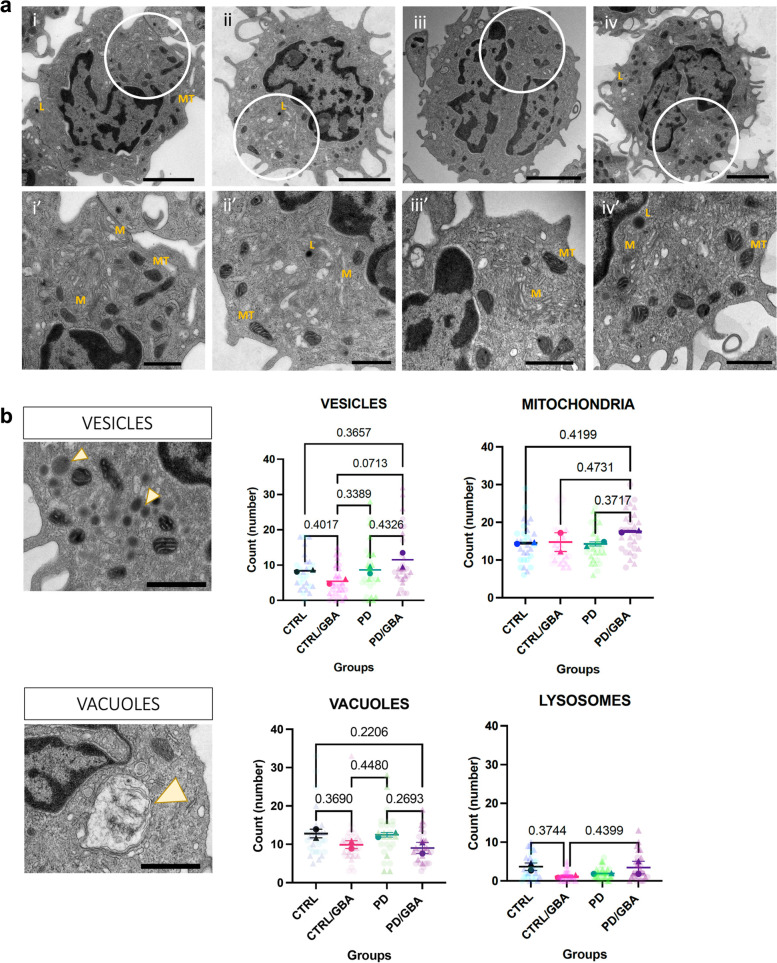
Methods: We characterized the transcriptomic profiles of circulating monocytes in a population of patients with PD and healthy controls (CTRL) with and without GBA variants (n = 23 PD/GBA, 13 CTRL/GBA, 56 PD, 66 CTRL) and whole blood (n = 616 PD, 362 CTRL, 127 PD/GBA, 165 CTRL/GBA). Differential expression analysis, pathway enrichment analysis, and outlier detection were performed. Ultrastructural characterization of isolated CD14+ monocytes in the four groups was also performed through electron microscopy.

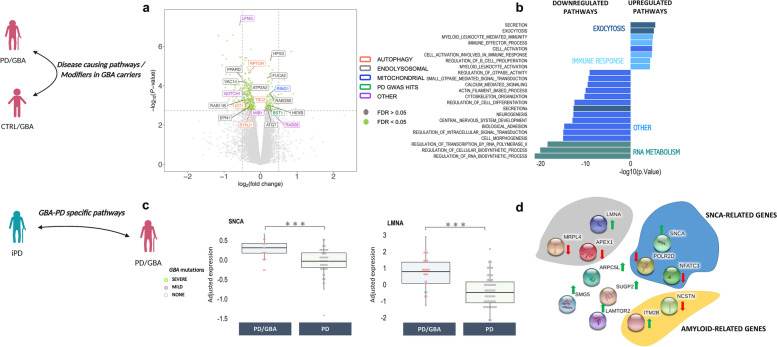
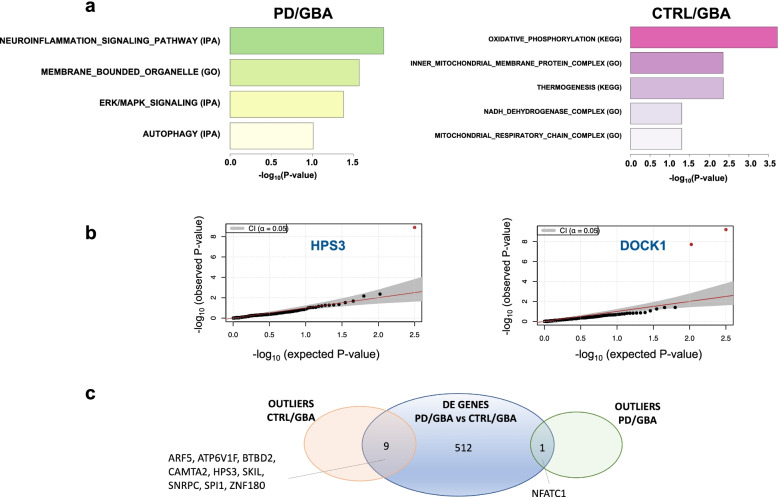
Results: We observed hundreds of differentially expressed genes and dysregulated pathways when comparing manifesting and non-manifesting GBA mutation carriers. Specifically, when compared to idiopathic PD, PD/GBA showed dysregulation in genes involved in alpha-synuclein degradation, aging and amyloid processing. Gene-based outlier analysis confirmed the involvement of lysosomal, membrane trafficking, and mitochondrial processing in manifesting compared to non-manifesting GBA-carriers, as also observed at the ultrastructural levels. Transcriptomic results were only partially replicated in an independent cohort of whole blood samples, suggesting cell-type specific changes.

Conclusions: Overall, our transcriptomic analysis of primary monocytes identified gene targets and biological processes that can help in understanding the pathogenic mechanisms associated with GBA mutations in the context of PD.

Keywords: GBA; Monocytes; Parkinson’s disease; Transcriptomic analysis; beta-glucocerebrosidase.


Conflict of interest statement

The authors declare no competing interests.

Figures

Fig. 1
Fig. 1
Project design schematic representation and monocytes DEG. a Schematic representation of project design and rationale for the comparison of the selected cohorts and analysis of biological samples in monocytes. b Number of DEG across groups in monocytes (UP = upregulated genes, DOWN: downregulated genes) (FDR < 0.05). c Upset plot summarizing the number of differentially expressed genes at FDR < 0.05 in monocytes between manifesting and non-manifesting GBA carriers, PD and CTRL subjects in monocytes and the overlapping genes
Fig. 2
Fig. 2
Differential expression profiles between PD/GBA, CTRL/GBA, and PD. a-b PD/GBA vs CTRL/GBA. a Volcano plot represents log2 fold change (log2FC) (x-axis) and -log10 of P-values (y-axis) of the differentially expressed genes between PD/GBA and CTRL/GBA groups. Green dots represent genes with FDR < 0.05. Selected genes were highlighted based on overlap targeted pathways as indicated in the legend on the right side. b Pathway enrichment analysis of differentially expressed genes between PD/GBA vs CTRL/GBA subjects. Pathway enrichment of genes differentially expressed between PD/GBA and CTRL/GBA subjects with FDR < 0.05 for GO terms are reported. Light blue: pathways related to the immune response; Dark green: pathways related to exocytosis; Light green: pathways related to RNA metabolism; Dark blue: other pathways. c-d PD/GBA vs PD. c Differential normalized expression count of SNCA and LMNA between PD/GBA and PD. Disease and genetic status are reported on the x-axes. Each dot represents a subject. Dots are colored based on GBA mutations (as reported in the legend: GBA mild mutations (N370S, E326K, R496H), GBA severe mutations (L444P/A456P/RecNciI, V394L, 84GG, 84GG/T369M, N370S/RecNciI)). Asterisks indicate significant adjusted p-value (* = adjusted p-value < 0.05, ** = adjusted p-value < 0.01, *** = adjusted p-value < 0.001; statistics: Mann-Whitney U test). d Schematic representation (STRING, [150]) of functionally relevant genes differentially expressed between PD/GBA and PD cohorts. Genes are grouped in colored circles based on shared functional pathways (yellow: amyloid-related genes, blue: SNCA-related genes, grey: PD hits related genes). Arrows indicate whether genes are up (green) or down (red) regulated in the PD/GBA vs the PD cohort
Fig. 3
Fig. 3
Enrichment analysis of outlier genes in the four cohorts (PD/GBA, CTRL/GBA, PD, CTRL). a Pathway enrichment analysis of outlier genes in the PD/GBA and CTRL/GBA cohort (based on GSEA, IPA and g-profiler tools). Bars represent p-value (−log10(p-value)). b Scatter plot representing -log10 (p-value) of two of the outliers genes identified in previous analysis. c Venn-diagram representing overlapping genes between differential expression analysis and outliers analysis in manifesting and non-manifesting carriers in isolated monocytes
Fig. 4
Fig. 4
Differential expression profiles in whole blood and overlap with monocytes data. a Upset plot summarizing the number of differentially expressed genes at FDR < 0.05 in whole blood between manifesting and non-manifesting GBA carriers, and PD and CTRL subjects and the overlapping genes with monocytes. b Number of DEG across groups in whole blood (UP = upregulated genes, DOWN: downregulated genes). c Dysregulated pathways in CD14+ monocytes and whole blood in GBA/PD vs GBA/CTRL. The plot represent the -log10(P Value) the enriched pathways in the differentially up-regulated and down-regulated genes when comparing GBA/PD vs GBA/CTRL in both isolated CD14+ monocytes (blue) and whole blood (yellow) at FDR 5%. The figure shows an overlap in monocytes and whole blood of the upregulated pathways related to membrane trafficking and immune response
Fig. 5
Fig. 5
Morphological characterization of CD14+ monocytes. a Low magnification (1800X) images (i, ii, iii, iv) and high magnification (4000x) images (i’, ii’, iii’, iv’). Location of the high magnification images within low magnification pictures are highlighted by the white circle in the first row. Scale bar: 2 𝝻m and 800 nm respectively. i/i’) Cells from CTRL and ii/ii’) CTR/GBA subjects showing normal membrane compartment (M, Golgi and Endoplasmic reticulum), lysosomes (L), mitochondria (MT), cell-to-cell adherences, multiple pseudopodal extensions from the cell membrane. iii/iii’) Cells from PD subjects showing highly thickened, and distorted cell membrane compartment (M, Golgi and Endoplasmic reticulum); decreased pseudopodia, RER and free ribosomes; mitochondrial (MT) membranes are severely affected, often lacking external membranous encapsulation and with internally swollen cristae. iv/iv’) Cells from PD/GBA subjects showing small and large vacuoles, normal cell membranes, pseudopodal extensions appear normal, and nuclei. Abnormal membrane assembly (M), ultrastructure, and free ribosomes. b Quantification of mitochondria, lysosome, vesicles and vacuoles in four groups (n = 2 subjects per group, 15 cells per sample). Example of vacuole and vesicles reported in the figures on the left highlighted by yellow arrowhead (scale bar 800 nm). Data represents count from each cell from the two samples per group, and mean and SEM of the two replicates. p-value from one-way ANOVA analysis is reported above each comparison (p-value < 0.5 were reported)

References

    1. Gan-Or Z, Giladi N, Rozovski U, Shifrin C, Rosner S, Gurevich T, et al. Genotype-phenotype correlations between GBA mutations and Parkinson disease risk and onset. Neurology. 2008;70(24):2277–2283. doi: 10.1212/01.wnl.0000304039.11891.29. - DOI - PubMed
    1. Lesage S, Anheim M, Condroyer C, Pollak P, Durif F, Dupuits C, et al. Large-scale screening of the Gaucher’s disease-related glucocerebrosidase gene in Europeans with Parkinson’s disease. Hum Mol Genet. 2011;20(1):202–210. doi: 10.1093/hmg/ddq454. - DOI - PubMed
    1. Li Y, Sekine T, Funayama M, Li L, Yoshino H, Nishioka K, et al. Clinicogenetic study of GBA mutations in patients with familial Parkinson’s disease. Neurobiol Aging. 2014;35(4):935.e3–935.e8. doi: 10.1016/j.neurobiolaging.2013.09.019. - DOI - PubMed
    1. Sidransky E, Samaddar T, Tayebi N. Mutations in GBA are associated with familial Parkinson disease susceptibility and age at onset. Neurology. 2009;73(17):1424–1425. doi: 10.1212/WNL.0b013e3181b28601. - DOI - PubMed
    1. Neumann J, Bras J, Deas E, O’Sullivan SS, Parkkinen L, Lachmann RH, et al. Glucocerebrosidase mutations in clinical and pathologically proven Parkinson’s disease. Brain J Neurol. 2009;132(Pt 7):1783–1794. doi: 10.1093/brain/awp044. - DOI - PMC - PubMed

Publication types

Substances