

The lipidomic profile of the tumoral periprostatic adipose tissue reveals alterations in tumor cell's metabolic crosstalk
- PMID: 35978404
- PMCID: PMC9386931
- DOI: 10.1186/s12916-022-02457-3
The lipidomic profile of the tumoral periprostatic adipose tissue reveals alterations in tumor cell's metabolic crosstalk
Abstract
Background: Periprostatic adipose tissue (PPAT) plays a role in prostate cancer (PCa) progression. PPAT lipidomic composition study may allow us to understand the tumor metabolic microenvironment and provide new stratification factors.
Methods: We used ultra-high-performance liquid chromatography-mass spectrometry-based non-targeted lipidomics to profile lipids in the PPAT of 40 patients with PCa (n = 20 with low-risk and n = 20 high-risk). Partial least squares-discriminant analysis (PLS-DA) and variable importance in projection (VIP) analysis were used to identify the most relevant features of PPAT between low- and high-risk PCa, and metabolite set enrichment analysis was used to detect disrupted metabolic pathways. Metabolic crosstalk between PPAT and PCa cell lines (PC-3 and LNCaP) was studied using ex vivo experiments. Lipid uptake and lipid accumulation were measured. Lipid metabolic-related genes (SREBP1, FASN, ACACA, LIPE, PPARG, CD36, PNPLA2, FABP4, CPT1A, FATP5, ADIPOQ), inflammatory markers (IL-6, IL-1B, TNFα), and tumor-related markers (ESRRA, MMP-9, TWIST1) were measured by RT-qPCR.
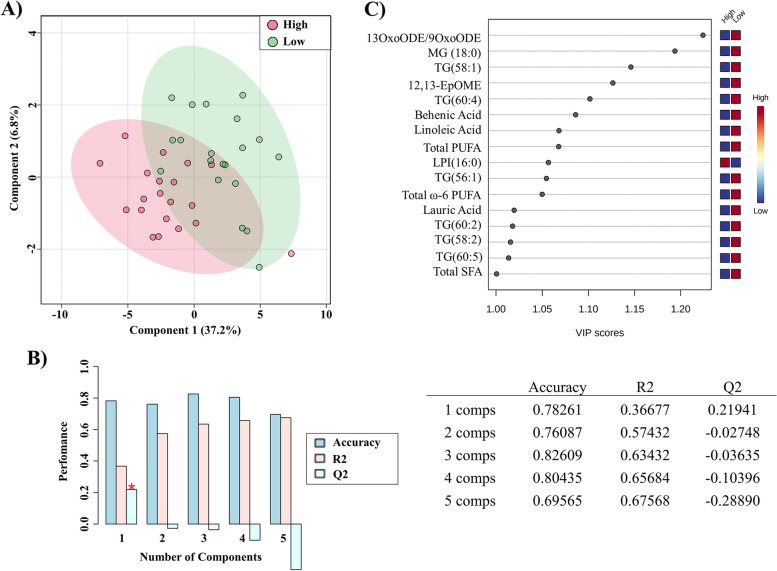
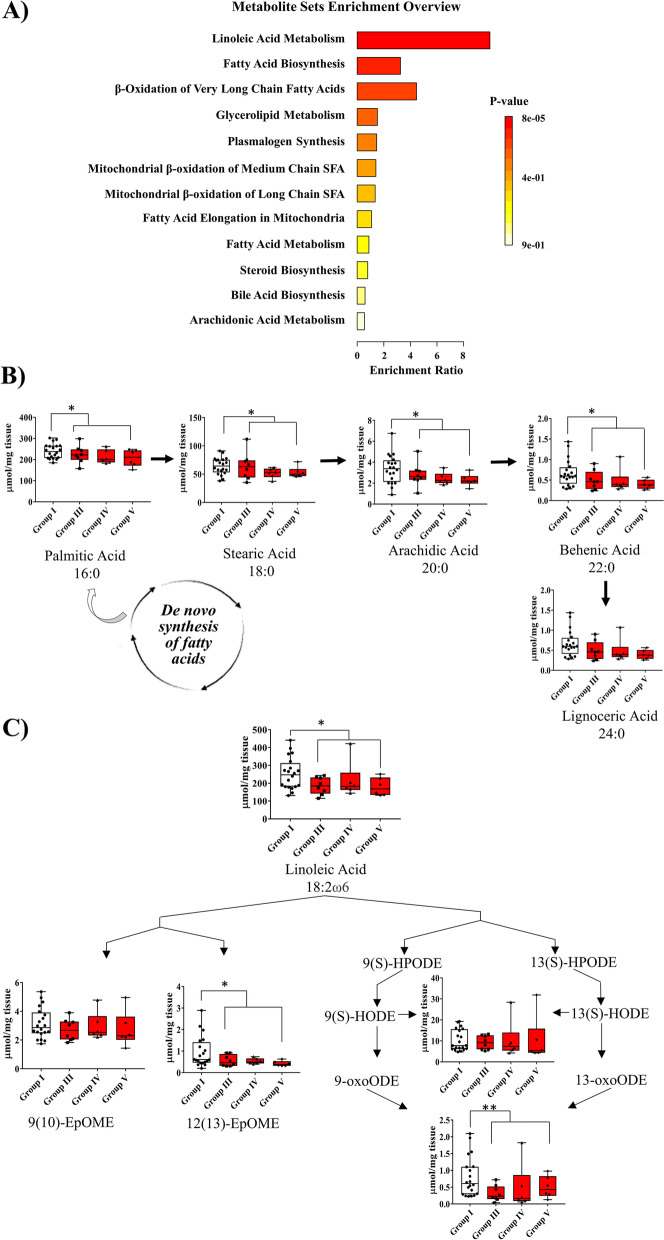
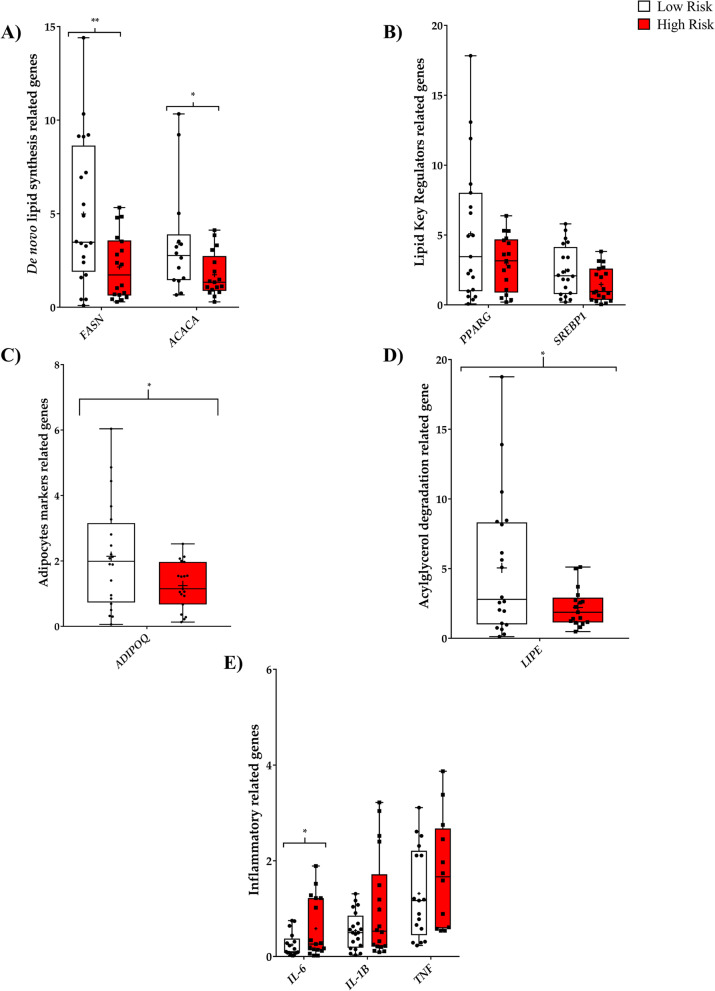
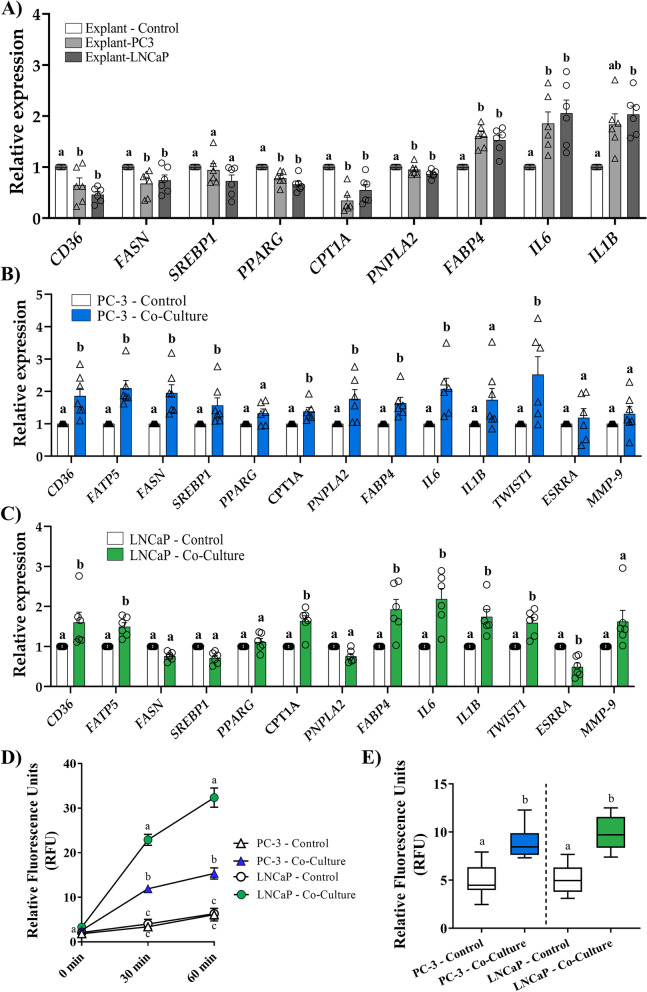
Results: Significant differences in the content of 67 lipid species were identified in PPAT samples between high- and low-risk PCa. PLS-DA and VIP analyses revealed a discriminating lipidomic panel between low- and high-risk PCa, suggesting the occurrence of disordered lipid metabolism in patients related to PCa aggressiveness. Functional analysis revealed that alterations in fatty acid biosynthesis, linoleic acid metabolism, and β-oxidation of very long-chain fatty acids had the greatest impact in the PPAT lipidome. Gene analyses of PPAT samples demonstrated that the expression of genes associated with de novo fatty acid synthesis such as FASN and ACACA were significantly lower in PPAT from high-risk PCa than in low-risk counterparts. This was accompanied by the overexpression of inflammatory markers (IL-6, IL-1B, and TNFα). Co-culture of PPAT explants with PCa cell lines revealed a reduced gene expression of lipid metabolic-related genes (CD36, FASN, PPARG, and CPT1A), contrary to that observed in co-cultured PCa cell lines. This was followed by an increase in lipid uptake and lipid accumulation in PCa cells. Tumor-related genes were increased in co-cultured PCa cell lines.
Conclusions: Disturbances in PPAT lipid metabolism of patients with high-risk PCa are associated with tumor cell metabolic changes.
Keywords: De novo fatty acid synthesis; Lipid metabolism; Lipidomic; Periprostatic adipose tissue; Prostate cancer.
© 2022. The Author(s).
Conflict of interest statement
The authors declare that they have no competing interests.
Figures


Similar articles
-
Tumoral periprostatic adipose tissue exovesicles-derived miR-20a-5p regulates prostate cancer cell proliferation and inflammation through the RORA gene.J Transl Med. 2024 Jul 15;22(1):661. doi: 10.1186/s12967-024-05458-3. J Transl Med. 2024. PMID: 39010137 Free PMC article.
-
Variable effects of periprostatic adipose tissue on prostate cancer cells: Role of adipose tissue lipid composition and cancer cells related factors.Prostate. 2024 Mar;84(4):358-367. doi: 10.1002/pros.24655. Epub 2023 Dec 19. Prostate. 2024. PMID: 38112233
-
Periprostatic Adipose Tissue Microenvironment: Metabolic and Hormonal Pathways During Prostate Cancer Progression.Front Endocrinol (Lausanne). 2022 Apr 13;13:863027. doi: 10.3389/fendo.2022.863027. eCollection 2022. Front Endocrinol (Lausanne). 2022. PMID: 35498409 Free PMC article. Review.
-
Lipophagy and prostate cancer: association with disease aggressiveness and proximity to periprostatic adipose tissue.J Pathol. 2021 Oct;255(2):166-176. doi: 10.1002/path.5754. Epub 2021 Aug 7. J Pathol. 2021. PMID: 34219239
-
Interplay between Prostate Cancer and Adipose Microenvironment: A Complex and Flexible Scenario.Int J Mol Sci. 2022 Sep 15;23(18):10762. doi: 10.3390/ijms231810762. Int J Mol Sci. 2022. PMID: 36142673 Free PMC article. Review.
Cited by
-
Identification of a Metabolic Reprogramming-Associated Risk Model Related to Prognosis, Immune Microenvironment, and Immunotherapy of Stomach Adenocarcinoma.J Oncol. 2022 Sep 21;2022:7248572. doi: 10.1155/2022/7248572. eCollection 2022. J Oncol. 2022. PMID: 36185624 Free PMC article.
-
Magnetic resonance imaging-based radiomics nomogram for the evaluation of therapeutic responses to neoadjuvant chemohormonal therapy in high-risk non-metastatic prostate cancer.Cancer Med. 2024 Jul;13(14):e70001. doi: 10.1002/cam4.70001. Cancer Med. 2024. PMID: 39031016 Free PMC article.
-
Periprostatic Adipose Tissue: A New Perspective for Diagnosing and Treating Prostate Cancer.J Cancer. 2024 Jan 1;15(1):204-217. doi: 10.7150/jca.89750. eCollection 2024. J Cancer. 2024. PMID: 38164282 Free PMC article. Review.
-
Emerging Hallmarks of Metabolic Reprogramming in Prostate Cancer.Int J Mol Sci. 2023 Jan 4;24(2):910. doi: 10.3390/ijms24020910. Int J Mol Sci. 2023. PMID: 36674430 Free PMC article. Review.
-
A dynamic online nomogram predicting prostate cancer short-term prognosis based on 18F-PSMA-1007 PET/CT of periprostatic adipose tissue: a multicenter study.Abdom Radiol (NY). 2024 Oct;49(10):3747-3757. doi: 10.1007/s00261-024-04421-6. Epub 2024 Jun 18. Abdom Radiol (NY). 2024. PMID: 38890216
References
-
- Estève D, Roumiguié M, Manceau C, Milhas D, Muller C. Periprostatic adipose tissue: a heavy player in prostate cancer progression. Curr Opin Endocr Metab Res. 2020;10:29–35. doi: 10.1016/j.coemr.2020.02.007. - DOI
Publication types
MeSH terms
Substances
LinkOut - more resources
Full Text Sources
Research Materials
Miscellaneous
