

Optimization of the production process for the anticancer lead compound illudin M: downstream processing
- PMID: 35978411
- PMCID: PMC9382783
- DOI: 10.1186/s12934-022-01886-2
Optimization of the production process for the anticancer lead compound illudin M: downstream processing
Abstract
Background: Secondary metabolites have played a key role as starting points for drug development programs due to their often unique features compared with synthetically derived molecules. However, limitations related to the discovery and supply of these molecules by biotechnological means led to the retraction of big pharmaceutical companies from this field. The reasons included problems associated with strain culturing, screening, re-discovery, purification and characterization of novel molecules from natural sources. Nevertheless, recent reports have described technical developments that tackle such issues. While many of these reports focus on the identification and characterization of such molecules to enable subsequent chemical synthesis, a biotechnological supply strategy is rarely reported. This may be because production processes usually fall under proprietary research and/or few processes may meet the requirements of a pharmaceutical development campaign. We aimed to bridge this gap for illudin M-a fungal sesquiterpene used for the development of anticancer agents-with the intention to show that biotechnology can be a vital alternative to synthetic processes dealing with small molecules.
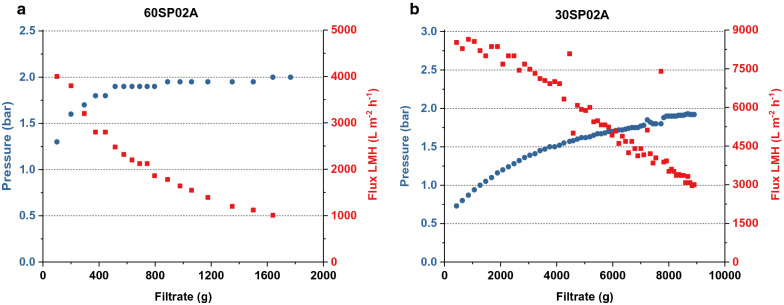
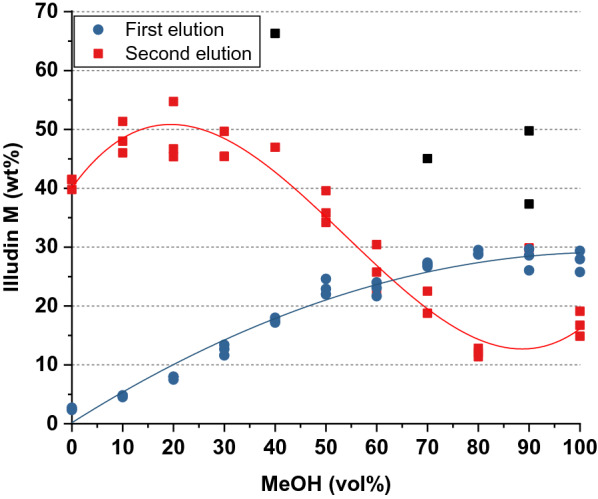
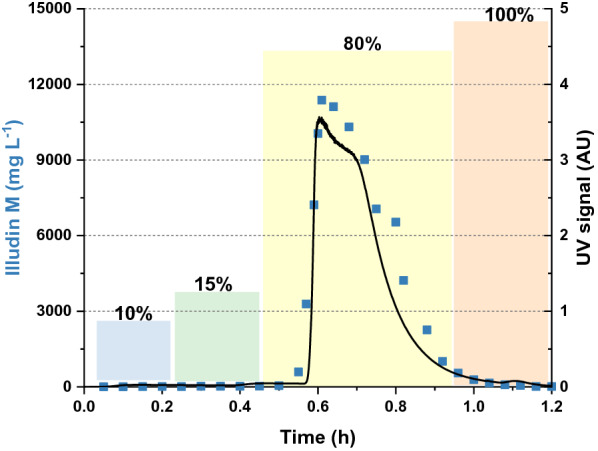
Results: We used µL-scale models to develop an adsorption and extraction strategy for illudin M recovery from culture supernatant of Omphalotus nidiformis and these findings were successfully transferred into lab-scale. By adsorbing and eluting the product using a fixed resin-bed we reduced the working volume by ~ 90% and removed the aqueous phase from the process. After a washing step, a highly concentrated illudin M fraction was obtained by isocratic elution with 80% methanol. The fraction was dried and extracted using a water/heptane mixture, enriching illudin M in the heptane phase. From heptane illudin M could be instantly crystalized by concentrating the solution, achieving a final purity > 95%.
Conclusion: We have developed a robust, scalable and low-cost downstream process to obtain highly pure illudin M. By using solid phase extraction we reduced the production of solvent waste. Heptane from the final purification step could be recycled. The reduced amounts of solvents required, and the short purification time render this method a very economic and ecologic alternative to published processes.
Keywords: Anti-cancer agents; Basidiomycota; Crystallization; DSP; Fungal secondary metabolites; Liquid–liquid extraction; Natural products; Small-scale model; Solid phase extraction.
© 2022. The Author(s).
Conflict of interest statement
The authors declare no competing interests.
Figures


Similar articles
-
Optimization of the production process for the anticancer lead compound illudin M: process development in stirred tank bioreactors.Microb Cell Fact. 2022 Jul 18;21(1):145. doi: 10.1186/s12934-022-01870-w. Microb Cell Fact. 2022. PMID: 35843931 Free PMC article.
-
Optimization of the production process for the anticancer lead compound illudin M: improving titers in shake-flasks.Microb Cell Fact. 2022 May 28;21(1):98. doi: 10.1186/s12934-022-01827-z. Microb Cell Fact. 2022. PMID: 35643529 Free PMC article.
-
Application of High-speed Countercurrent Chromatography for the Purification of High-purity Illudin S from Omphalotus japonicus.Anal Sci. 2019 Jul 10;35(7):789-792. doi: 10.2116/analsci.19P053. Epub 2019 Mar 29. Anal Sci. 2019. PMID: 30930353
-
Upflow anaerobic sludge blanket reactor--a review.Indian J Environ Health. 2001 Apr;43(2):1-82. Indian J Environ Health. 2001. PMID: 12397675 Review.
-
Discovery and development of sesquiterpenoid derived hydroxymethylacylfulvene: a new anticancer drug.Bioorg Med Chem. 1999 May;7(5):881-6. doi: 10.1016/s0968-0896(99)00016-4. Bioorg Med Chem. 1999. PMID: 10400341 Review.
Cited by
-
Optimization of the production process for the anticancer lead compound illudin M: process development in stirred tank bioreactors.Microb Cell Fact. 2022 Jul 18;21(1):145. doi: 10.1186/s12934-022-01870-w. Microb Cell Fact. 2022. PMID: 35843931 Free PMC article.
-
Spore-Derived Isolates from a Single Basidiocarp of Bioluminescent Omphalotus olivascens Reveal Multifaceted Phenotypic and Physiological Variations.Microorganisms. 2025 Jan 1;13(1):59. doi: 10.3390/microorganisms13010059. Microorganisms. 2025. PMID: 39858827 Free PMC article.
-
Fungi: Pioneers of chemical creativity - Techniques and strategies to uncover fungal chemistry.IMA Fungus. 2025 Mar 7;16:e142462. doi: 10.3897/imafungus.16.142462. eCollection 2025. IMA Fungus. 2025. PMID: 40093757 Free PMC article. Review.
References
-
- Wild C, Weiderpass E, Stewart B. World Cancer Report: Cancer Research for Cancer Prevention. Lyon: International Agency for Research on Cancer; 2020. http://publications.iarc.fr/586
-
- Cragg GM, Newman DJ. Natural products as sources of anticancer agents : current approaches and perspectives. In: Cechinel Filho V, editor. Natural products as Source of Molecules with Therapeutic Potential. Springer; 2018. p. 309–331.
MeSH terms
Substances
LinkOut - more resources
Full Text Sources
Miscellaneous
