. 2022 Aug 17;20(1):124.
doi: 10.1186/s12964-022-00933-0.

Lamprey immune protein triggers the ferroptosis pathway during zebrafish embryonic development

Affiliations

Lamprey immune protein triggers the ferroptosis pathway during zebrafish embryonic development

Zeyu Du et al. Cell Commun Signal. .

Abstract

Background: Previously, a novel lamprey immune protein (LIP) was identified, which plays an important role in immunity and the regulation of growth and development in lampreys. However, the mechanism of how LIP regulates growth and development remains unclear.

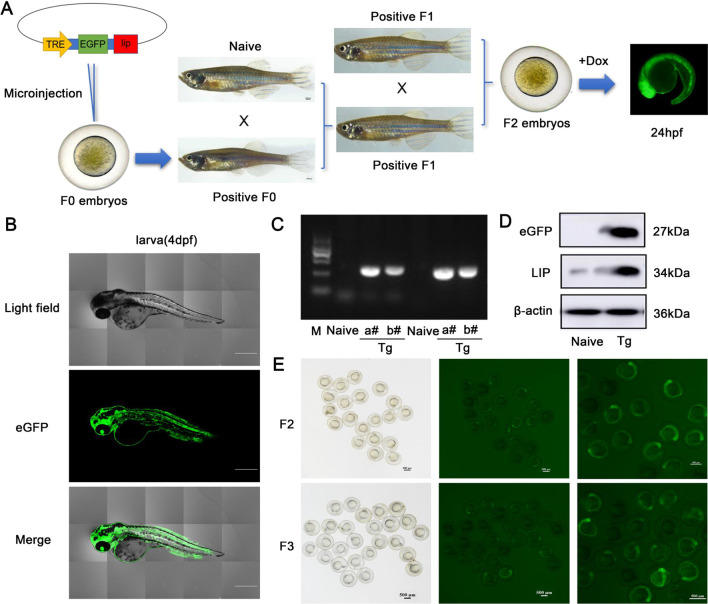
Methods: In this study, a zebrafish model of LIP overexpression was established by delivering a transgenic plasmid to the fertilized egg. The biological function of LIP was explored in vivo through phenotypic characterization, comparative transcriptome sequencing, and physiological and biochemical analyses.

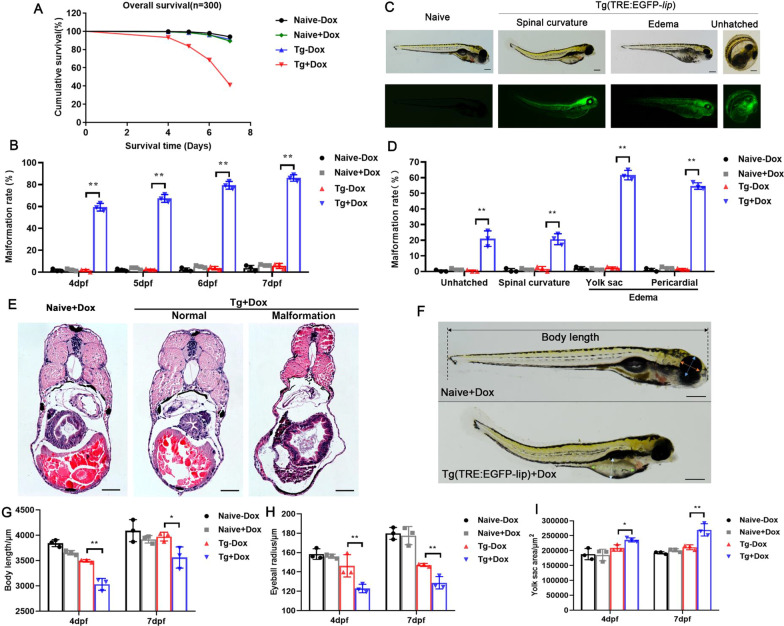
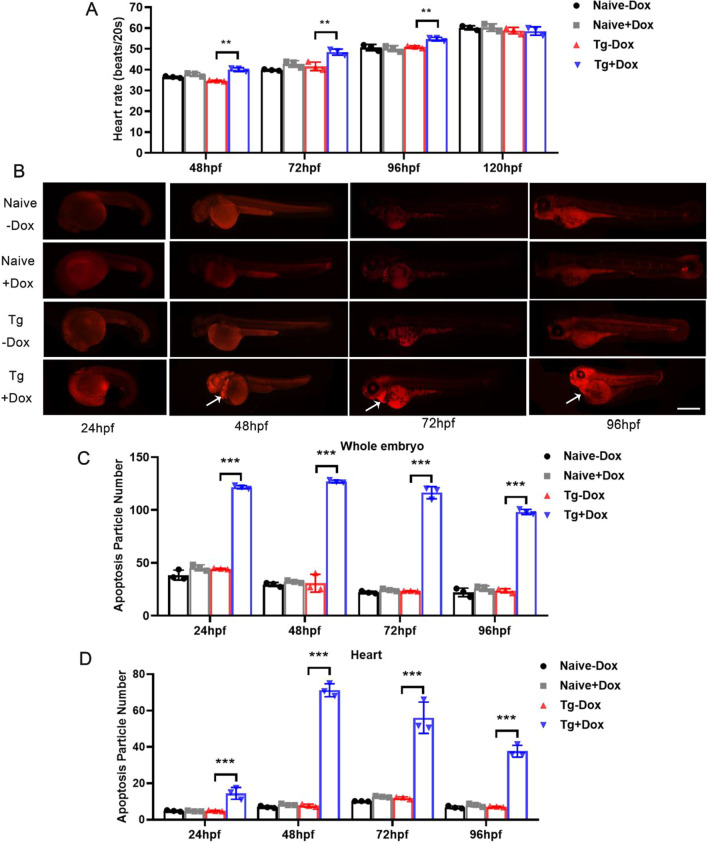
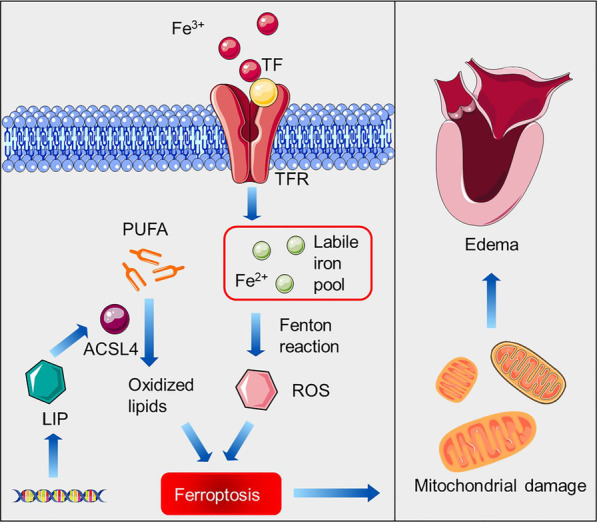
Results: LIP caused developmental toxicity in zebrafish, increased embryo mortality and exhibited strong teratogenic, lethal, and developmental inhibitory effects. Comparative transcriptome analysis showed that LIP-induced large-scale cell death by triggering ferroptosis. Furthermore, LIP-induced lipid peroxidation and caused pericardial edema. Direct inhibition of acsl4a and tfr1a, or silencing of acsl4a and tfr1a with specific siRNA suppressed ferroptosis and pericardial edema.

Conclusions: Taken together, we confirmed that LIP can participate in growth and development via the regulation of lipid peroxidation and ferroptosis. This lays the foundation for future studies on the function of LIP in lampreys. Video Abstract.

Keywords: Edema; Ferroptosis; LIP; Lipid peroxidation; Transgenic zebrafish.


Conflict of interest statement

The authors declare that they have no competing interests.

Figures

Fig. 1
Fig. 1
Establishment of a LIP-overexpression transgenic zebrafish model. A The plasmid was microinjected into fertilized eggs at one-cell stage. The positive F0 fish was individually crossed with naive fish to obtain positive F1 fish. F2 fish was reproduced by selfing the positive F1. Imaging EGFP expression in F2 embryos with or without Dox was performed using a fluorescence microscope. B Confocal imaging overexpression of fluorescent expression of LIP zebrafish. Scale 50 μm. C Positive F2 individuals were obtained by PCR screening. M: DNA ladder; lanes a# and b#: individual DNA samples (two transgenic lines with fluorescent expression obtained). The positive samples amplified 367–374 bp DNA bands. D Western blot analysis of LIP and EGFP in F2 fish. E Fluorescent expression efficiency of F2 and F3 generation transgenic zebrafish. Scale bar is 500 μm
Fig. 2
Fig. 2
Overexpression of lip inhibits embryonic development of zebrafish. A The Keplan-meier survival curves of larvae (n = 100). P-values were obtained from two-sided log-rank tests. B The malformation rates at 4-7dpf (n = 100) of Dox-treated embryos were calculated and compared with those of their corresponding controls. C LIP overexpression causes 7dpf zebrafish to develop malformations. D The ratio of various malformations of 7dpf zebrafish (n = 100). E HE staining of zebrafish larvae with LIP overexpression malformation. F Lateral view of zebrafish with measurements of body length, eyeball diameter and yolk sac area. G-I Body lengths (G), eyeball diameters (H) and yolk sac area (I) of embryos injected with Tg(TRE:EGFP-lip) or naive control at 4 and 7dpf (n = 10). Data were given as means ± standard deviation. All figures are representative of three biological replicates. **, P < 0.01; *, 0.01 < P < 0.05. Scale bar is 250 μm
Fig. 3
Fig. 3
LIP inhibits embryonic development of transgenic zebrafish by inducing cell death. A Heart rate of 48-120hpf zebrafish every 20 s. B LIP overexpression induces effective cell death in whole embryos and heart. Zebrafish embryos were stained with propidium iodide (PI) at 24, 48, 72 and 96hpf. Death cells are visible as bright red spots, and less bright homogenous red staining, an unspecific background staining. Naive zebrafish exhibited few or no death cells in whole organism. In contrast, significantly increased staining was observed throughout the hearts in LIP overexpression embryos (white arrows). Scale bar is 500 μm. C Quantification of death particle number in whole embryo shows increase in LIP overexpression embryos at 24, 48, 72 and 96hpf. D Quantification of death particle number in heart shows increase in LIP overexpression embryos at 24, 48, 72 and 96hpf. Data were given as means ± standard deviation. All figures are representative of three biological replicates (per test n = 10). ***, P < 0.001; **, P < 0.01; *, 0.01 < P < 0.05
Fig. 4
Fig. 4
RNA-seq transcriptome analysis identifies a set of LIP-dependent targets in transgenic zebrafish. A Correlation coefficient of zebrafish at different stages of embryonic development. B The upregulated and downregulated DEGs in different periods. C KEGG pathway analysis of main DEGs in LIP overexpression groups, the red in the circle represents dominant influence DEG sets. D Heat map of RNA-seq showing genes related to ferroptosis pathway. E qPCR validation of differential expression of six genes. In E, data are presented as mean ± SEM, and all figures are representative of three biological replicates. ***, P < 0.001; *, 0.01 < P < 0.05
Fig. 5
Fig. 5
LIP overexpression in zebrafish larvae causes edema by triggering ferroptosis. A Ferroptosis expression in four stages of embryonic development of zebrafish was confirmed on Western Blot. B-D Zebrafish whole embryo iron (B), MDA (C), T-GSH and GSH/GSSG ratio (D) detection at 19, 36, 60 and 96hpf. E Representative phenotype of the larvae categorized into 4 groups: P1 = no edema, P2 = mild edema, P3 = severe edema, P4 = very severe edema. F Effects of vitamin E on survival rate of overexpressed LIP zebrafish. G Phenotypic classification and representative images of zebrafish larvae treated with vitamin at 96 hpf. H Phenotypic classification of 96hpf larvae treated by combination of FAC and DFO. I Transmission electron microscopy performed on heart sections from zebrafish myocardium demonstrates abnormal edema and mitochondria ultrastructure in LIP overexpression hearts. Pink: cell nucleus, blue: normal mitochondria, red: mitochondria after ferroptosis. Scale bar 2 μm. Data were given as means ± standard deviation. All figures are representative of three biological replicates (per test n = 100). ***, P < 0.001; **, P < 0.01; *, 0.01 < P < 0.05
Fig. 6
Fig. 6
LIP overexpression induces ferroptosis through an increase in tfr1a and acsl4a. A-D SiRNA interference of zebrafish tfr1a. Representative phenotype (A), efficiency (B), survival rate (C) and phenotypic classification (D) of siRNA silenced zebrafish tfr1a. E–H SiRNA interference of zebrafish acsl4a. Representative phenotype (E), efficiency (F), survival rate (G) and phenotypic classification (H) of siRNA silenced zebrafish acsl4a. I-L SiRNA interference of zebrafish tfr1a and acsl4a. Representative phenotype (I), efficiency (J), survival rate (K) and phenotypic classification (L) of siRNA silenced zebrafish tfr1a and acsl4a. Data were given as means ± standard deviation. All figures are representative of three biological replicates (per test n = 100). ***, P < 0.001; **, P < 0.01; *, 0.01 < P < 0.05
Fig. 7
Fig. 7
ROSI targeted acsl4 inhibits ferroptosis. A Representative phenotypes of zebrafish after ROSI treatment. B Inhibition of ROSI on the transcription of zebrafish acsl4a gene. C Inhibition of ROSI on the transcription of zebrafish lip gene. D Survival rate of zebrafish after ROSI treatment. E Phenotypic classification of zebrafish after ROSI treatment. Data were given as means ± standard deviation. All figures are representative of three biological replicates (per test n = 100). ***, P < 0.001; **, P < 0.01; *, 0.01 < P < 0.05
Fig. 8
Fig. 8
Network visualization of key signaling and lip regulatory modules implicated in ferroptosis. The gene regulatory network comprises the following circuits (in chronological order of execution): 1. Iron overload; 2. Lipid peroxidation 3. Ferroptosis and 4. Mitochondrial damage and pericardial edema. Full protein names of the nodes in this network are as follows: TF: transferrin, TFR: transferrin receptor, ACSL4: acyl-CoA synthetase long chain family member 4

Similar articles

Cited by

References

    1. Cooper MD, Alder MN. The evolution of adaptive immune systems (2006) Cell. 2006;124(4):815–822. doi: 10.1016/j.cell.2006.02.001. - DOI - PubMed
    1. Parker HJ, Bronner ME, Krumlauf R. A Hox regulatory network of hindbrain segmentation is conserved to the base of vertebrates. Nature. 2014;514(7523):490–493. doi: 10.1038/nature13723. - DOI - PMC - PubMed
    1. Pang Y, Gou M, Yang K, et al. Crystal structure of a cytocidal protein from lamprey and its mechanism of action in the selective killing of cancer cells. Cell Commun Signal. 2019;17(1):54. doi: 10.1186/s12964-019-0358-y. - DOI - PMC - PubMed
    1. Pang Y, Li C, Wang S, et al. A novel protein derived from lamprey supraneural body tissue with efficient cytocidal actions against tumor cells. Cell Commun Signal. 2017;15(1):42. doi: 10.1186/s12964-017-0198-6. - DOI - PMC - PubMed
    1. Jia N, Liu N, Cheng W, et al. Structural basis for receptor recognition and pore formation of a zebrafish aerolysin-like protein. EMBO Rep. 2016;17:235–248. doi: 10.15252/embr.201540851. - DOI - PMC - PubMed

Publication types

LinkOut - more resources