Review
. 2022 Dec;97(6):2209-2236.
doi: 10.1111/brv.12890. Epub 2022 Aug 17.

Acoustic indices as proxies for biodiversity: a meta-analysis

Affiliations
Review

Acoustic indices as proxies for biodiversity: a meta-analysis

Irene Alcocer et al. Biol Rev Camb Philos Soc. 2022 Dec.

Abstract

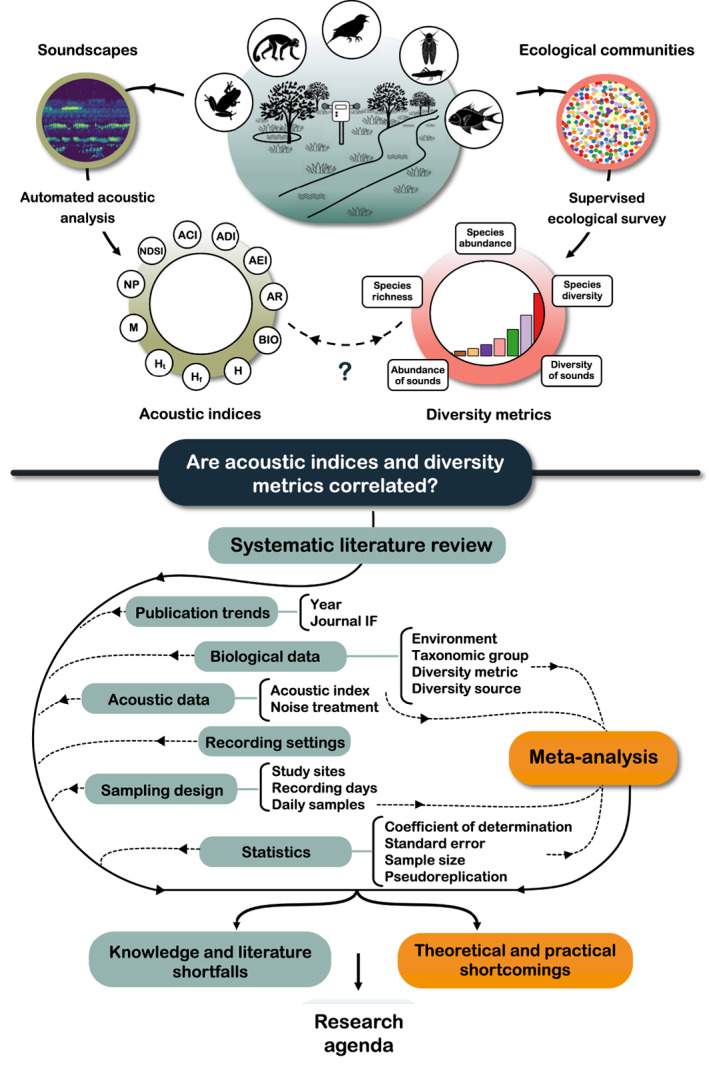
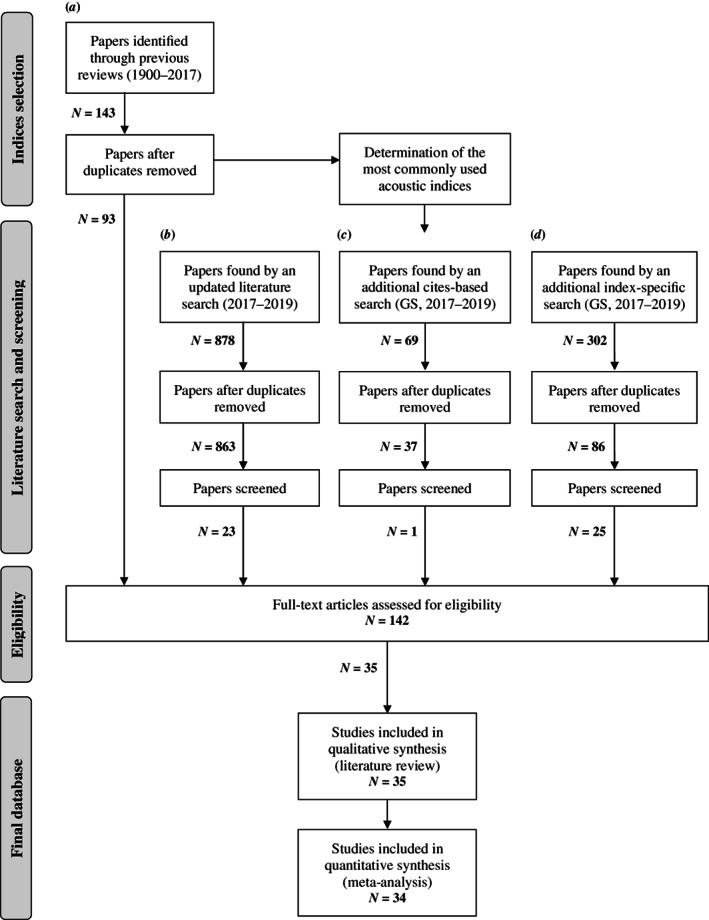
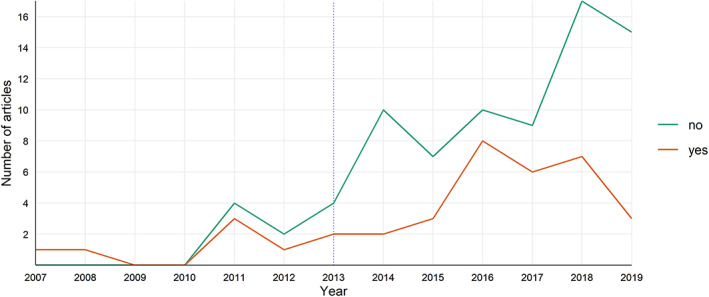
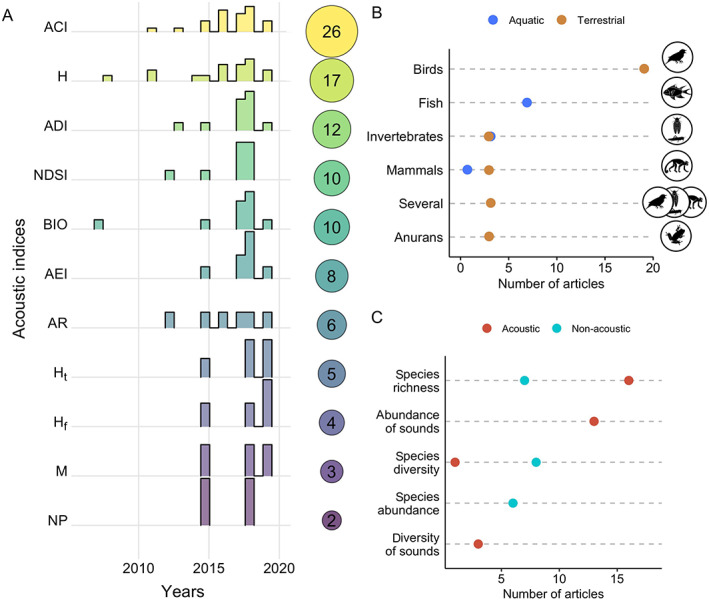
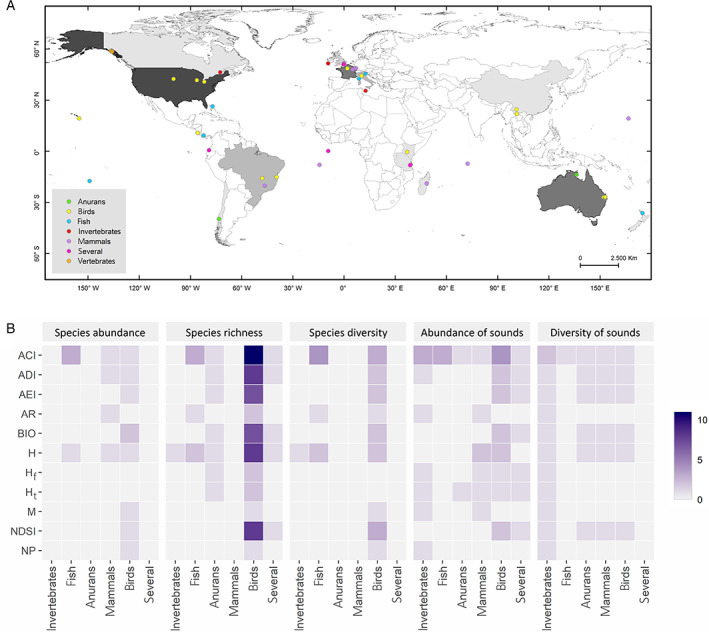
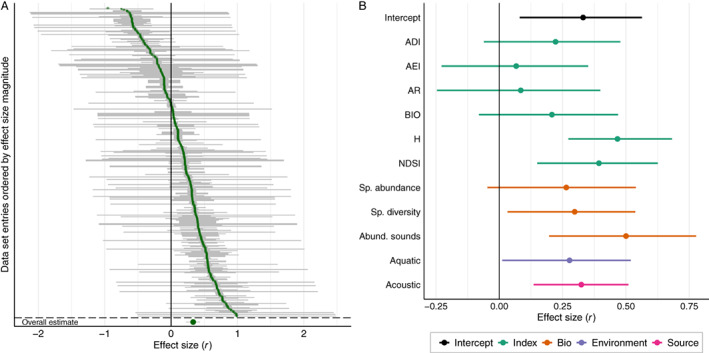
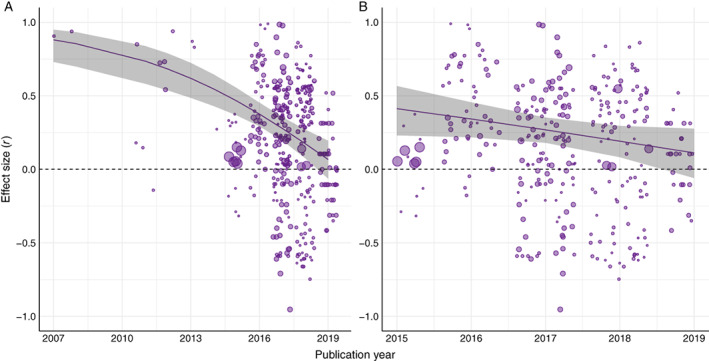
As biodiversity decreases worldwide, the development of effective techniques to track changes in ecological communities becomes an urgent challenge. Together with other emerging methods in ecology, acoustic indices are increasingly being used as novel tools for rapid biodiversity assessment. These indices are based on mathematical formulae that summarise the acoustic features of audio samples, with the aim of extracting meaningful ecological information from soundscapes. However, the application of this automated method has revealed conflicting results across the literature, with conceptual and empirical controversies regarding its primary assumption: a correlation between acoustic and biological diversity. After more than a decade of research, we still lack a statistically informed synthesis of the power of acoustic indices that elucidates whether they effectively function as proxies for biological diversity. Here, we reviewed studies testing the relationship between diversity metrics (species abundance, species richness, species diversity, abundance of sounds, and diversity of sounds) and the 11 most commonly used acoustic indices. From 34 studies, we extracted 364 effect sizes that quantified the magnitude of the direct link between acoustic and biological estimates and conducted a meta-analysis. Overall, acoustic indices had a moderate positive relationship with the diversity metrics (r = 0.33, CI [0.23, 0.43]), and showed an inconsistent performance, with highly variable effect sizes both within and among studies. Over time, studies have been increasingly disregarding the validation of the acoustic estimates and those examining this link have been progressively reporting smaller effect sizes. Some of the studied indices [acoustic entropy index (H), normalised difference soundscape index (NDSI), and acoustic complexity index (ACI)] performed better in retrieving biological information, with abundance of sounds (number of sounds from identified or unidentified species) being the best estimated diversity facet of local communities. We found no effect of the type of monitored environment (terrestrial versus aquatic) and the procedure for extracting biological information (acoustic versus non-acoustic) on the performance of acoustic indices, suggesting certain potential to generalise their application across research contexts. We also identified common statistical issues and knowledge gaps that remain to be addressed in future research, such as a high rate of pseudoreplication and multiple unexplored combinations of metrics, taxa, and regions. Our findings confirm the limitations of acoustic indices to efficiently quantify alpha biodiversity and highlight that caution is necessary when using them as surrogates of diversity metrics, especially if employed as single predictors. Although these tools are able partially to capture changes in diversity metrics, endorsing to some extent the rationale behind acoustic indices and suggesting them as promising bases for future developments, they are far from being direct proxies for biodiversity. To guide more efficient use and future research, we review their principal theoretical and practical shortcomings, as well as prospects and challenges of acoustic indices in biodiversity assessment. Altogether, we provide the first comprehensive and statistically based overview on the relation between acoustic indices and biodiversity and pave the way for a more standardised and informed application for biodiversity monitoring.

Keywords: biodiversity assessment; ecoacoustics; ecological indicators; ecology; monitoring; soundscape; species diversity; systematic review.


Figures

Fig. 1
Fig. 1
Conceptual figure outlining this review. For definitions of acoustic indices see Table 2. IF, impact factor.
Fig. 2
Fig. 2
Procedures used in the literature search for articles addressing acoustic indices and diversity metrics, and the number of papers identified at each step. The literature reviews used in (a) were: Sueur et al. (2014), Buxton et al. (2018b ), and Sugai et al. (2019). The literature search in (b) was conducted in Thompson's ISI Web of Science, restricted to 2017–2019 and to nine subject areas, and was based on the key words used in Buxton et al. (2018b ). Literature searches in (c) and (d) were conducted in Google Scholar (GS), restricted to 2017–2019, and based on literature that cited the articles identified in (b) and index‐specific citations (d), respectively.
Fig. 3
Fig. 3
Trends (2007–2019) in publication and data validation, from a total of 142 articles. Articles that correlated the acoustic indices with real biological data are represented by an orange line and studies that did not correlate acoustic indices with such data are shown with a green line.
Fig. 4
Fig. 4
Summary of the data extracted from 35 articles identified in the systematic literature search. (A) Number of published articles per year using different acoustic indices; the sizes of the bubbles on the right represent the number of papers and the distribution of columns on each row is the frequency distribution of published articles over time, relative to the total per index (i.e. the number inside the bubble). (B) Number of articles per studied taxon in the aquatic (blue) or terrestrial (brown) environment. (C) Number of articles per diversity metric and source of data extraction (acoustic or non‐acoustic). For definitions of acoustic indices see Table 2.
Fig. 5
Fig. 5
(A) The geographic distribution of the study sites corresponding to the 35 studies used in the systematic literature review. The colouring of countries exhibits a white to black gradient relative to the number of studies contributed by each country. The coloured dots discriminate between the different taxa studied. (B) Distribution of the number of articles by diversity metric, taxon and acoustic index studied (see Table 2 for definitions), from the 35 studies included in the literature review.
Fig. 6
Fig. 6
Meta‐analysis results. (A) Pearson correlation effect sizes (r) in ascending order of magnitude from all data set entries. Effect sizes larger than 0 (vertical line) represent a positive correlation between acoustic indices and diversity. Effect sizes below 0 indicate a negative correlation between acoustic indices and diversity. Above the dashed horizontal line, the green circles are effect sizes means, with corresponding 95% confidence intervals (grey horizontal lines). Below the dashed line, the green circle is the overall effect size, with a corresponding 95% confidence interval, obtained from the intercept‐only meta‐analysis. (B) Mean estimates (circles) and corresponding 95% confidence intervals (horizontal lines) represented as Pearson correlation (r) effect sizes. Each estimate (except the intercept) corresponds to the additive effect of each coefficient as obtained with the predict_rma function from metafor R package. Estimated effect sizes whose 95% confidence intervals do not overlap zero (black vertical line) indicate a positive correlation between acoustic indices and diversity if they are to the right of zero, or a negative correlation if they are to the left of zero. Moderators are acoustic indices (Index), diversity metrics (Bio), environment (Environment) and acoustic source (Source). See Table 2 for definitions of acoustic indices.
Fig. 7
Fig. 7
Funnel plot (dashed triangle) showing the relationship between model residuals from the meta‐regression model and effect size standard error. Absence of publication bias is represented by a scattered and symmetric distribution of values (circles) within the funnel. We tested funnel plot symmetry with Egger's regression and failed to reject the null hypothesis of funnel symmetry (p = 0.51).
Fig. 8
Fig. 8
Relationship between reported mean effect sizes and publication year. Circle size indicates the relative sample size for each effect size. The fitted line is a meta‐regression over the year of publication with the corresponding 95% confidence interval region shaded grey. The dashed horizontal line represents an effect size of 0. Effect size mean values are positioned along the publication year axis with minor random noise to reduce overlapping. (A) Relationship between effect size and publication year for the entire data set (2007–2019), corresponding to all literature identified up to 2019 assessing the performance of acoustic indices as proxies for biodiversity. Model statistics in Pearson correlation (r), intercept 1.00 [1.00, 1.00], slope –0.11 [−0.15, −0.06], estimate [CI]. The computed model is a linear model using Fisher's Z as effect size. The transformation from Fisher's Z unbounded values to Pearson correlation values bounded between −1 and 1 creates the curved pattern for larger effect sizes. (B) Relationship for the subset of effect sizes published between 2015 and 2019 (inclusive) during which there was a prominent rise in publications (see Fig. 3). Model statistics in Pearson correlation (r), intercept 1.00 [−0.29, 1.00], slope –0.08 [−0.16, 0.00], estimate [CI].

References

    1. Bellisario, K. M. , Broadhead, T. , Savage, D. , Zhao, Z. , Omrani, H. , Zhang, S. , Springer, J. & Pijanowski, B. C. (2019). Contributions of MIR to soundscape ecology. Part 3: tagging and classifying audio features using a multi‐labeling k‐nearest neighbor approach. Ecological Informatics 51, 103–111.
    1. Bence, J. R. (1995). Analysis of short time series: correcting for autocorrelation. Ecology 76, 628–639.
    1. * Bertucci, F. , Parmentier, E. , Lecellier, G. , Hawkins, A. D. & Lecchini, D. (2016). Acoustic indices provide information on the status of coral reefs: an example from Moorea Island in the South Pacific. Scientific Reports 6, 33326. - PMC - PubMed
    1. Bibby, C. J. , Burgess, N. D. , Hillis, D. , Hill, D. & Mustoe, S. (1992). Bird Census Techniques. Academic Press, London.
    1. Bird, G. , Kaczvinsky, C. , Wilson, A. E. & Hardy, N. B. (2019). When do herbivorous insects compete? A phylogenetic meta‐analysis. Ecology Letters 22(5), 875–883. - PubMed