. 2022 Nov;28(22):6586-6601.
doi: 10.1111/gcb.16371. Epub 2022 Aug 17.

Recommendations for quantifying and reducing uncertainty in climate projections of species distributions

Affiliations

Recommendations for quantifying and reducing uncertainty in climate projections of species distributions

Stephanie Brodie et al. Glob Chang Biol. 2022 Nov.

Abstract

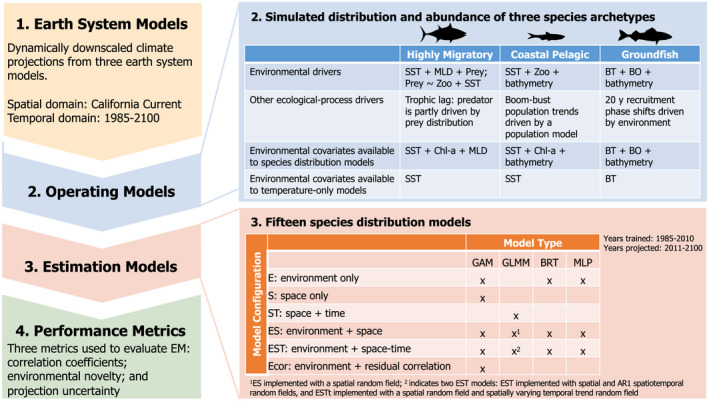
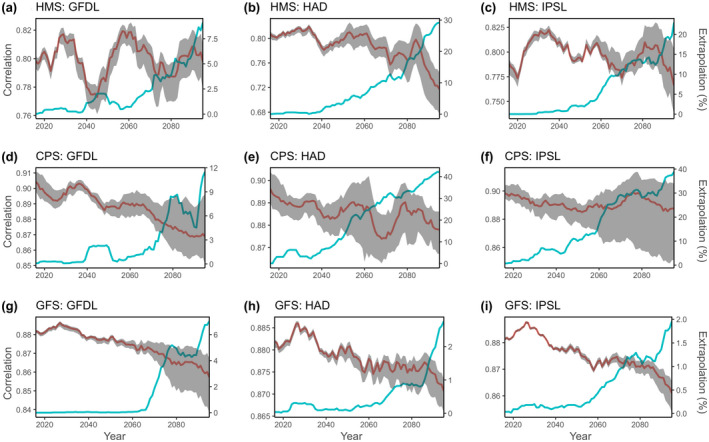
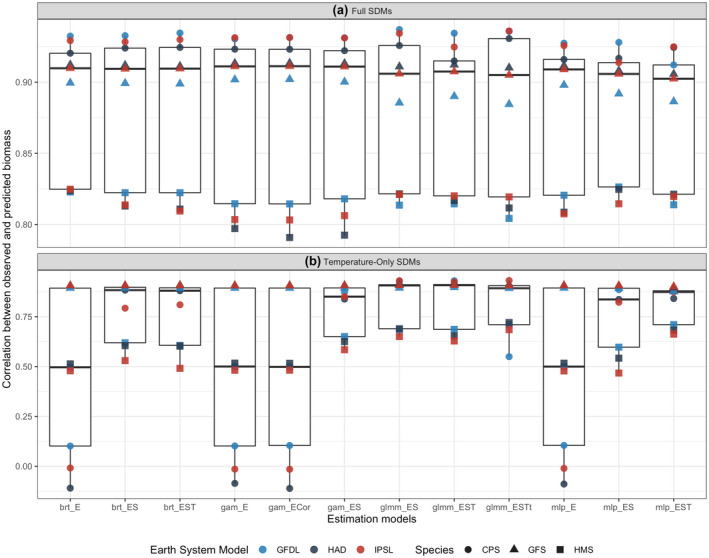
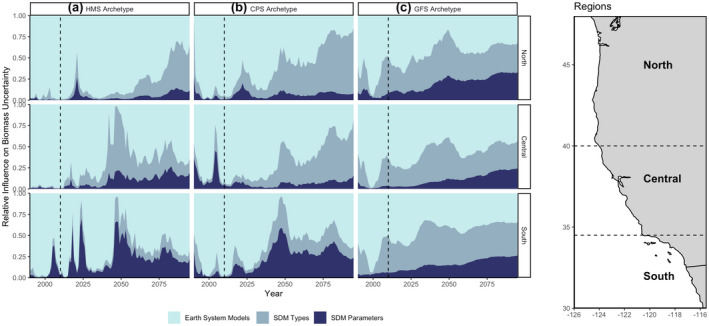
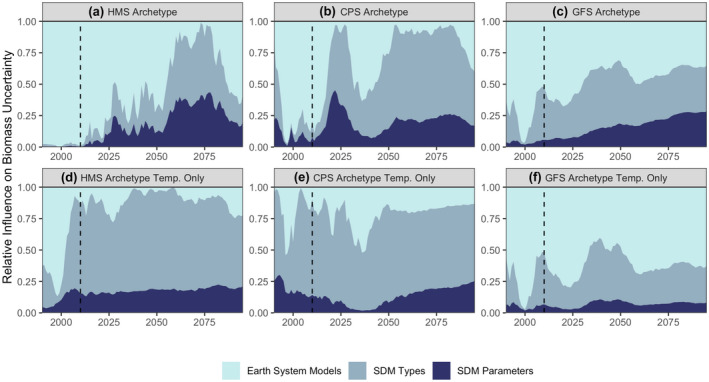
Projecting the future distributions of commercially and ecologically important species has become a critical approach for ecosystem managers to strategically anticipate change, but large uncertainties in projections limit climate adaptation planning. Although distribution projections are primarily used to understand the scope of potential change-rather than accurately predict specific outcomes-it is nonetheless essential to understand where and why projections can give implausible results and to identify which processes contribute to uncertainty. Here, we use a series of simulated species distributions, an ensemble of 252 species distribution models, and an ensemble of three regional ocean climate projections, to isolate the influences of uncertainty from earth system model spread and from ecological modeling. The simulations encompass marine species with different functional traits and ecological preferences to more broadly address resource manager and fishery stakeholder needs, and provide a simulated true state with which to evaluate projections. We present our results relative to the degree of environmental extrapolation from historical conditions, which helps facilitate interpretation by ecological modelers working in diverse systems. We found uncertainty associated with species distribution models can exceed uncertainty generated from diverging earth system models (up to 70% of total uncertainty by 2100), and that this result was consistent across species traits. Species distribution model uncertainty increased through time and was primarily related to the degree to which models extrapolated into novel environmental conditions but moderated by how well models captured the underlying dynamics driving species distributions. The predictive power of simulated species distribution models remained relatively high in the first 30 years of projections, in alignment with the time period in which stakeholders make strategic decisions based on climate information. By understanding sources of uncertainty, and how they change at different forecast horizons, we provide recommendations for projecting species distribution models under global climate change.

Keywords: artificial intelligence; climate change; earth system models; extrapolation; fisheries; machine learning; species distribution models; virtual species.


Conflict of interest statement

The authors declare no conflicts of interest.

Figures

FIGURE 1
FIGURE 1
Stepwise conceptual outline of the modeling approach. In step 1, three downscaled earth system models are used as environmental forcing. In step 2, operating models are created for three species archetypes, with a breakout table indicating the ecological and environmental drivers used for each species. In step 3, 15 species distribution models are built for each species archetype, with environmental covariates corresponding to those in step 2. In step 4, three performance metrics are used to compare models (n = 252 models) and answer our four study questions. Acronyms in step 2 correspond to sea surface temperature (SST), mixed layer depth (MLD), zooplankton (zoo), bottom temperature (BT), and chlorophyll a (Chl‐a); and in step 3 correspond to generalized additive model (GAM), generalized linear mixed model (GLMM), boosted regression tree (BRT), and multilayer perceptron (MLP).
FIGURE 2
FIGURE 2
Maps and time series of dynamically downscaled environmental covariates projected to 2100. Maps (~10 km resolution) show the average historical spring conditions from 1985 to 2010 averaged across the downscaled HAD, GFDL, and IPSL earth system models (RCP8.5). Time series show the spatially averaged annual spring conditions (1985–2100) for each earth system model. The domain for (a, b) mixed layer depth, (e, f) sea surface temperature, and (i, j) 200 m integrated zooplankton reflects the ROMS extent, whereas the domain for (c, d) bottom oxygen, (g, h) bottom temperature, and (k, l) 50 m integrated zooplankton is limited to the inshore area to match species operating model domain. An 11‐year running mean is applied to the time series.
FIGURE 3
FIGURE 3
Simulated biomass distributions for highly migratory (HMS), coastal pelagic (CPS), and groundfish (GFS) species archetypes averaged from 1985 to 2010 (a–c) and the spatially explicit difference (future minus historical) in biomass averaged from projections for 2075–2100 (d–f). All results are averaged across earth system models.
FIGURE 4
FIGURE 4
Annual correlation coefficient between simulated and estimated biomass (red line is ensemble mean) for three species archetypes (HMS: highly migratory species (a–c); CPS: coastal pelagic species (d–f); GFS: groundfish species (g‐i)) and three earth system models (HAD, GFDL, IPSL). Blue line shows the percent of environmental extrapolation experienced by SDMs, with extrapolation relative to the 1985–2010 training period. The ensemble mean of 12 estimation models is shown in red (ensemble mean does not include three SDMs that were considered to have poor performance over the projection period: GAM_S, GAM_EST, GLMM_ST). Grey shading indicates the maximum and minimum correlations from the 12 estimation models, and an 11‐year running mean was applied to the correlation and extrapolation time series. Note y‐axes differ among plots.
FIGURE 5
FIGURE 5
Correlation coefficients between simulated and estimated biomass for each species distribution model (a), showing loss of performance in the temperature‐only experiment (b). Correlations were calculated for projection period only (2011–2100). Colors represent the three earth system models, while symbols representing the three species archetypes. The ensemble mean across SDMs is shown. See Table S2 for description of SDMs. Note different y‐axis in each plot.
FIGURE 6
FIGURE 6
Relative uncertainty in biomass predictions for each region (north, central, south) and species archetype: (a) HMS, (b) CPS, (c) GFS. Uncertainty is partitioned across earth systems models, SDM type, and SDM parameterization. Dashed vertical line indicates when projections start. An 11‐year running mean was applied. Map on the right shows regions of the California current system.
FIGURE 7
FIGURE 7
Relative uncertainty in biomass predictions for each species archetype (integrating the three regions in Figure 6), for SDMs parameterized with all environmental variables (a–c), and with temperature only (d–f). Uncertainty is partitioned across earth systems models, SDM type, and SDM parameterization. Dashed vertical line indicates when projections start. An 11‐year running mean was applied.

References

    1. Barnes, C. L. , Essington, T. E. , Pirtle, J. L. , Rooper, C. N. , Laman, E. A. , Holsman, K. K. , Aydin, K. Y. , & Thorson, J. T. (2022). Climate‐informed models benefit hindcasting but present challenges when forecasting species–habitat associations. Ecography, e06189. 10.1111/ecog.06189 - DOI
    1. Barnett, L. A. K. , Ward, E. J. , & Anderson, S. C. (2021). Improving estimates of species distribution change by incorporating local trends. Ecography, 44(3), 427–439. 10.1111/ecog.05176 - DOI
    1. Beaumont, L. J. , Hughes, L. , & Pitman, A. J. (2008). Why is the choice of future climate scenarios for species distribution modelling important? Ecology Letters, 11(11), 1135–1146. 10.1111/j.1461-0248.2008.01231.x - DOI - PubMed
    1. Bouchet, P. J. , Miller, D. L. , Roberts, J. J. , Mannocci, L. , Harris, C. M. , & Thomas, L. (2020). Dsmextra: Extrapolation assessment tools for density surface models. Methods in Ecology and Evolution, 11(11), 1464–1469. 10.1111/2041-210X.13469 - DOI
    1. Briscoe, N. J. , Elith, J. , Salguero‐Gómez, R. , Lahoz‐Monfort, J. J. , Camac, J. S. , Giljohann, K. M. , Holden, M. H. , Hradsky, B. A. , Kearney, M. R. , & McMahon, S. M. (2019). Forecasting species range dynamics with process‐explicit models: Matching methods to applications. Ecology Letters, 22(11), 1940–1956. - PubMed