

Correlation between hepatorenal index and attenuation imaging for assessing hepatic steatosis
- PMID: 35978731
- PMCID: PMC9351430
- DOI: 10.1002/ajum.12297
Correlation between hepatorenal index and attenuation imaging for assessing hepatic steatosis
Erratum in
-
Corrigendum.Australas J Ultrasound Med. 2022 Oct 5;25(4):210. doi: 10.1002/ajum.12323. eCollection 2022 Nov. Australas J Ultrasound Med. 2022. PMID: 36405793 Free PMC article.
Abstract
Introduction: Hepatic steatosis screening is required to assess high-risk populations, identify those for intervention, monitor response and prevent disease progression and complications. Liver biopsy and magnetic resonance imaging proton density fat fraction are current gold standards, but are limited by biopsy risk factors, patient tolerance and cost. Non-invasive, cost-effective, semi-quantitative and quantitative ultrasound assessment exists. The aim of this study was to assess the correlation between the semi-quantitative hepatorenal index (HRI) to assess hepatic steatosis using the quantitative attenuation imaging (ATI) as a reference standard, in adults with varied suspected liver pathologies.
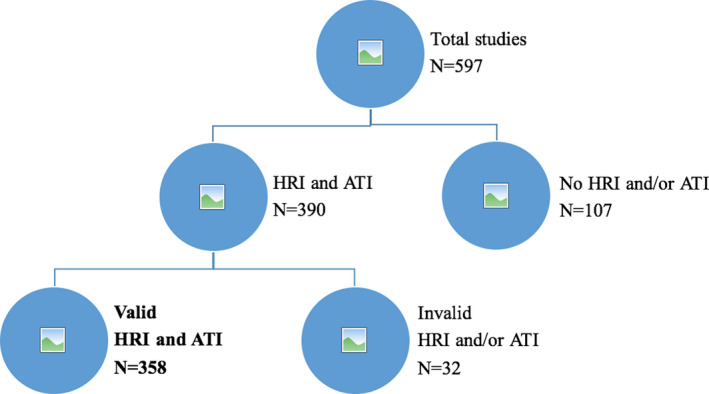
Methods: Data were collected prospectively between April 2019 and March 2020 at a tertiary institution on any patient >18 years referred to US assessment of suspected liver pathology. The only exclusion criteria were absent or invalid HRI or ATI measurements. Three hundred fifty eight patients were included.
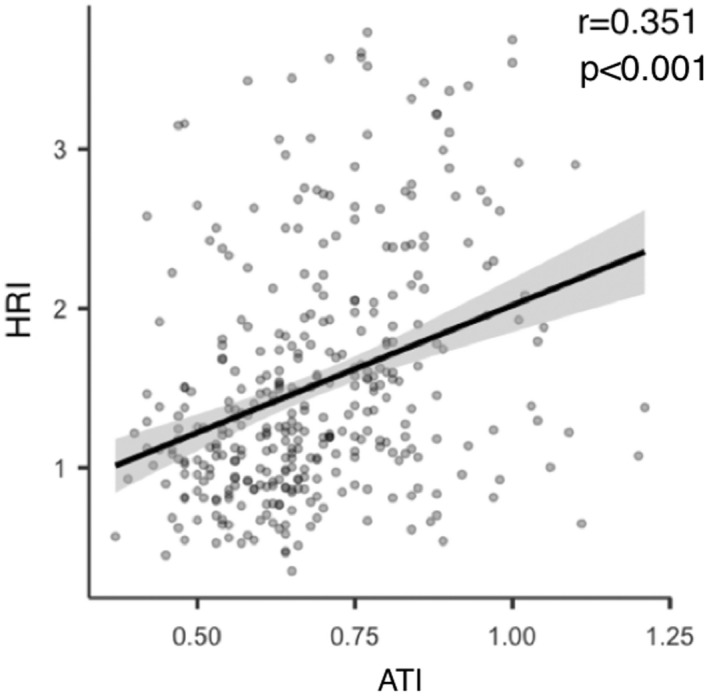
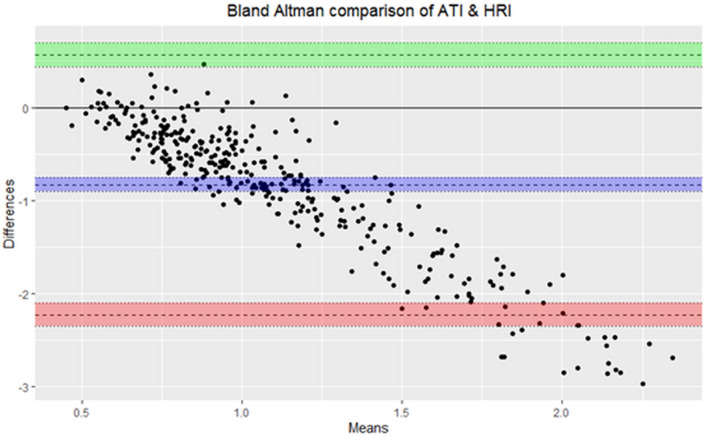
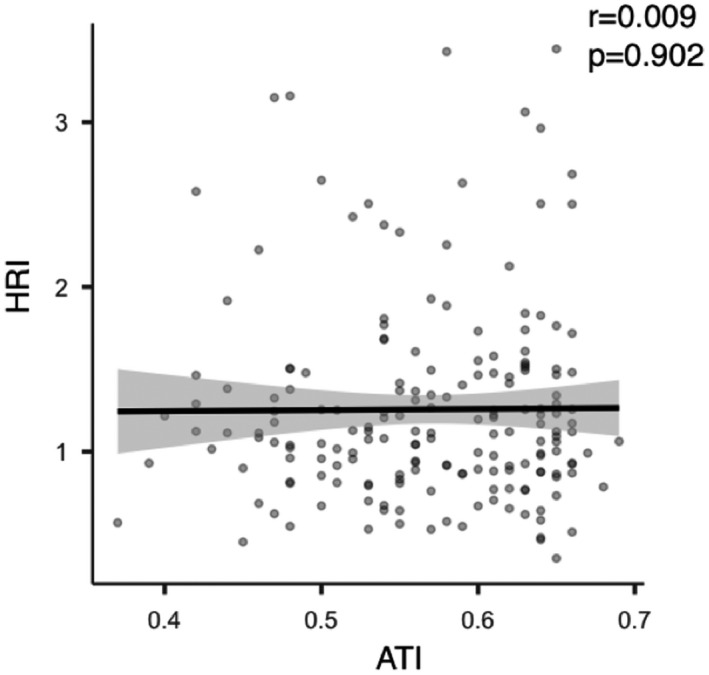
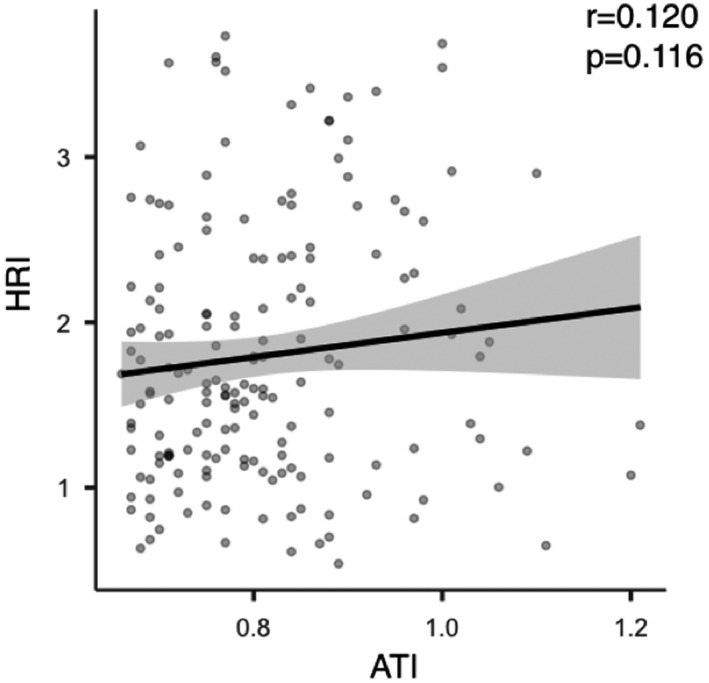
Results: There was a significant weak positive correlation between HRI and ATI (r = 0.351, P < 0.001) and between HRI steatosis grade (SG) and ATI SG (r = 0.329, P < 0.001), using previously established cut-off values. With ATI as the reference standard, there was no significant correlation between HRI and hepatic steatosis within steatosis grades, nor for no (SG = 0) or any (SG > 0) hepatic steatosis.
Conclusions: Our study in a typical heterogeneous clinical population suggests the semi-quantitative HRI is of limited use in hepatic steatosis imaging. As HRI is the objective measure of the subjective brightness (B)-mode assessment, this imaging feature may not be as reliable as previously thought. Quantitative ATI may be the preferred non-invasive technique for hepatic steatosis assessment.
Keywords: attenuation imaging; hepatic steatosis; hepatorenal index; steatosis grade.
© 2022 Australasian Society for Ultrasound in Medicine.
Conflict of interest statement
No authors received financial support or have company relationships/agreements to declare.
Figures


Similar articles
-
Evaluation of Artificial Intelligence-Calculated Hepatorenal Index for Diagnosing Mild and Moderate Hepatic Steatosis in Non-Alcoholic Fatty Liver Disease.Medicina (Kaunas). 2023 Feb 27;59(3):469. doi: 10.3390/medicina59030469. Medicina (Kaunas). 2023. PMID: 36984470 Free PMC article.
-
Reliability of ultrasound hepatorenal index and magnetic resonance imaging proton density fat fraction techniques in the diagnosis of hepatic steatosis, with magnetic resonance spectroscopy as the reference standard.PLoS One. 2021 Aug 12;16(8):e0255768. doi: 10.1371/journal.pone.0255768. eCollection 2021. PLoS One. 2021. PMID: 34383812 Free PMC article.
-
Diagnostic performance of ultrasound hepatorenal index for the diagnosis of hepatic steatosis in children.Pediatr Radiol. 2022 Jun;52(7):1306-1313. doi: 10.1007/s00247-022-05313-x. Epub 2022 Mar 1. Pediatr Radiol. 2022. PMID: 35229183
-
Revisiting the Hepatorenal Index in the Quantification of Hepatic Steatosis: How it is done and the utility.Ultrasound Q. 2024 Jun 18;40(3):e00681. doi: 10.1097/RUQ.0000000000000681. eCollection 2024 Sep 1. Ultrasound Q. 2024. PMID: 38889400 Review.
-
Quantitative assessment of fatty liver using ultrasound attenuation imaging.J Med Ultrason (2001). 2021 Oct;48(4):465-470. doi: 10.1007/s10396-021-01132-z. Epub 2021 Aug 27. J Med Ultrason (2001). 2021. PMID: 34453237 Review.
Cited by
-
Corrigendum.Australas J Ultrasound Med. 2022 Oct 5;25(4):210. doi: 10.1002/ajum.12323. eCollection 2022 Nov. Australas J Ultrasound Med. 2022. PMID: 36405793 Free PMC article.
-
Methodology exploration and reproducibility evaluation of TAI and TSI for quantitative ultrasound assessment of hepatic steatosis.Heliyon. 2024 May 24;10(11):e31904. doi: 10.1016/j.heliyon.2024.e31904. eCollection 2024 Jun 15. Heliyon. 2024. PMID: 38845969 Free PMC article.
-
Ultrasound research - Sometimes you win, sometimes you lose.Australas J Ultrasound Med. 2022 Aug 4;25(3):105-106. doi: 10.1002/ajum.12310. eCollection 2022 Aug. Australas J Ultrasound Med. 2022. PMID: 35978729 Free PMC article. No abstract available.
References
-
- Bedogni G, Miglioli L, Masutti F, Castiglione A, Croce LS, Tiribelli C, et al. Incidence and natural course of fatty liver in the general population: the Dionysos study. Hepatology 2007; 46: 1387–91. - PubMed
-
- Barr RG. Ultrasound of diffuse liver disease including elastography. Radiologic Clinics 2019; 57(3): 549–62. - PubMed
LinkOut - more resources
Full Text Sources
Research Materials
Miscellaneous