

CRISPRi - mediated suppression of E. coli Nissle 1917 virulence factors: A strategy for creating an engineered probiotic using csgD gene suppression
- PMID: 35978963
- PMCID: PMC9376613
- DOI: 10.3389/fnut.2022.938989
CRISPRi - mediated suppression of E. coli Nissle 1917 virulence factors: A strategy for creating an engineered probiotic using csgD gene suppression
Abstract
Background: Biofilm formation is a complex phenomenon, and it is the causative agent of several human infections. Bacterial amyloids are involved in biofilm formation leading to infection persistence. Due to antibiotic resistance, their treatment is a great challenge for physicians. Probiotics, especially E. coli Nissle 1917 (EcN), are used to treat human intestinal disorders and ulcerative colitis. It also expresses virulence factors associated with biofilm and amyloid formation. EcN produces biofilm equivalent to the pathogenic UPEC strains.
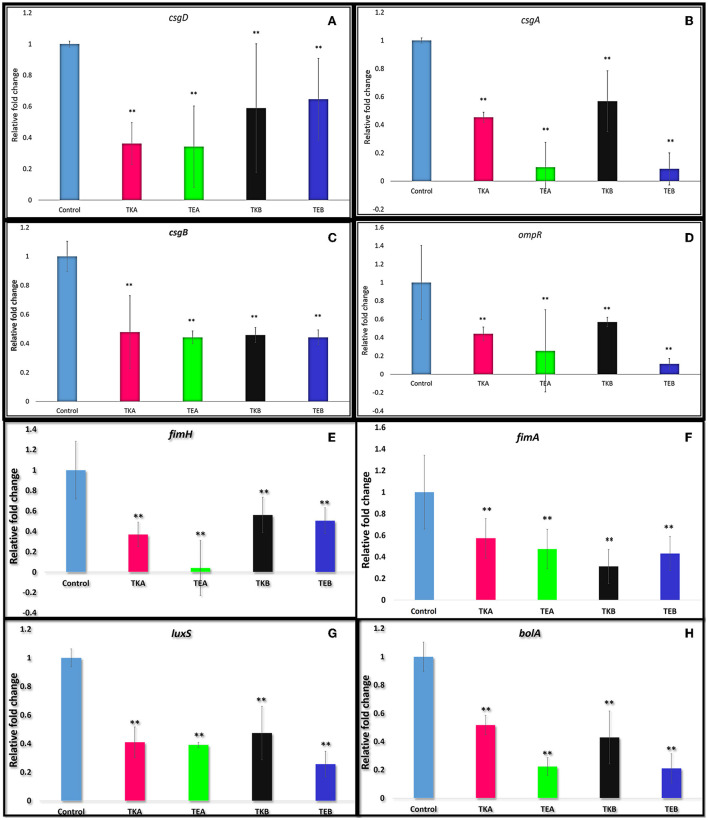
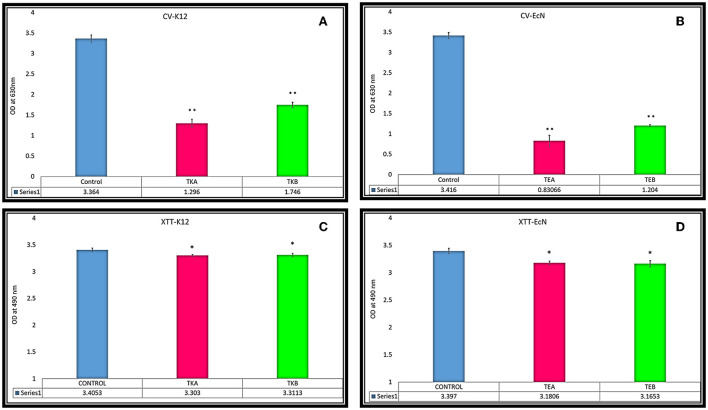
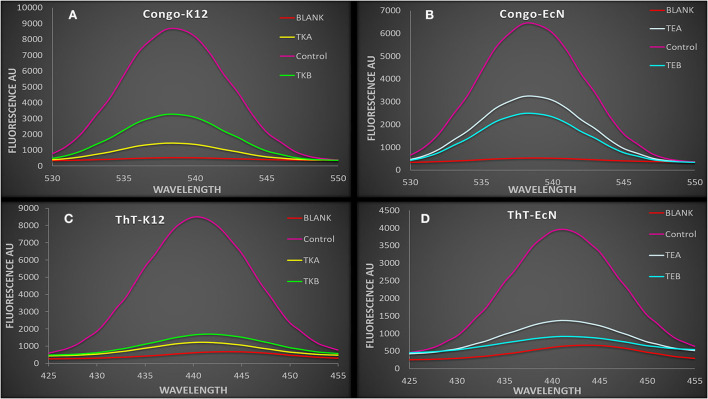
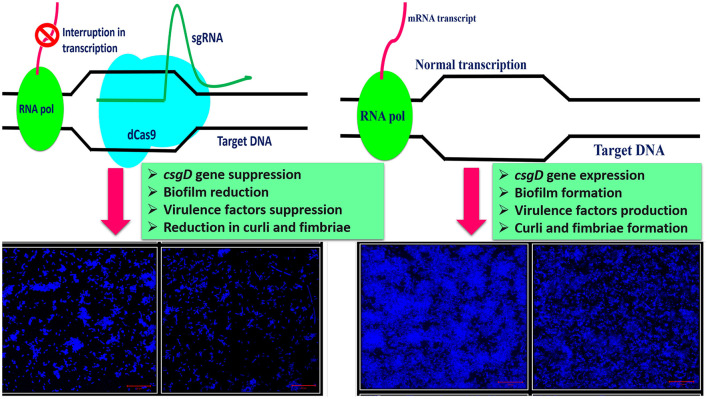
Methods: CRISPRi was used to create the knockdown mutants of the csgD gene (csgD-KD). The qRT-PCR was performed to assess the expression of the csgD gene in csgD-KD cells. The csgD-KD cells were also evaluated for the expression of csgA, csgB, fimA, fimH, ompR, luxS, and bolA genes. The gene expression data obtained was further confirmed by spectroscopic, microscopic, and other assays to validate our study.
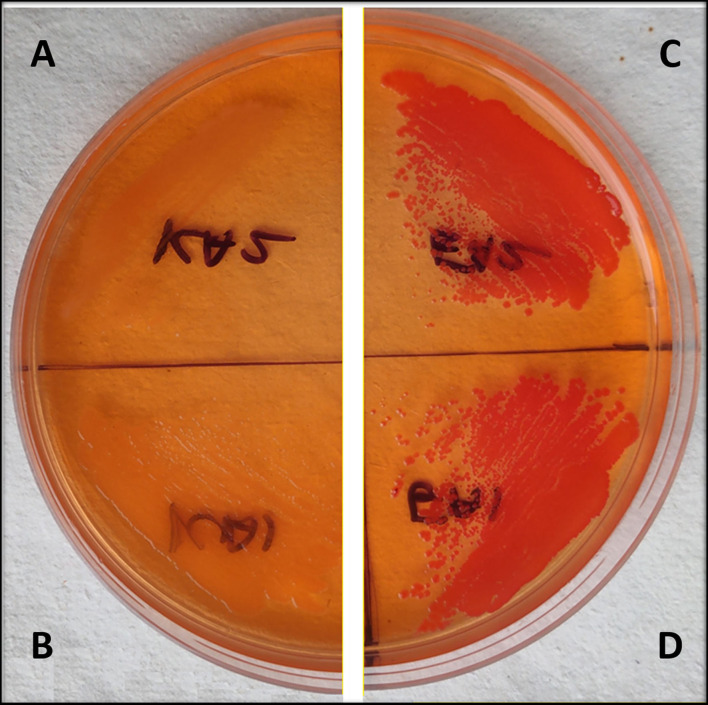
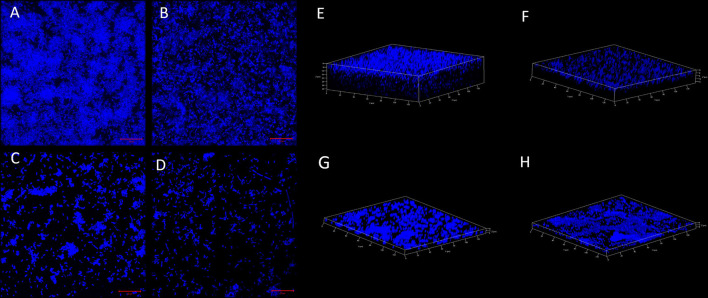
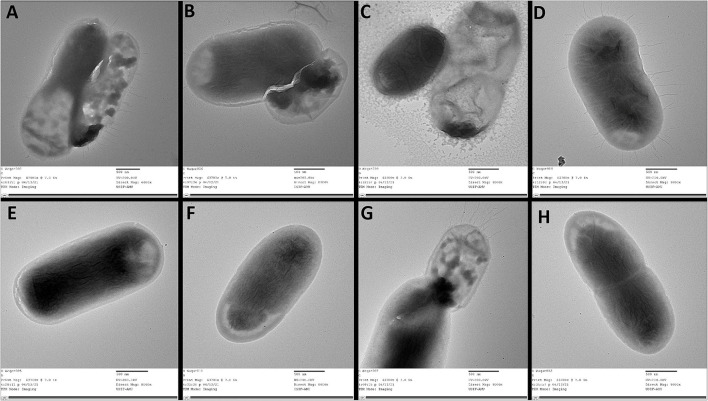
Results: CRISPRi-mediated knockdown of csgD gene shows reduction in curli amyloid formation, biofilm formation, and suppression of genes (csgA, csgB, fimA, fimH, ompR, bolA, and luxS) involved in virulence factors production.
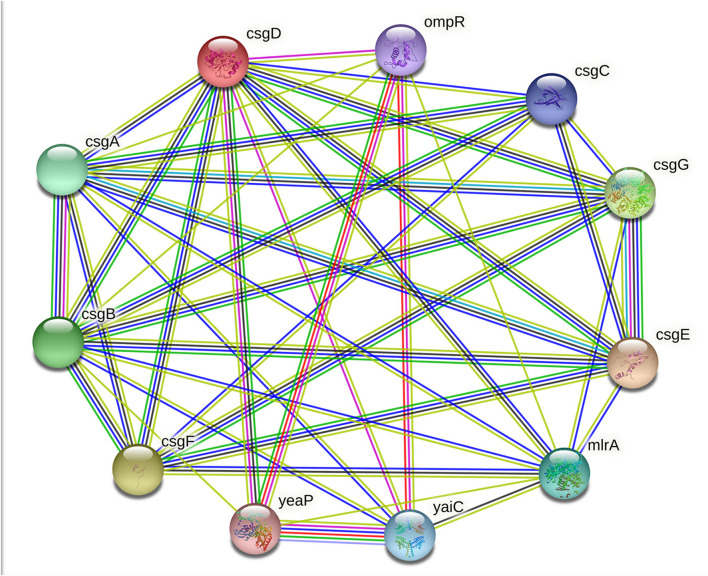
Conclusion: Curli amyloid fibers and fimbriae fibers play a critical role in biofilm formation leading to pathogenicity. CsgD protein is the master regulator of curli synthesis in E. coli. Hence, curli amyloid inhibition through the csgD gene may be used to improve the EcN and different probiotic strains by suppressing virulence factors.
Keywords: CRISPRi; E. coli; bacterial amyloids; biofilm; csgD; curli; dCas9; probiotic.
Copyright © 2022 Azam and Khan.
Conflict of interest statement
The authors declare that the research was conducted in the absence of any commercial or financial relationships that could be construed as a potential conflict of interest.
Figures
Similar articles
-
bolA gene involved in curli amyloids and fimbriae production in E. coli: exploring pathways to inhibit biofilm and amyloid formation.J Biol Res (Thessalon). 2020 Jun 17;27:10. doi: 10.1186/s40709-020-00120-7. eCollection 2020 Dec. J Biol Res (Thessalon). 2020. PMID: 32566535 Free PMC article.
-
CsgI (YccT) Is a Novel Inhibitor of Curli Fimbriae Formation in Escherichia coli Preventing CsgA Polymerization and Curli Gene Expression.Int J Mol Sci. 2023 Feb 22;24(5):4357. doi: 10.3390/ijms24054357. Int J Mol Sci. 2023. PMID: 36901788 Free PMC article.
-
The Catabolite Repressor Protein-Cyclic AMP Complex Regulates csgD and Biofilm Formation in Uropathogenic Escherichia coli.J Bacteriol. 2016 Nov 18;198(24):3329-3334. doi: 10.1128/JB.00652-16. Print 2016 Dec 15. J Bacteriol. 2016. PMID: 27698083 Free PMC article.
-
Identification of novel biofilm genes in avian pathogenic Escherichia coli by Tn5 transposon mutant library.World J Microbiol Biotechnol. 2022 Jun 11;38(8):130. doi: 10.1007/s11274-022-03314-4. World J Microbiol Biotechnol. 2022. PMID: 35688968 Review.
-
CsgD regulatory network in a bacterial trait-altering biofilm formation.Emerg Microbes Infect. 2014 Jan;3(1):e1. doi: 10.1038/emi.2014.1. Epub 2014 Jan 8. Emerg Microbes Infect. 2014. PMID: 26038492 Free PMC article. Review.
Cited by
-
Potential antiviral effects of the marine probiotic Paraliobacillus zengyii on the respiratory syncytial virus.mLife. 2025 Jun 18;4(3):249-258. doi: 10.1002/mlf2.70015. eCollection 2025 Jun. mLife. 2025. PMID: 40600055 Free PMC article.
-
Molecular and Genetic Characterization of Colicinogenic Escherichia coli Strains Active against Shiga Toxin-Producing Escherichia coli O157:H7.Foods. 2023 Jul 11;12(14):2676. doi: 10.3390/foods12142676. Foods. 2023. PMID: 37509768 Free PMC article.
-
Minimizing endogenous cryptic plasmids to construct antibiotic-free expression systems for Escherichia coli Nissle 1917.Synth Syst Biotechnol. 2024 Jan 25;9(1):165-175. doi: 10.1016/j.synbio.2024.01.006. eCollection 2024 Mar. Synth Syst Biotechnol. 2024. PMID: 38348398 Free PMC article.
-
High Biofilm-Forming Multidrug-Resistant Salmonella Infantis Strains from the Poultry Production Chain.Antibiotics (Basel). 2024 Jun 27;13(7):595. doi: 10.3390/antibiotics13070595. Antibiotics (Basel). 2024. PMID: 39061277 Free PMC article.
-
Targeted inhibition of E. coli adhesion using antisense oligonucleotides: an approach to combat bacteria via CsrB targeting.World J Microbiol Biotechnol. 2025 May 6;41(5):167. doi: 10.1007/s11274-025-04383-x. World J Microbiol Biotechnol. 2025. PMID: 40325232
References
LinkOut - more resources
Full Text Sources
Research Materials