

Identification of genetic loci conferring seed coat color based on a high-density map in soybean
- PMID: 35979081
- PMCID: PMC9376438
- DOI: 10.3389/fpls.2022.968618
Identification of genetic loci conferring seed coat color based on a high-density map in soybean
Abstract
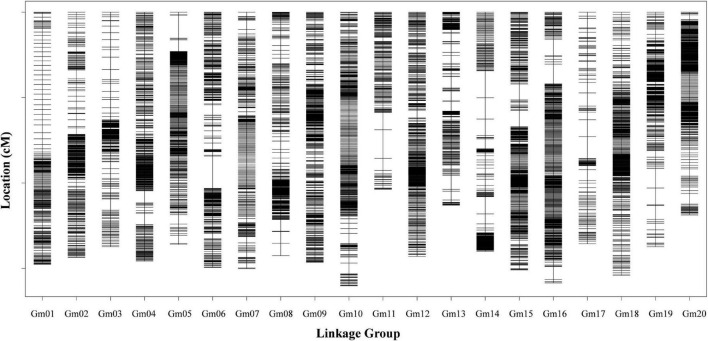
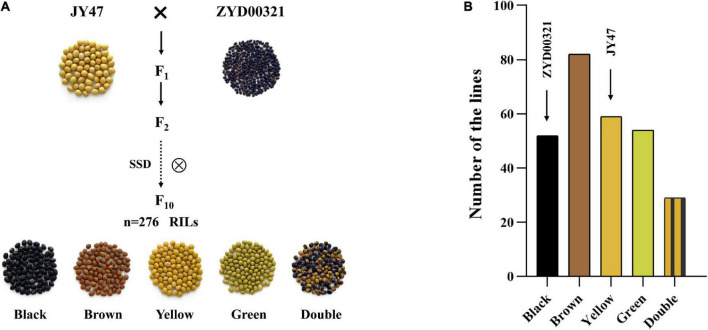
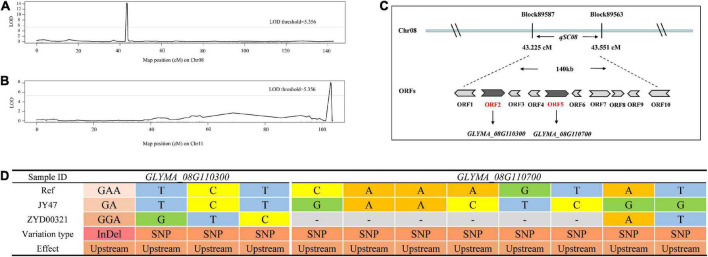
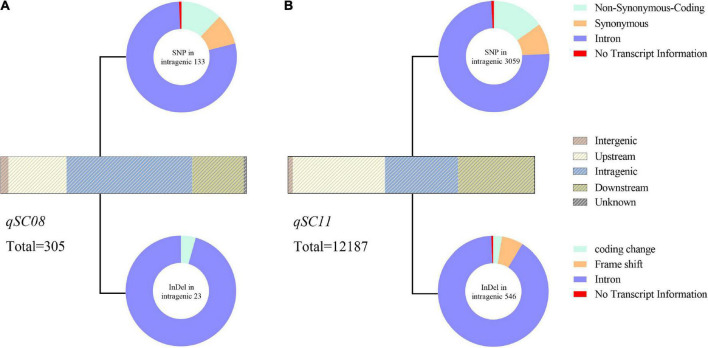
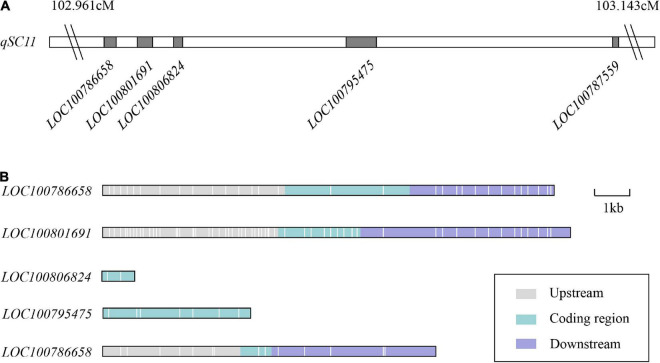
Seed coat color is a typical evolutionary trait. Identification of the genetic loci that control seed coat color during the domestication of wild soybean could clarify the genetic variations between cultivated and wild soybean. We used 276 F10 recombinant inbred lines (RILs) from the cross between a cultivated soybean (JY47) and a wild soybean (ZYD00321) as the materials to identify the quantitative trait loci (QTLs) for seed coat color. We constructed a high-density genetic map using re-sequencing technology. The average distance between adjacent markers was 0.31 cM on this map, comprising 9,083 bin markers. We identified two stable QTLs (qSC08 and qSC11) for seed coat color using this map, which, respectively, explained 21.933 and 26.934% of the phenotypic variation. Two candidate genes (CHS3C and CHS4A) in qSC08 were identified according to the parental re-sequencing data and gene function annotations. Five genes (LOC100786658, LOC100801691, LOC100806824, LOC100795475, and LOC100787559) were predicted in the novel QTL qSC11, which, according to gene function annotations, might control seed coat color. This result could facilitate the identification of beneficial genes from wild soybean and provide useful information to clarify the genetic variations for seed coat color in cultivated and wild soybean.
Keywords: QTL; high-density genetic map; re-sequencing; seed coat color; soybean.
Copyright © 2022 Yuan, Yuan, Wang, Liu, Qi, Wang, Dong, Zhao, Li and Dong.
Conflict of interest statement
The authors declare that the research was conducted in the absence of any commercial or financial relationships that could be construed as a potential conflict of interest.
Figures
Similar articles
-
Research advances on the hard seededness trait of soybean and the underlying regulatory mechanisms.Front Plant Sci. 2024 Jun 26;15:1419962. doi: 10.3389/fpls.2024.1419962. eCollection 2024. Front Plant Sci. 2024. PMID: 38988633 Free PMC article. Review.
-
Identification of candidate genes for soybean seed coat-related traits using QTL mapping and GWAS.Front Plant Sci. 2023 Jun 13;14:1190503. doi: 10.3389/fpls.2023.1190503. eCollection 2023. Front Plant Sci. 2023. PMID: 37384360 Free PMC article.
-
Quantitative trait loci analysis of seed oil content and composition of wild and cultivated soybean.BMC Plant Biol. 2020 Jan 31;20(1):51. doi: 10.1186/s12870-019-2199-7. BMC Plant Biol. 2020. PMID: 32005156 Free PMC article.
-
Identifying Wild Versus Cultivated Gene-Alleles Conferring Seed Coat Color and Days to Flowering in Soybean.Int J Mol Sci. 2021 Feb 4;22(4):1559. doi: 10.3390/ijms22041559. Int J Mol Sci. 2021. PMID: 33557103 Free PMC article.
-
Dissecting genomic hotspots underlying seed protein, oil, and sucrose content in an interspecific mapping population of soybean using high-density linkage mapping.Plant Biotechnol J. 2018 Nov;16(11):1939-1953. doi: 10.1111/pbi.12929. Epub 2018 May 16. Plant Biotechnol J. 2018. PMID: 29618164 Free PMC article.
Cited by
-
An omics strategy increasingly improves the discovery of genetic loci and genes for seed-coat color formation in soybean.Mol Breed. 2023 Aug 31;43(9):71. doi: 10.1007/s11032-023-01414-z. eCollection 2023 Sep. Mol Breed. 2023. PMID: 37663546 Free PMC article.
-
Effect of Origin, Seed Coat Color, and Maturity Group on Seed Isoflavones in Diverse Soybean Germplasm.Plants (Basel). 2024 Jun 27;13(13):1774. doi: 10.3390/plants13131774. Plants (Basel). 2024. PMID: 38999614 Free PMC article.
-
Research advances on the hard seededness trait of soybean and the underlying regulatory mechanisms.Front Plant Sci. 2024 Jun 26;15:1419962. doi: 10.3389/fpls.2024.1419962. eCollection 2024. Front Plant Sci. 2024. PMID: 38988633 Free PMC article. Review.
-
Construction of a high-density genetic map for faba bean (Vicia faba L.) and quantitative trait loci mapping of seed-related traits.Front Plant Sci. 2023 Jun 7;14:1201103. doi: 10.3389/fpls.2023.1201103. eCollection 2023. Front Plant Sci. 2023. PMID: 37351218 Free PMC article.
-
Major genetic locus with pleiotropism determined seed-related traits in cultivated and wild soybeans.Theor Appl Genet. 2023 May 10;136(6):125. doi: 10.1007/s00122-023-04358-2. Theor Appl Genet. 2023. PMID: 37165285
References
LinkOut - more resources
Full Text Sources
Miscellaneous