

Advanced genes expression pattern greatly contributes to divergence in Verticillium wilt resistance between Gossypium barbadense and Gossupium hirsutum
- PMID: 35979082
- PMCID: PMC9376480
- DOI: 10.3389/fpls.2022.979585
Advanced genes expression pattern greatly contributes to divergence in Verticillium wilt resistance between Gossypium barbadense and Gossupium hirsutum
Abstract
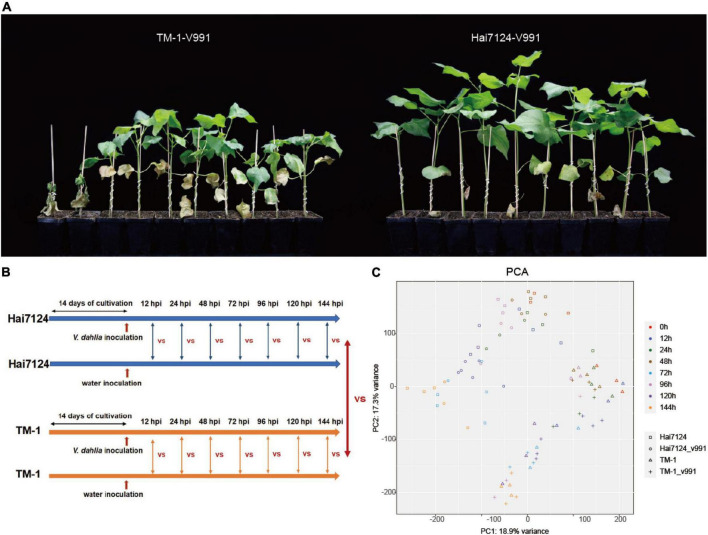
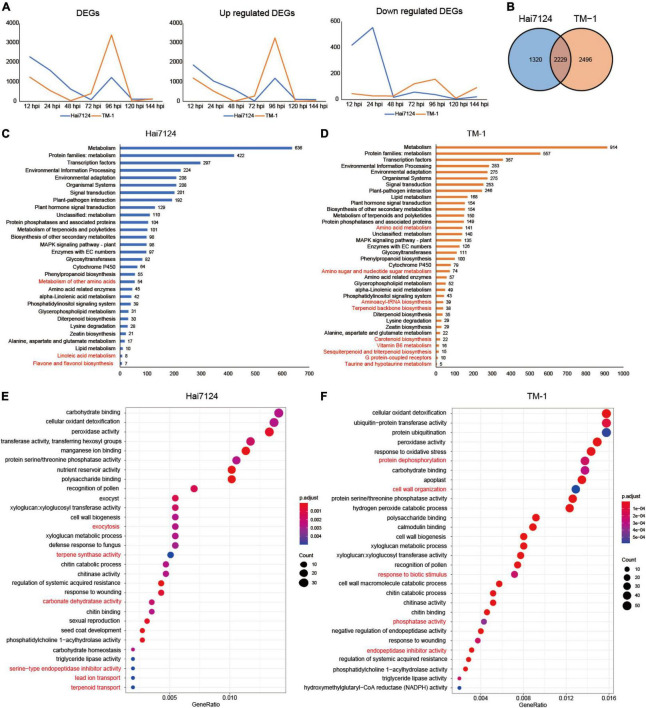
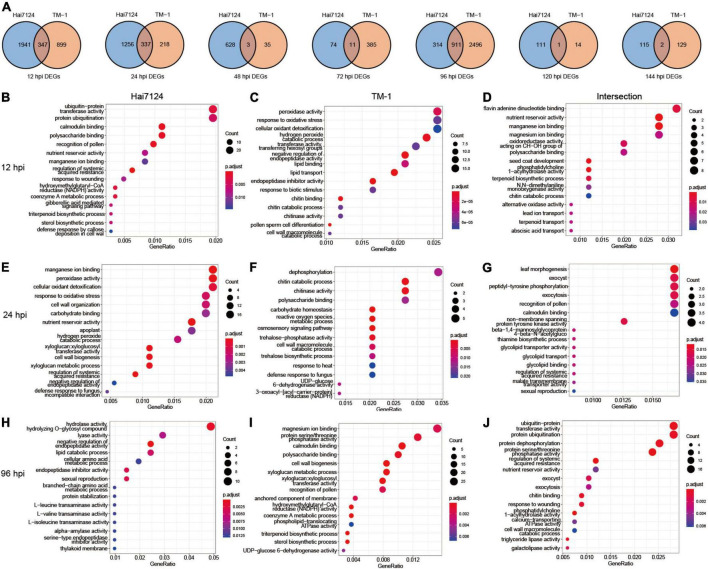
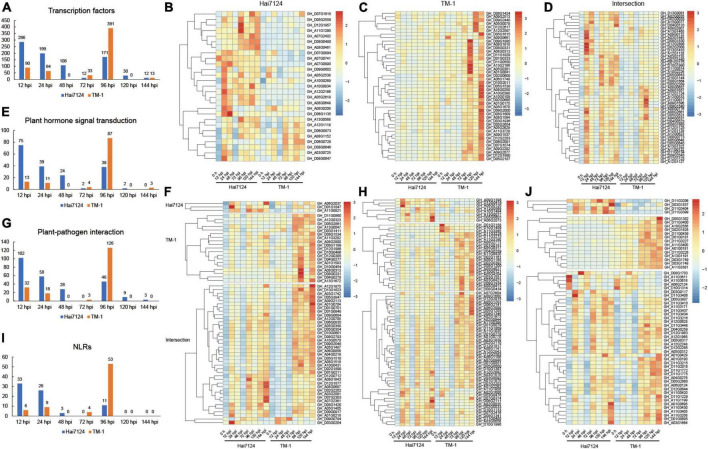
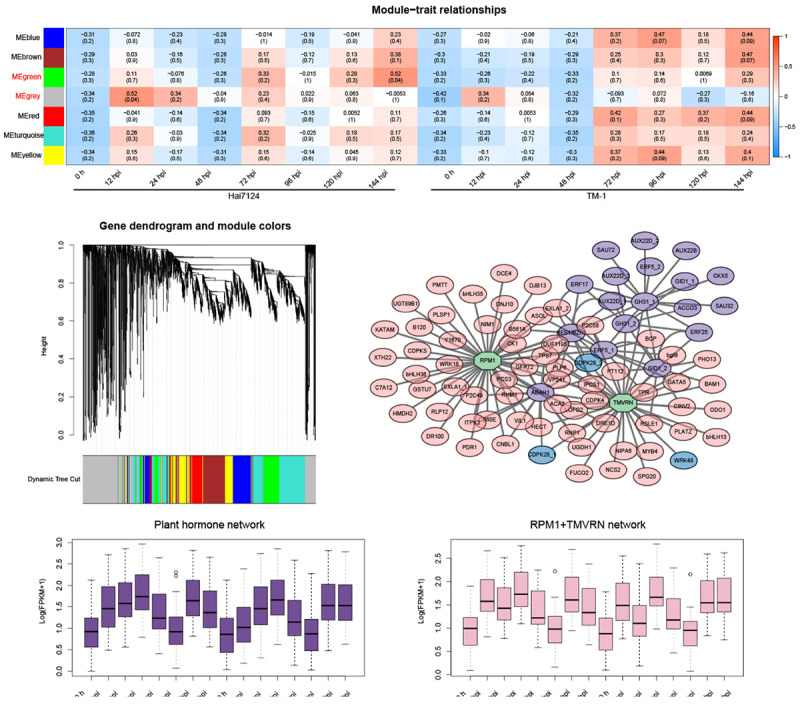
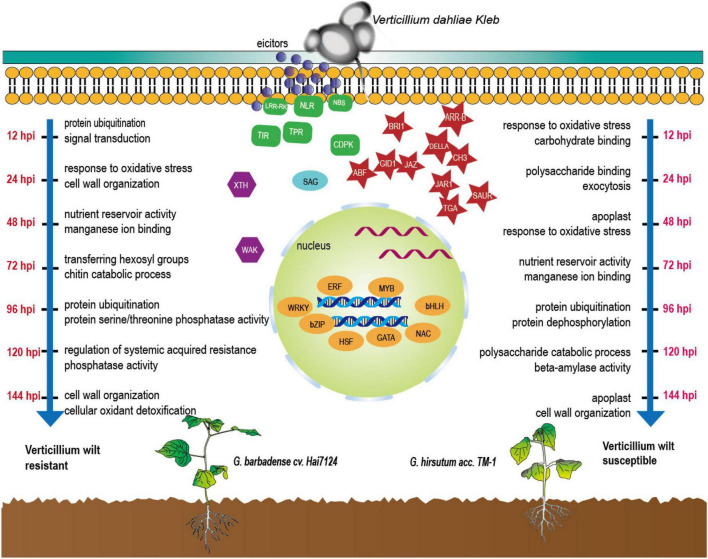
Verticillium, representing one of the world's major pathogens, causes Verticillium wilt in important woody species, ornamentals, agricultural, etc., consequently resulting in a serious decline in production and quality, especially in cotton. Gossupium hirutum and Gossypium barbadense are two kinds of widely cultivated cotton species that suffer from Verticillium wilt, while G. barbadense has much higher resistance toward it than G. hirsutum. However, the molecular mechanism regarding their divergence in Verticillium wilt resistance remains largely unknown. In the current study, G. barbadense cv. Hai7124 and G. hirsutum acc. TM-1 were compared at 0, 12, 24, 48, 72, 96, 120, and 144 h post-inoculation (hpi) utilizing high throughput RNA-Sequencing. As a result, a total of 3,549 and 4,725 differentially expressed genes (DEGs) were identified, respectively. In particular, the resistant type Hai7124 displayed an earlier and faster detection and signaling response to the Verticillium dahliae infection and demonstrated higher expression levels of defense-related genes over TM-1 with respect to transcription factors, plant hormone signal transduction, plant-pathogen interaction, and nucleotide-binding leucine-rich repeat (NLR) genes. This study provides new insights into the molecular mechanisms of divergence in Verticillium wilt resistance between G. barbadense and G. hirsutum and important candidate genes for breeding V. dahliae resistant cotton cultivars.
Keywords: Verticillium dahlia; cotton; defense response; disease resistance; transcriptome analysis.
Copyright © 2022 He, Han, Zang, Dai, Chen, Jin, Huang, Cheng, Zhang, Xu, Qi, Cao, Yan, Xuan, Zhang, Si and Hu.
Conflict of interest statement
The authors declare that the research was conducted in the absence of any commercial or financial relationships that could be construed as a potential conflict of interest.
Figures
Similar articles
-
Transcriptome profiling of Gossypium barbadense inoculated with Verticillium dahliae provides a resource for cotton improvement.BMC Genomics. 2013 Sep 22;14:637. doi: 10.1186/1471-2164-14-637. BMC Genomics. 2013. PMID: 24053558 Free PMC article.
-
Large-scale identification of Gossypium hirsutum genes associated with Verticillium dahliae by comparative transcriptomic and reverse genetics analysis.PLoS One. 2017 Aug 2;12(8):e0181609. doi: 10.1371/journal.pone.0181609. eCollection 2017. PLoS One. 2017. PMID: 28767675 Free PMC article.
-
Integrated Transcriptomic and Metabolomic Analysis of G. hirsutum and G. barbadense Responses to Verticillium Wilt Infection.Int J Mol Sci. 2024 Dec 24;26(1):28. doi: 10.3390/ijms26010028. Int J Mol Sci. 2024. PMID: 39795888 Free PMC article.
-
Interactions between Verticillium dahliae and cotton: pathogenic mechanism and cotton resistance mechanism to Verticillium wilt.Front Plant Sci. 2023 Apr 21;14:1174281. doi: 10.3389/fpls.2023.1174281. eCollection 2023. Front Plant Sci. 2023. PMID: 37152175 Free PMC article. Review.
-
Defense Mechanisms of Cotton Fusarium and Verticillium Wilt and Comparison of Pathogenic Response in Cotton and Humans.Int J Mol Sci. 2022 Oct 13;23(20):12217. doi: 10.3390/ijms232012217. Int J Mol Sci. 2022. PMID: 36293072 Free PMC article. Review.
Cited by
-
Pan-genome analysis of GT64 gene family and expression response to Verticillium wilt in cotton.BMC Plant Biol. 2024 Sep 30;24(1):893. doi: 10.1186/s12870-024-05584-6. BMC Plant Biol. 2024. PMID: 39343881 Free PMC article.
-
Transcriptomic datasets of Verticillium wilt resistant and non-resistant Gossypium barbadense varieties during pathogen inoculation.Sci Data. 2024 Jan 2;11(1):11. doi: 10.1038/s41597-023-02852-2. Sci Data. 2024. PMID: 38167492 Free PMC article.
-
UDP-glucosyltransferase 71C4 controls the flux of phenylpropanoid metabolism to shape cotton seed development.Plant Commun. 2024 Aug 12;5(8):100938. doi: 10.1016/j.xplc.2024.100938. Epub 2024 Apr 30. Plant Commun. 2024. PMID: 38689494 Free PMC article.
-
Integrative physiology and transcriptome sequencing reveal differences between G. hirsutum and G. barbadense in response to salt stress and the identification of key salt tolerance genes.BMC Plant Biol. 2024 Aug 21;24(1):787. doi: 10.1186/s12870-024-05515-5. BMC Plant Biol. 2024. PMID: 39164616 Free PMC article.
-
Unraveling key genes and pathways involved in Verticillium wilt resistance by integrative GWAS and transcriptomic approaches in Upland cotton.Funct Integr Genomics. 2025 Feb 16;25(1):39. doi: 10.1007/s10142-025-01539-8. Funct Integr Genomics. 2025. PMID: 39955705
References
-
- Benesty J., Chen J., Huang Y., Cohen I. (2009). Pearson Correlation Coefficient,” in Noise Reduction in Speech Processing. Berlin: Springer Berlin Heidelberg, 1–4.
-
- Cai Y. F., He X. H., Mo J. C., Sun Q., Yang J. P., Liu J. G. (2009). Molecular research and genetic engineering of resistance to Verticillium wilt in cotton: a review. Afr. J. Biotechnol. 8 7363–7372. 10.5897/AJB2009.000-9571 - DOI
LinkOut - more resources
Full Text Sources
Research Materials