

Diagnostic value of 3.0 T versus 1.5 T MRI in staging prostate cancer: systematic review and meta-analysis
- PMID: 35979151
- PMCID: PMC9373864
- DOI: 10.5114/pjr.2022.118685
Diagnostic value of 3.0 T versus 1.5 T MRI in staging prostate cancer: systematic review and meta-analysis
Abstract
Purpose: To compare the diagnostic performance of 3.0 T and 1.5 T MRI in the staging of prostate cancer.
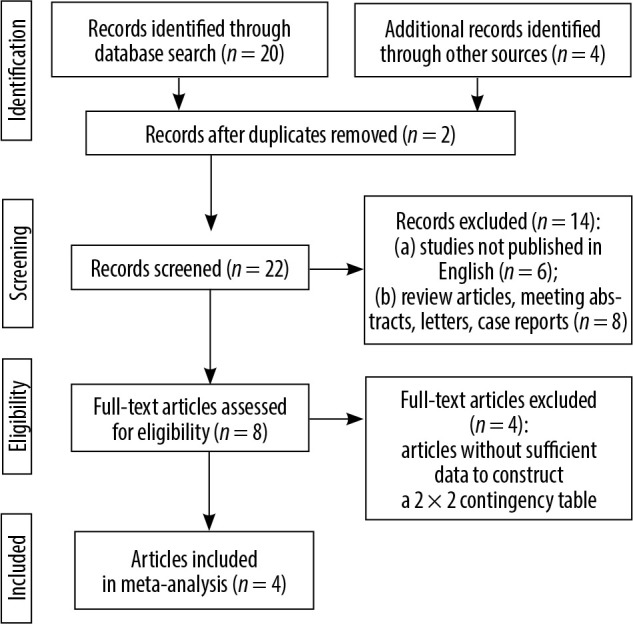
Material and methods: English-language studies on the diagnostic accuracy of 3.0 T and 1.5 T MRI in prostate cancer staging published through May 2020 were searched for in relevant databases. The focus was on studies in which both 3.0 T and 1.5 T MRI were performed in the study population, to reduce interstudy heterogeneity. Pooled sensitivity, specificity, diagnostic odds ratio (DOR), and area under the receiver operating characteristic curve were determined for 3.0 T and for 1.5 T along with 95% confidence intervals (CIs).
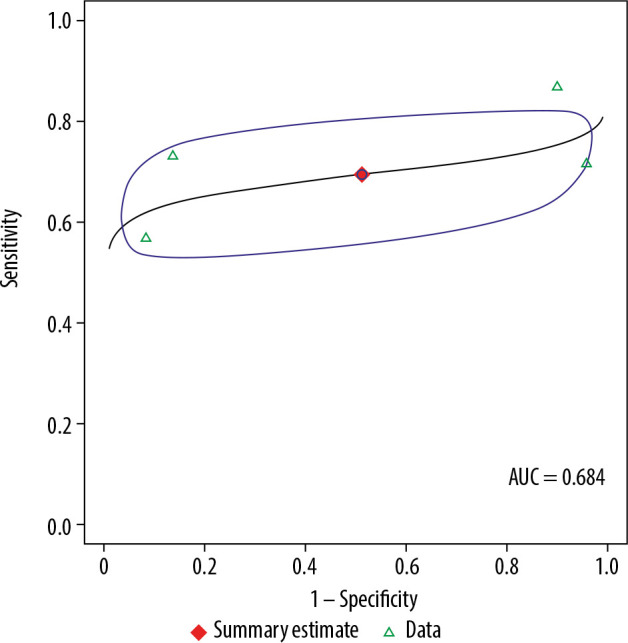
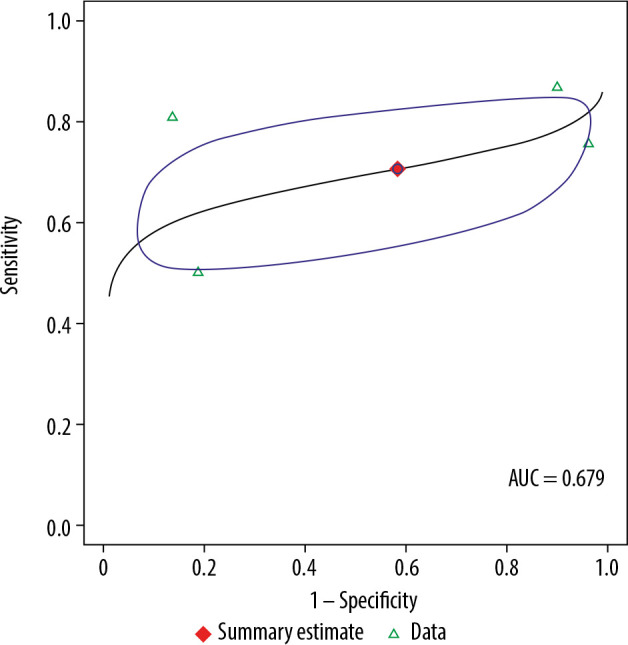
Results: Out of 8 studies identified, 4 met the inclusion criteria. 3.0 T (n = 160) had a pooled sensitivity of 69.5% (95% CI: 56.4-80.1%) and a pooled specificity of 48.8% (95% CI: 6.0-93.4%), while 1.5 T (n = 139) had a pooled sensitivity of 70.6% (95% CI: 55.0-82.5%; p = 0.91) and a pooled specificity of 41.7% (95% CI: 6.2-88.6%; p = 0.88). The pooled DOR for 3.0 T was 3 (95% CI: 0-26.0%), while the pooled DOR for 1.5 T was 2 (95% CI: 0-18.0%), which was not a significant difference (p = 0.89).
Conclusions: 3.0 T has slightly better diagnostic performance than 1.5 T MRI in prostate cancer staging (3 vs. 2), although without statistical significance. Our findings suggest the need for larger, randomized trials directly comparing 3.0 T and 1.5 T MRI in prostate cancer.
Keywords: 1.5 T; 3.0 T; meta-analysis; prostate cancer.
Copyright © Polish Medical Society of Radiology 2022.
Conflict of interest statement
The authors report no conflict of interest.
Figures
Similar articles
-
Fluorine 18-FDG PET/CT and Diffusion-weighted MRI for Malignant versus Benign Pulmonary Lesions: A Meta-Analysis.Radiology. 2019 Feb;290(2):525-534. doi: 10.1148/radiol.2018181159. Epub 2018 Nov 27. Radiology. 2019. PMID: 30480492
-
Diagnostic value of PET/CT versus PET/MRI in gynecological malignancies of the pelvis: A meta-analysis.Clin Imaging. 2020 Mar;60(1):53-61. doi: 10.1016/j.clinimag.2019.11.018. Epub 2019 Dec 6. Clin Imaging. 2020. PMID: 31864201
-
Staging/restaging performance of F18-fluorodeoxyglucose positron emission tomography/magnetic resonance imaging in breast cancer: A review and meta-analysis.Eur J Radiol. 2018 Oct;107:158-165. doi: 10.1016/j.ejrad.2018.09.003. Epub 2018 Sep 5. Eur J Radiol. 2018. PMID: 30292261
-
Comparing the Staging/Restaging Performance of 68Ga-Labeled Prostate-Specific Membrane Antigen and 18F-Choline PET/CT in Prostate Cancer: A Systematic Review and Meta-analysis.Clin Nucl Med. 2019 May;44(5):365-376. doi: 10.1097/RLU.0000000000002526. Clin Nucl Med. 2019. PMID: 30888999
-
Direct comparison of choline PET/CT and MRI in the diagnosis of lymph node metastases in patients with prostate cancer.Medicine (Baltimore). 2018 Dec;97(50):e13344. doi: 10.1097/MD.0000000000013344. Medicine (Baltimore). 2018. PMID: 30557983 Free PMC article. Review.
Cited by
-
ISUP Grade Prediction of Prostate Nodules on T2WI Acquisitions Using Clinical Features, Textural Parameters and Machine Learning-Based Algorithms.Cancers (Basel). 2025 Jun 18;17(12):2035. doi: 10.3390/cancers17122035. Cancers (Basel). 2025. PMID: 40563684 Free PMC article.
-
Textural Features of MR Images Correlate with an Increased Risk of Clinically Significant Cancer in Patients with High PSA Levels.J Clin Med. 2023 Apr 12;12(8):2836. doi: 10.3390/jcm12082836. J Clin Med. 2023. PMID: 37109173 Free PMC article.
References
-
- Siegel RL, Miller KD, Jemal A. Cancer statistics, 2019. CA Cancer J Clin 2019; 69: 7-34. - PubMed
-
- Rifkin MD, Zerhouni EA, Gatsonis CA, et al. . Comparison of magnetic resonance imaging and ultrasonography in staging early prostate cancer. Results of a multi-institutional cooperative trial. N Engl J Med 1990; 323: 621-626. - PubMed
-
- Stabile A, Giganti F, Rosenkrantz AB, et al. . Multiparametric MRI for prostate cancer diagnosis: current status and future directions. Nat Rev Urol 2020; 17: 41-61. - PubMed
-
- Turkbey B, Rosenkrantz AB, Haider MA, et al. . Prostate Imaging Reporting and Data System Version 2.1: 2019 Update of Prostate Imaging Reporting and Data System Version 2. Eur Urol 2019; 76: 340-351. - PubMed
LinkOut - more resources
Full Text Sources
Miscellaneous