. 2022 Jun 28;28(24):2689-2704.
doi: 10.3748/wjg.v28.i24.2689.

Downregulation of TNFR2 decreases survival gene expression, promotes apoptosis and affects the cell cycle of gastric cancer cells

Affiliations

Downregulation of TNFR2 decreases survival gene expression, promotes apoptosis and affects the cell cycle of gastric cancer cells

Ana Flávia Teixeira Rossi et al. World J Gastroenterol. .

Abstract

Background: Chronic inflammation due to Helicobacter pylori (H. pylori) infection promotes gastric carcinogenesis. Tumour necrosis factor-α (TNF-α), a key mediator of inflammation, induces cell survival or apoptosis by binding to two receptors (TNFR1 and TNFR2). TNFR1 can induce both survival and apoptosis, while TNFR2 results only in cell survival. The dysregulation of these processes may contribute to carcinogenesis.

Aim: To evaluate the effects of TNFR1 and TNFR2 downregulation in AGS cells treated with H. pylori extract on the TNF-α pathway.

Methods: AGS cell lines containing TNFR1 and TNFR2 receptors downregulated by specific shRNAs and nonsilenced AGS cells were treated with H. pylori extract for 6 h. Subsequently, quantitative polymerase chain reaction with TaqMan® assays was used for the relative quantification of the mRNAs (TNFA, TNFR1, TNFR2, TRADD, TRAF2, CFLIP, NFKB1, NFKB2, CASP8, CASP3) and miRNAs (miR-19a, miR-34a, miR-103a, miR-130a, miR-181c) related to the TNF-α signalling pathway. Flow cytometry was employed for cell cycle analysis and apoptosis assays.

Results: In nonsilenced AGS cells, H. pylori extract treatment increased the expression of genes involved in cell survival and inhibited both apoptosis (NFKB1, NFKB2 and CFLIP) and the TNFR1 receptor. TNFR1 downregulation significantly decreased the expression of the TRADD and CFLIP genes, although no change was observed in the cellular process or miRNA expression. In contrast, TNFR2 downregulation decreased the expression of the TRADD and TRAF2 genes, which are both important downstream mediators of the TNFR1-mediated pathway, as well as that of the NFKB1 and CFLIP genes, while upregulating the expression of miR-19a and miR-34a. Consequently, a reduction in the number of cells in the G0/G1 phase and an increase in the number of cells in the S phase were observed, as well as the promotion of early apoptosis.

Conclusion: Our findings mainly highlight the important role of TNFR2 in the TNF-α pathway in gastric cancer, indicating that silencing it can reduce the expression of survival and anti-apoptotic genes.

Keywords: Gastric cancer; Helicobacter pylori; TNFR1; TNFR2; Tumour necrosis factor-α signalling pathway; miRNAs.


Conflict of interest statement

Conflict-of-interest statement: The authors declare that they have no conflict of interest.

Figures

Figure 1
Figure 1
The efficiency of TNFR1 and TNFR2 expression silencing in AGS cells. A and B: Expression levels of TNFR1 and TNFR2 mRNA evaluated by real-time reverse transcription-quantitative polymerase chain reaction; C and D: Protein expression of TNFR1 and TNFR2 evaluated by Western blotting. Downregulation of TNFR1 (A-C) and TNFR2 (B-D) was confirmed by the reduction in the expression of receptors TNFR1 and TNFR2 following treatment with shRNAs 2 and 4, respectively. AGS: Nonsilenced cell line; C: Control transfected with empty vector; 1 and 2: Different shRNA clones for TNFR1; 3 and 4: Different shRNA clones for TNFR2.
Figure 2
Figure 2
Relative expression of tumour necrosis factor-α signalling pathway genes. Expression levels of TNFA, TNFR1, TNFR2, TRADD, TRAF2, CFLIP, CASP8, CASP3, NFKB1 and NFKB2 mRNA in nonsilenced AGS, AGS with TNFR1 downregulation (shTNFR1), and AGS with TNFR2 downregulation (shTNFR2) either not treated (control) or treated with a Helicobacter pylori extract. A: TNFA; B: TNFR1; C: TNFR2; D: TRADD; E: TRAF2; F: CFLIP; G: CASP8; H: CASP3; I: NFKB1; J: NFKB2. Bars represent the mean ± SD from three independent trials. The dotted line indicates relative quantification: RQ = 1.0. Statistically significant difference: aP < 0.05; bP < 0.01; cP < 0.001. eHP: Helicobacter pylori extract.
Figure 3
Figure 3
Relative expression of miRNAs related to the tumour necrosis factor-α pathway. Expression levels of miR-19a, miR-34a, miR-103a, miR-130a and miR-181c in nonsilenced AGS, AGS with TNFR1 downregulation (shTNFR1), and AGS with TNFR2 downregulation (shTNFR2) either not treated (control) or treated with the Helicobacter pylori extract. A: miR-19a; B: miR-34a; C: miR-103a; D: miR-130a; E: miR-181c. Bars represent the mean ± SD from three independent trials. The dotted line indicates relative quantification: RQ = 1.0. Statistically significant difference: aP < 0.05; bP < 0.01; cP < 0.001. eHP: Helicobacter pylori extract.
Figure 4
Figure 4
Cell cycle distribution analysis. Number of cells in the G0/G1, S and G2/M phases of the cell cycle in nonsilenced AGS cells, cells with TNFR1 downregulated (shTNFR1), and cells with TNFR2 downregulated (shTNFR2) without additional treatment (control) and those treated with the Helicobacter pylori extract. A: G0/G1; B: S; C: G2/M. Bars represent the mean ± SD from three independent trials. Statistically significant difference: aP < 0.05; bP < 0.01; cP < 0.001. eHP: Helicobacter pylori extract.
Figure 5
Figure 5
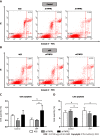
Apoptosis distribution analysis in nonsilenced AGS cells, cells with TNFR1 downregulated (shTNFR1), and cells with TNFR2 downregulated (shTNFR2). A: Cells without additional treatment (control); B: Cells treated with the Helicobacter pylori extract; A and B: Representative images of the cell distribution and percentage in the different quadrants indicating viable cells (Annexin V-/PI-) in the lower left, early apoptotic cells (Annexin V+/PI-) in the lower right and late apoptotic cells (Annexin V+/PI+) in the upper right; C and D: Histogram bars represent the mean ± SD from three independent trials for early (C) and late (D) apoptosis. Statistically significant difference: aP < 0.05; bP < 0.01. eHP: Helicobacter pylori extract.
Figure 6
Figure 6
Schematic comparison of the tumour necrosis factor-α signalling pathway and cell fate in nonsilenced AGS, shTNFR1 and shTNFR2 cells with downregulation after treatment with Helicobacter pylori extract. After the tumour necrosis factor (TNF)-α/TNFR1 interaction, TRADD, RIP1, TRAF2 and cellular inhibitor of apoptosis proteins are recruited, which results in nuclear factor-kappaB (NF-κB) activation and transcription of prosurvival and antiapoptotic genes, such as CFLIP, that inhibit the activity of the death-inducing signalling complex, which is formed after dissociation between TRADD and TNFR1. As with TNFR1, TNFR2 stimulation leads to NF-κB activation and cell survival; A: Treatment with Helicobacter pylori (H. pylori) extract resulted in increased expression of TNFR1, NFKB1, NFKB2 and CFLIP mRNAs in nonsilenced AGS cells. Therefore, the cell survival pathway is activated due to NF-kB activation (red ellipse) through the TNFR1-TNF signalling pathway with consequent production of the antiapoptotic CFLIP; B: In shTNFR1-H. pylori extract cells, TNFR1 downregulation resulted in decreased expression of TRADD and CFLIP mRNAs; however, it did not change cell fate; C: In shTNFR2-H. pylori extract cells, TNFR2 downregulation decreased the expression of TRAF2 and TRADD, decreased NFKB1, CFLIP and TNFR1 expression, and upregulated miR-19a and miR-34a. This led to an increase in apoptosis, impairing cell survival due to arrest in the G1/S transition phase.

Similar articles

Cited by

References

    1. International Agency for Research on Cancer. Cancer Today fact Sheets, 2018. [cited 11 January 2022]. Available from http://gco.iarc.fr/today/data/factsheets/cancers/7-Stomach-fact-sheet.pdf .
    1. Ministério da Saúde, Instituto Nacional de Câncer José Alencar Gomes da Silva. Estimativa 2020-Incidência de câncer no Brasil. 2019. [cited 11 January 2022]. Available from: https://www.inca.gov.br/sites/ufu.sti.inca.local/files//media/document//... .
    1. Yousefi B, Mohammadlou M, Abdollahi M, Salek Farrokhi A, Karbalaei M, Keikha M, Kokhaei P, Valizadeh S, Rezaiemanesh A, Arabkari V, Eslami M. Epigenetic changes in gastric cancer induction by Helicobacter pylori. J Cell Physiol. 2019;234:21770–21784. - PubMed
    1. Cadamuro AC, Rossi AF, Maniezzo NM, Silva AE. Helicobacter pylori infection: host immune response, implications on gene expression and microRNAs. World J Gastroenterol. 2014;20:1424–1437. - PMC - PubMed
    1. Chen R, Yang M, Huang W, Wang B. Cascades between miRNAs, lncRNAs and the NF-κB signaling pathway in gastric cancer (Review) Exp Ther Med. 2021;22:769. - PMC - PubMed

MeSH terms

Substances