

A New Definition for Intracranial Compliance to Evaluate Adult Hydrocephalus After Shunting
- PMID: 35979170
- PMCID: PMC9377221
- DOI: 10.3389/fbioe.2022.900644
A New Definition for Intracranial Compliance to Evaluate Adult Hydrocephalus After Shunting
Abstract
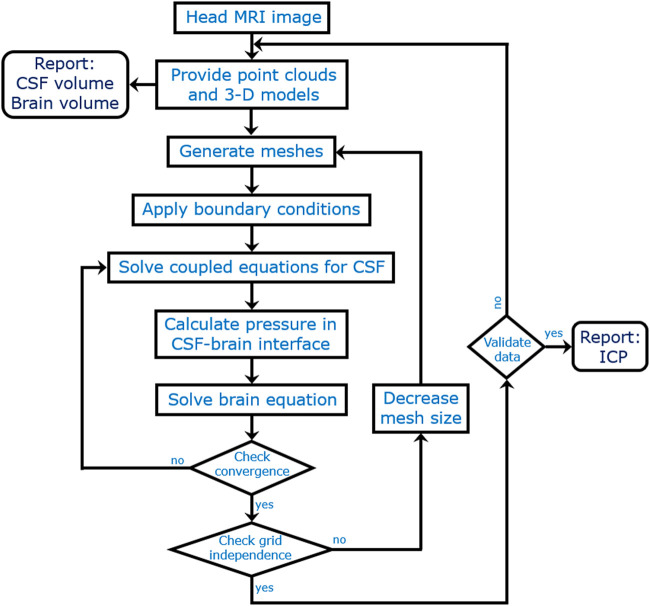
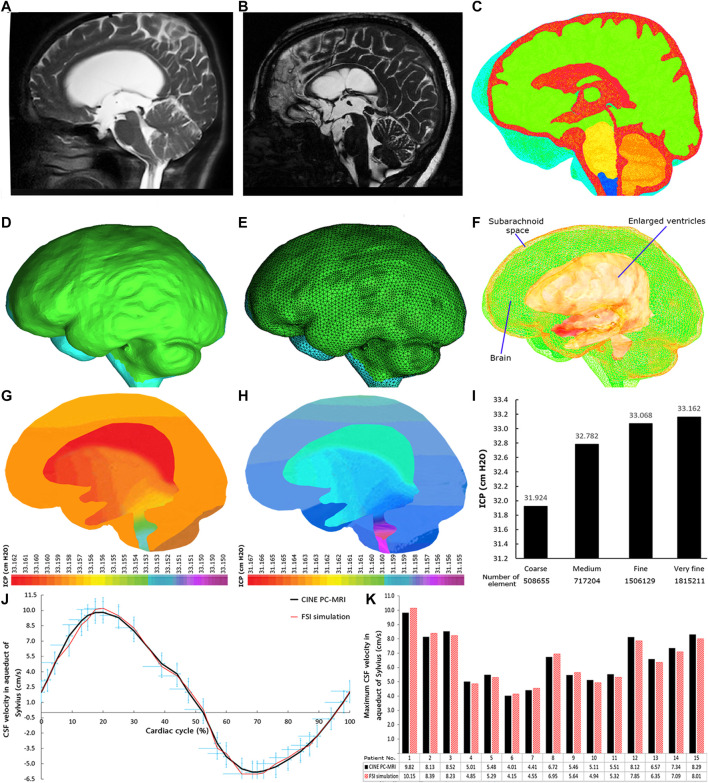
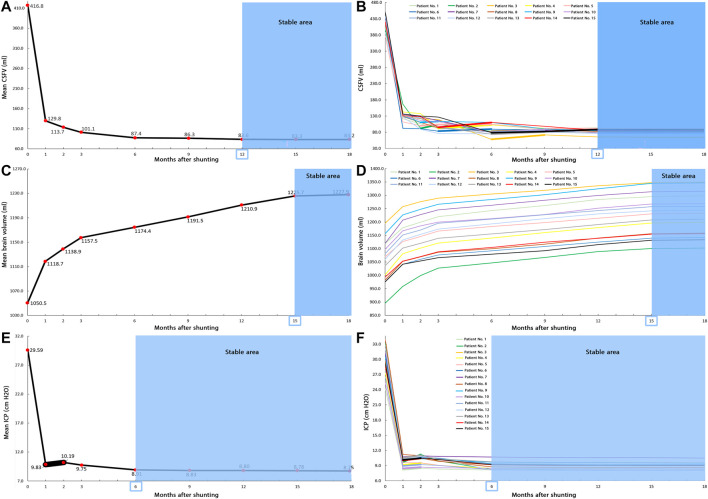
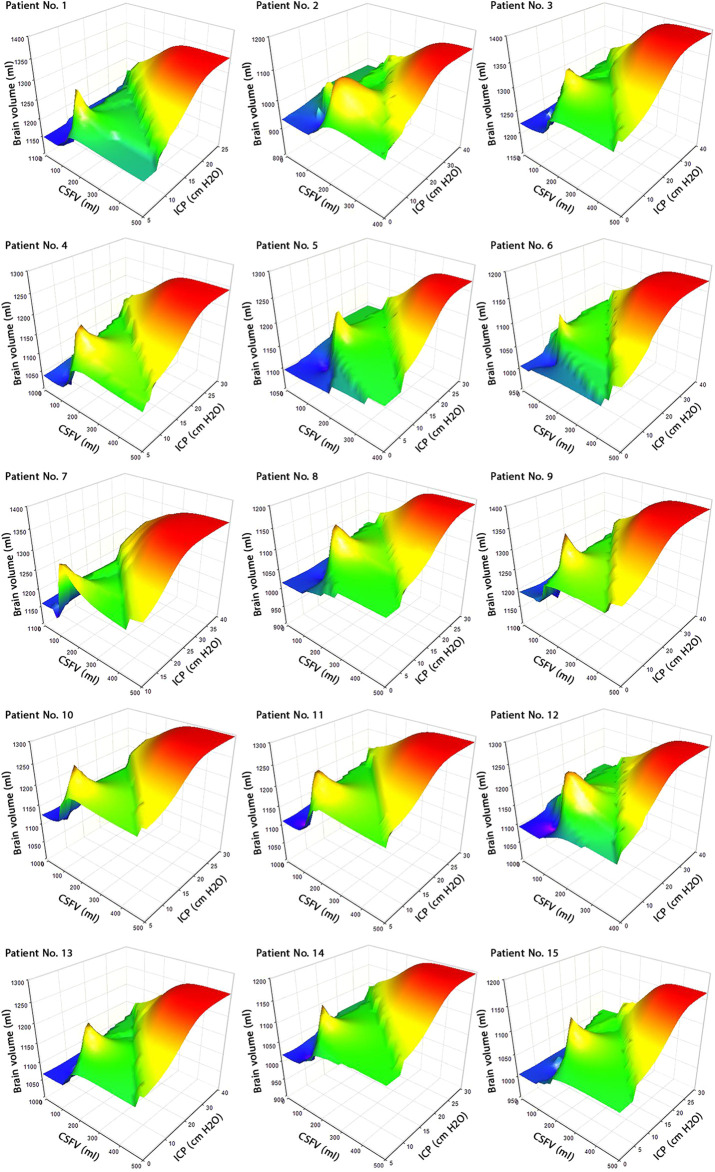
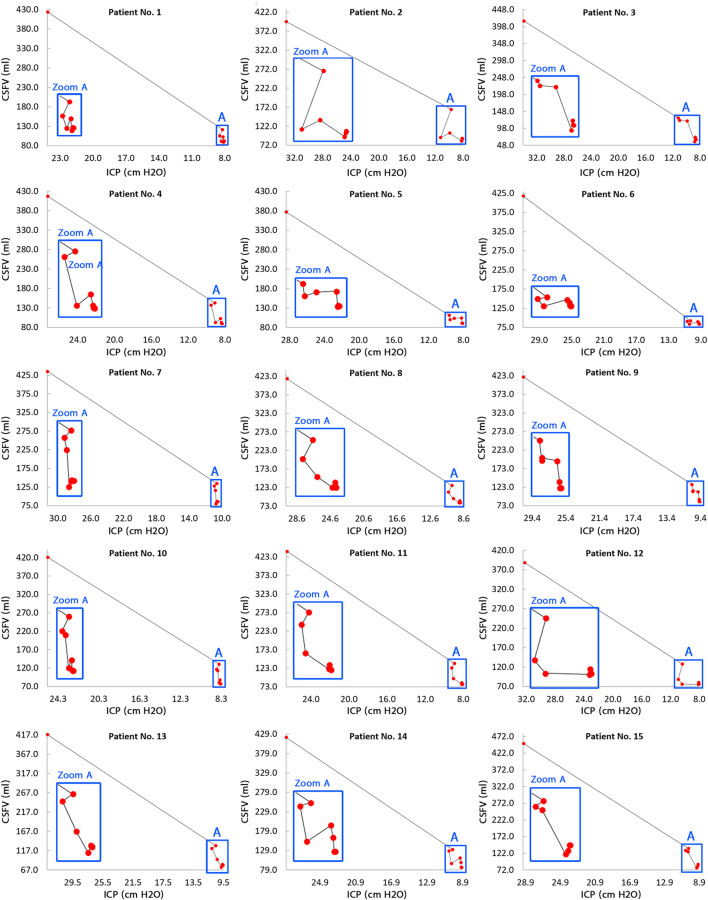
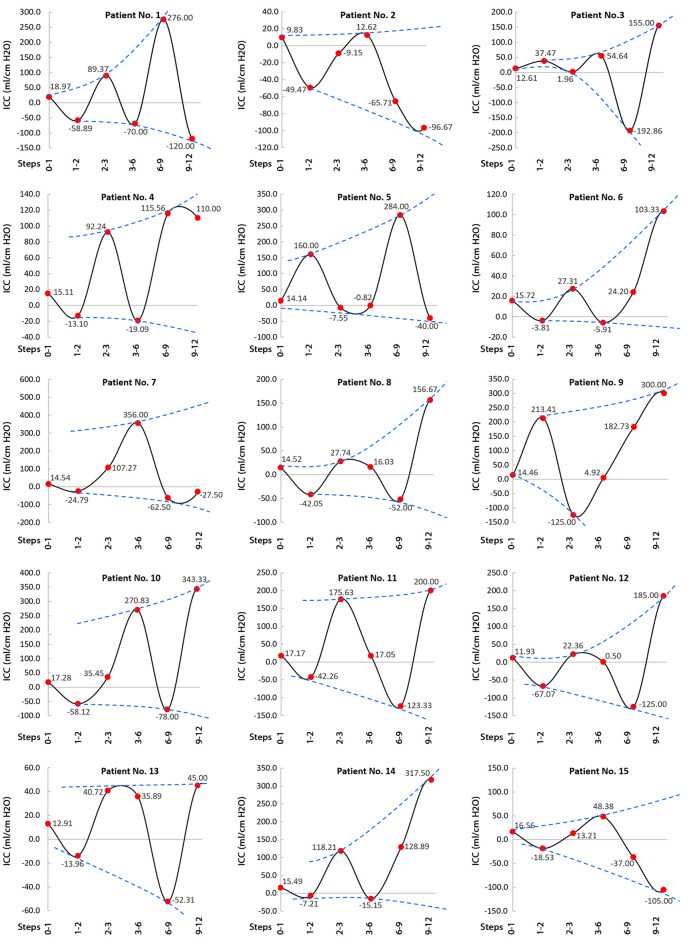
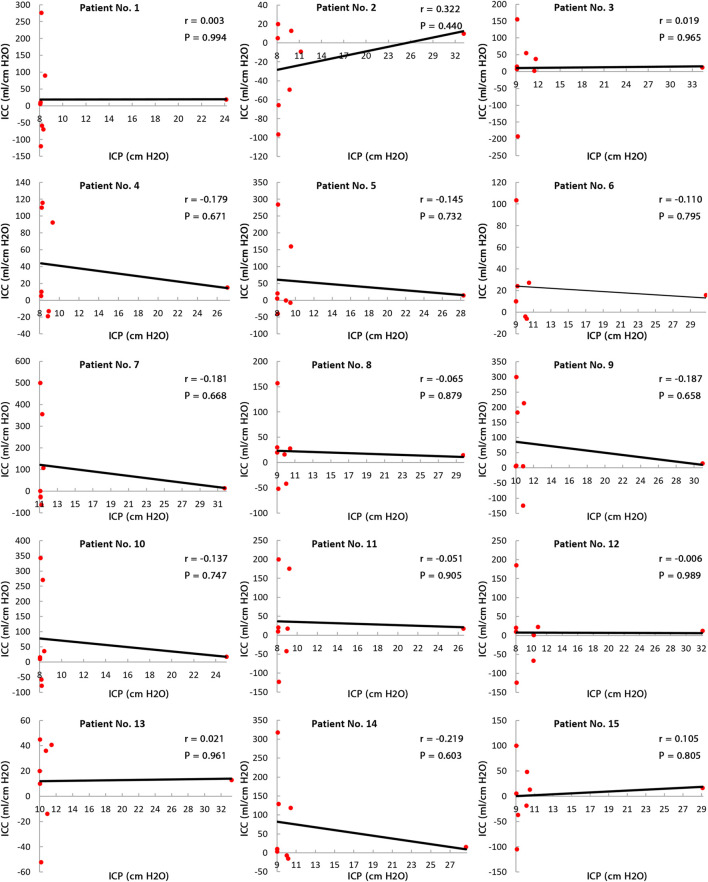
The clinical application of intracranial compliance (ICC), ∆V/∆P, as one of the most critical indexes for hydrocephalus evaluation was demonstrated previously. We suggest a new definition for the concept of ICC (long-term ICC) where there is a longer amount of elapsed time (up to 18 months after shunting) between the measurement of two values (V1 and V2 or P1 and P2). The head images of 15 adult patients with communicating hydrocephalus were provided with nine sets of imaging in nine stages: prior to shunting, and 1, 2, 3, 6, 9, 12, 15, and 18 months after shunting. In addition to measuring CSF volume (CSFV) in each stage, intracranial pressure (ICP) was also calculated using fluid-structure interaction simulation for the noninvasive calculation of ICC. Despite small increases in the brain volume (16.9%), there were considerable decreases in the ICP (70.4%) and CSFV (80.0%) of hydrocephalus patients after 18 months of shunting. The changes in CSFV, brain volume, and ICP values reached a stable condition 12, 15, and 6 months after shunting, respectively. The results showed that the brain tissue needs approximately two months to adapt itself to the fast and significant ICP reduction due to shunting. This may be related to the effect of the "viscous" component of brain tissue. The ICC trend between pre-shunting and the first month of shunting was descending for all patients with a "mean value" of 14.75 ± 0.6 ml/cm H2O. ICC changes in the other stages were oscillatory (nonuniform). Our noninvasive long-term ICC calculations showed a nonmonotonic trend in the CSFV-ICP graph, the lack of a linear relationship between ICC and ICP, and an oscillatory increase in ICC values during shunt treatment. The oscillatory changes in long-term ICC may reflect the clinical variations in hydrocephalus patients after shunting.
Keywords: brain material; fluid–structure interaction; hydrocephalus; intracranial compliance; intracranial pressure; shunt; viscous component.
Copyright © 2022 Gholampour, Yamini, Droessler and Frim.
Conflict of interest statement
The authors declare that the research was conducted in the absence of any commercial or financial relationships that could be construed as a potential conflict of interest.
Figures
Similar articles
-
Long-term recovery behavior of brain tissue in hydrocephalus patients after shunting.Commun Biol. 2022 Nov 8;5(1):1198. doi: 10.1038/s42003-022-04128-8. Commun Biol. 2022. PMID: 36344582 Free PMC article.
-
The pathophysiology of chronic noncommunicating hydrocephalus: lessons from continuous intracranial pressure monitoring and ventricular infusion testing.J Neurosurg. 2018 Jul;129(1):220-233. doi: 10.3171/2017.1.JNS162813. Epub 2017 Aug 11. J Neurosurg. 2018. PMID: 28799879
-
Feasibility of assessing non-invasive intracranial compliance using FSI simulation-based and MR elastography-based brain stiffness.Sci Rep. 2024 Mar 18;14(1):6493. doi: 10.1038/s41598-024-57250-4. Sci Rep. 2024. PMID: 38499758 Free PMC article.
-
Why Intracranial Compliance Is Not Utilized as a Common Practical Tool in Clinical Practice.Biomedicines. 2023 Nov 17;11(11):3083. doi: 10.3390/biomedicines11113083. Biomedicines. 2023. PMID: 38002083 Free PMC article. Review.
-
Intracranial Compliance Concepts and Assessment: A Scoping Review.Front Neurol. 2021 Oct 25;12:756112. doi: 10.3389/fneur.2021.756112. eCollection 2021. Front Neurol. 2021. PMID: 34759884 Free PMC article.
Cited by
-
Predicting Outcomes of Preterm Neonates Post Intraventricular Hemorrhage.Int J Mol Sci. 2024 Sep 25;25(19):10304. doi: 10.3390/ijms251910304. Int J Mol Sci. 2024. PMID: 39408633 Free PMC article.
-
TRPV4 mRNA is elevated in the caudate nucleus with NPH but not in Alzheimer's disease.Front Genet. 2022 Nov 2;13:936151. doi: 10.3389/fgene.2022.936151. eCollection 2022. Front Genet. 2022. PMID: 36406122 Free PMC article.
-
Long-term recovery behavior of brain tissue in hydrocephalus patients after shunting.Commun Biol. 2022 Nov 8;5(1):1198. doi: 10.1038/s42003-022-04128-8. Commun Biol. 2022. PMID: 36344582 Free PMC article.
-
A year in review: brain barriers and brain fluids research in 2022.Fluids Barriers CNS. 2023 Apr 21;20(1):30. doi: 10.1186/s12987-023-00429-0. Fluids Barriers CNS. 2023. PMID: 37085841 Free PMC article.
-
The Impact of Left Ventricular Performance and Afterload on the Evaluation of Aortic Valve Stenosis: A 1D Mathematical Modeling Approach.Bioengineering (Basel). 2023 Mar 28;10(4):425. doi: 10.3390/bioengineering10040425. Bioengineering (Basel). 2023. PMID: 37106613 Free PMC article.
References
-
- Adina R. (2005). ADINA Theory and Modeling Guide–Volume III. Watertown: ADINA CFD & FSI.
LinkOut - more resources
Full Text Sources