. 2022 Aug 8:2022:7929589.
doi: 10.1155/2022/7929589. eCollection 2022.

Possibility for Visualizing the Muscle Microstructure by q-Space Imaging Technique

Affiliations

Possibility for Visualizing the Muscle Microstructure by q-Space Imaging Technique

Yasushi Sera et al. Appl Bionics Biomech. .

Abstract

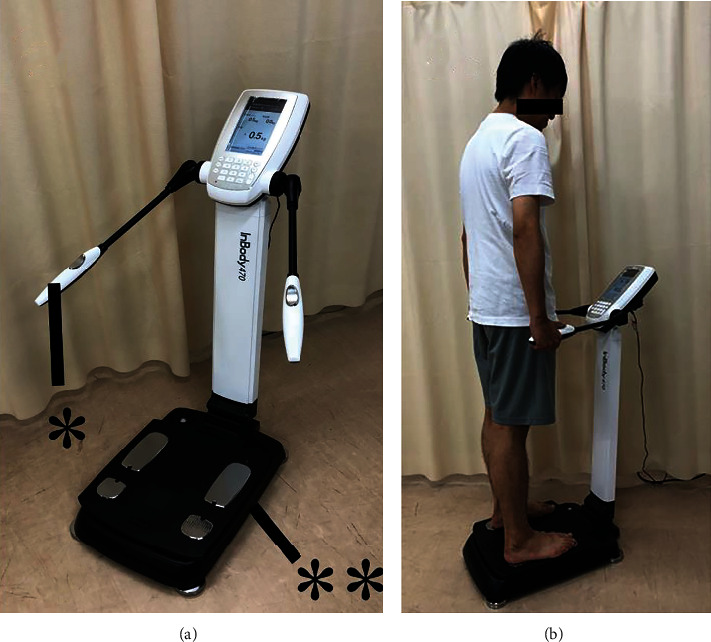
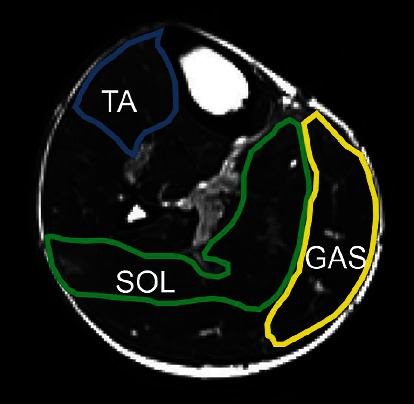
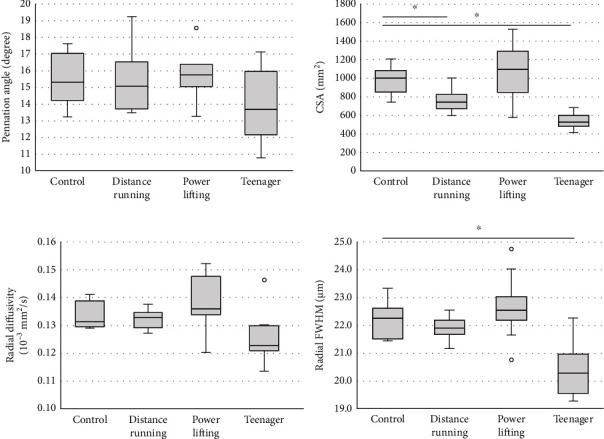
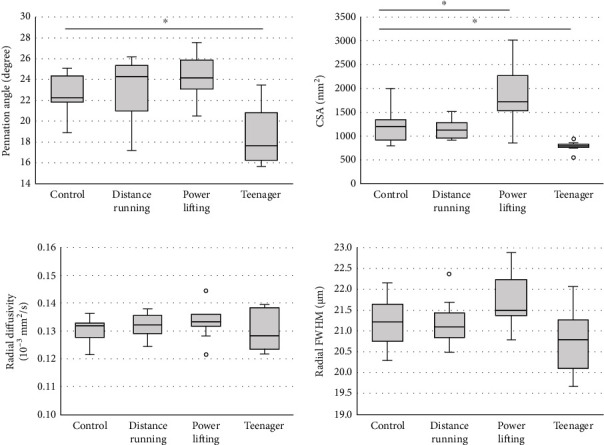
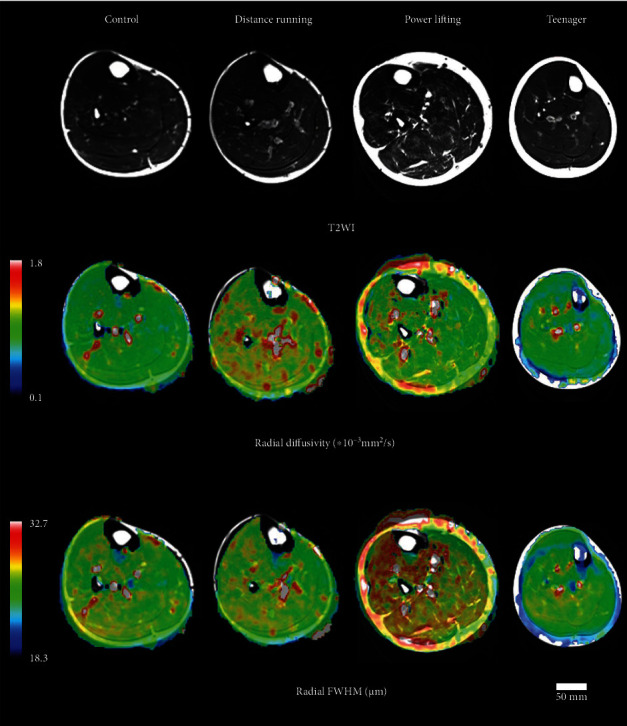
In the human body, skeletal muscle microstructures have been evaluated only by biopsy. Noninvasive examination of the microstructure of muscles would be useful for research and clinical practice in sports and musculoskeletal areas. The study is aimed at determining if q-space imaging (QSI) can reveal the microstructure of muscles in humans. Forty-three Japanese subjects (controls, distance runners, powerlifting athletes, and teenage runners) were included in this cross-sectional study. Magnetic resonance imaging of the lower leg was performed. On each leg muscle, full width at half maximum (FWHM) which indicated the muscle cell diameters and pennation angle (PA) were measured and compared. FWHM showed significant positive correlations with PA, which is related to muscle strength. In addition, FWHM was higher for powerlifting, control, distance running, and teenager, in that order, suggesting that it may be directing the diameter of each muscle cell. Type 1 and type 2 fibers are enlarged by growth, so the fact that the FWHM of the control group was larger than that of the teenagers in this study may indicate that the muscle fibers were enlarged by growth. Also, FWHM has the possibility to increase with increased muscle fibers caused by training. We showed that QSI had the possibility to depict noninvasively the microstructure like muscle fiber type and subtle changes caused by growth and sports characteristics, which previously could only be assessed by biopsy.


Conflict of interest statement

Daisuke Nakashima is the president of Grace Imaging Inc. and holds shares in this company. Yasushi Sera, Daisuke Nakashima, Junichi Hata, and Masaya Nakamura hold the patent on this research. The other authors declare that they have no known competing financial interests or personal relationships that could have appeared to influence the work reported in this paper.

Figures

Figure 1
Figure 1
Method for measuring body composition. (a) Image of the InBody 470®; ∗: hand electrodes; ∗∗: foot electrodes. (b) Measurement of body composition.
Figure 2
Figure 2
Methods for measuring the ROIs. The ROIs of the tibialis anterior muscle (blue square), soleus muscle (green square), and medial head of gastrocnemius muscle (yellow square) on a T2-weighted image. TA: tibialis anterior muscle; SOL: soleus muscle; GAS: gastrocnemius muscle.
Figure 3
Figure 3
Quantification of magnetic resonance imaging parameters in the tibialis anterior muscle. Box and whisker plots: the bottom and top of the box are the first and third quartiles. The band inside the box is the second quartile (median). The ends of the whiskers represent the minimum and maximum of all of the data. White circles are outliers. CSA: cross-sectional area; FWHM: full width at half maximum. P < 0.05 (Dunnett's test; reference = control).
Figure 4
Figure 4
Quantification of magnetic resonance imaging parameters in the gastrocnemius muscle. Box and whisker plots: the bottom and top of the box are the first and third quartiles. The band inside the box is the second quartile (median). The ends of the whiskers represent the minimum and maximum of all of the data. White circles are outliers. CSA: cross-sectional area; FWHM: full width at half maximum. P < 0.05 (Dunnett's test; reference = control).
Figure 5
Figure 5
Color mapping axial sections of magnetic resonance imaging for the four groups. T2WI: T2-weighted imaging; FWHM: full width at half maximum.

Similar articles

References

    1. Pette D., Staron R. S. Myosin isoforms, muscle fiber types, and transitions. Microscopy Research and Technique . 2000;50(6):500–509. doi: 10.1002/1097-0029(20000915)50:6<500::aid-jemt7>3.0.co;2-7. - DOI - PubMed
    1. Sjogaard G. Capillary supply and cross-sectional area of slow and fast twitch muscle fibres in man. Histochemistry . 1982;76(4):547–555. doi: 10.1007/bf00489909. - DOI - PubMed
    1. Nilwik R., Snijders T., Leenders M., et al. The decline in skeletal muscle mass with aging is mainly attributed to a reduction in type II muscle fiber size. Experimental Gerontology . 2013;48(5):492–498. doi: 10.1016/j.exger.2013.02.012. - DOI - PubMed
    1. Fry A. C. The role of resistance exercise intensity on muscle fibre adaptations. Sports Medicine . 2004;34(10):663–679. doi: 10.2165/00007256-200434100-00004. - DOI - PubMed
    1. Serrano N., Colenso-Semple L. M., Lazauskus K. K., et al. Extraordinary fast-twitch fiber abundance in elite weightlifters. PLoS One . 2019;14(3, article e0207975) doi: 10.1371/journal.pone.0207975. - DOI - PMC - PubMed

LinkOut - more resources