. 2022 Jun 14;28(22):2437-2456.
doi: 10.3748/wjg.v28.i22.2437.

18β-glycyrrhetinic acid regulates mitochondrial ribosomal protein L35-associated apoptosis signaling pathways to inhibit proliferation of gastric carcinoma cells

Affiliations

18β-glycyrrhetinic acid regulates mitochondrial ribosomal protein L35-associated apoptosis signaling pathways to inhibit proliferation of gastric carcinoma cells

Ling Yuan et al. World J Gastroenterol. .

Abstract

Background: Gastric carcinoma (GC) is a common gastrointestinal malignancy worldwide. Based on the cancer-related mortality, the current prevention and treatment strategies for GC still show poor clinical results. Therefore, it is important to find effective drug treatment targets.

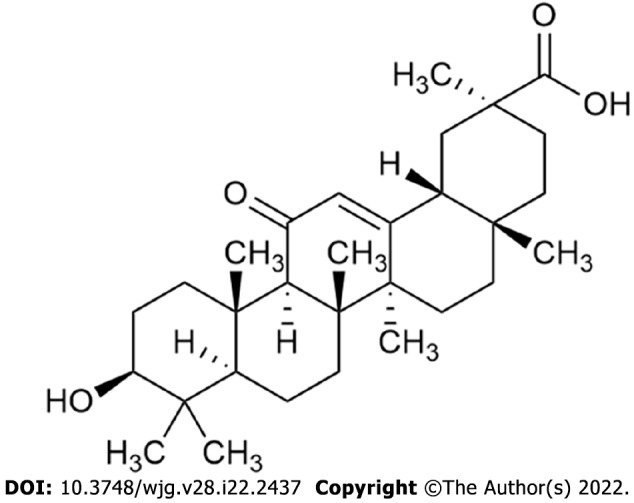
Aim: To explore the mechanism by which 18β-glycyrrhetinic acid (18β-GRA) regulates mitochondrial ribosomal protein L35 (MRPL35) related signal proteins to inhibit the proliferation of GC cells.

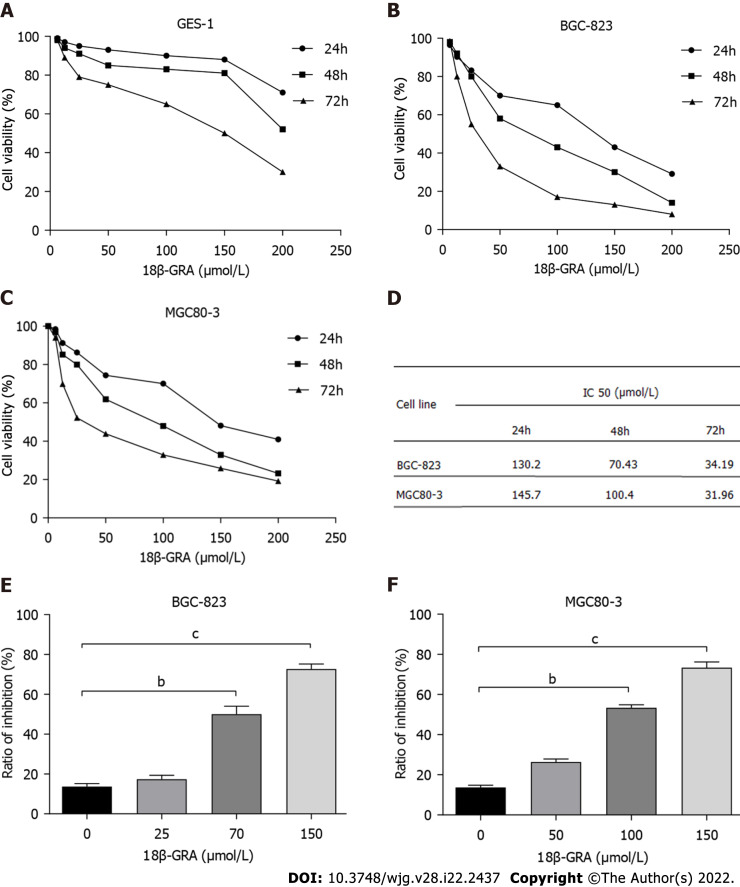
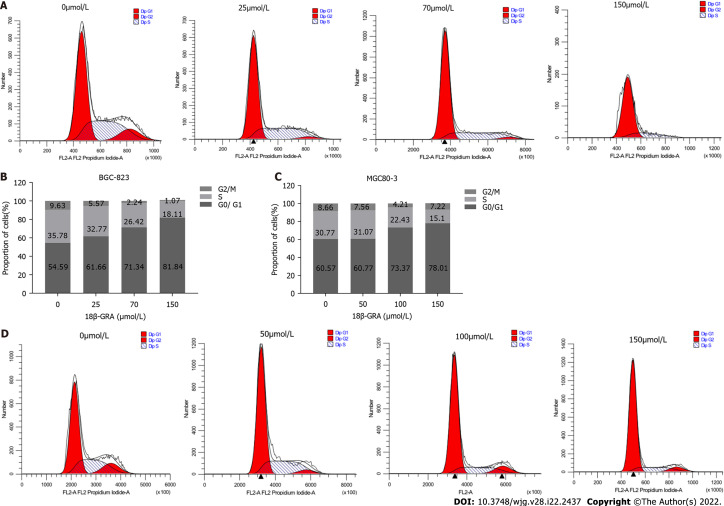
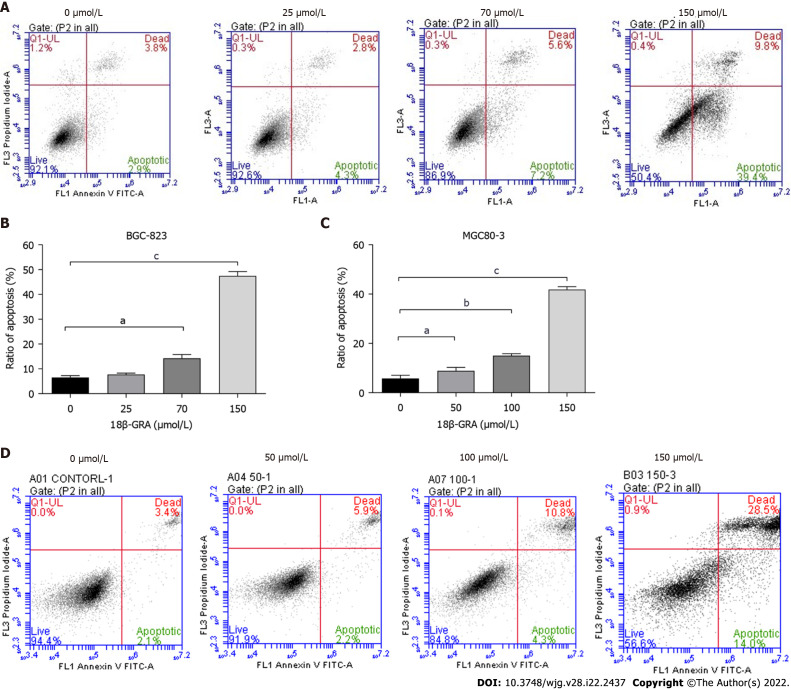
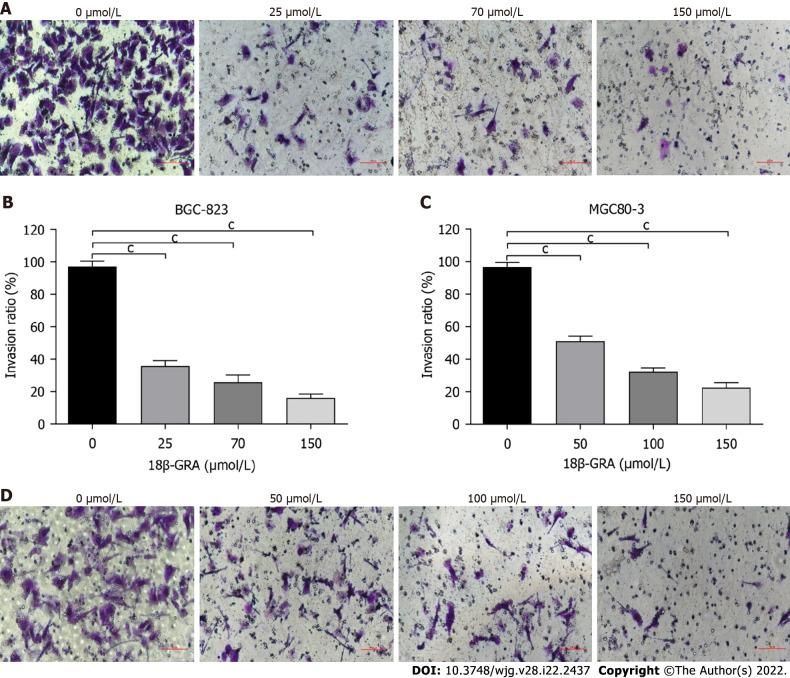
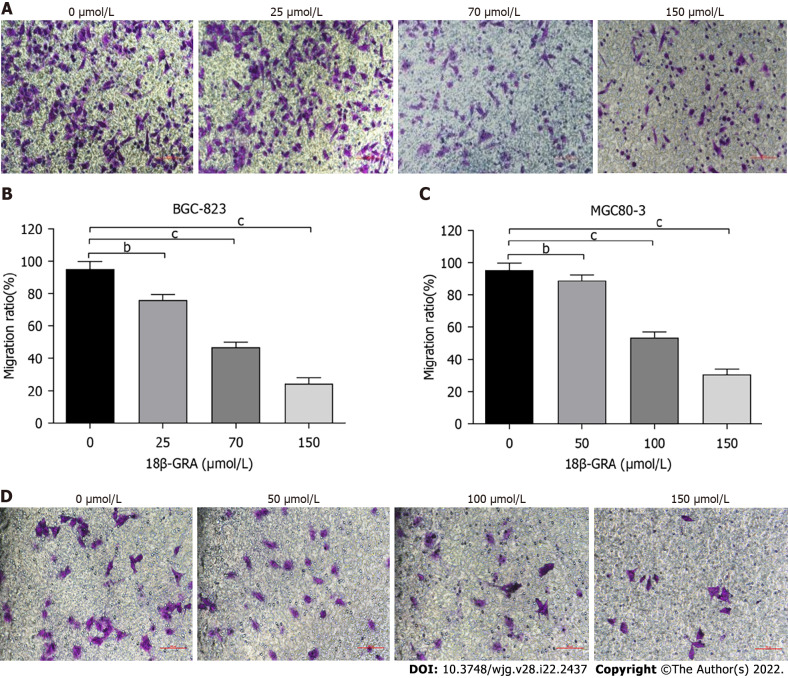
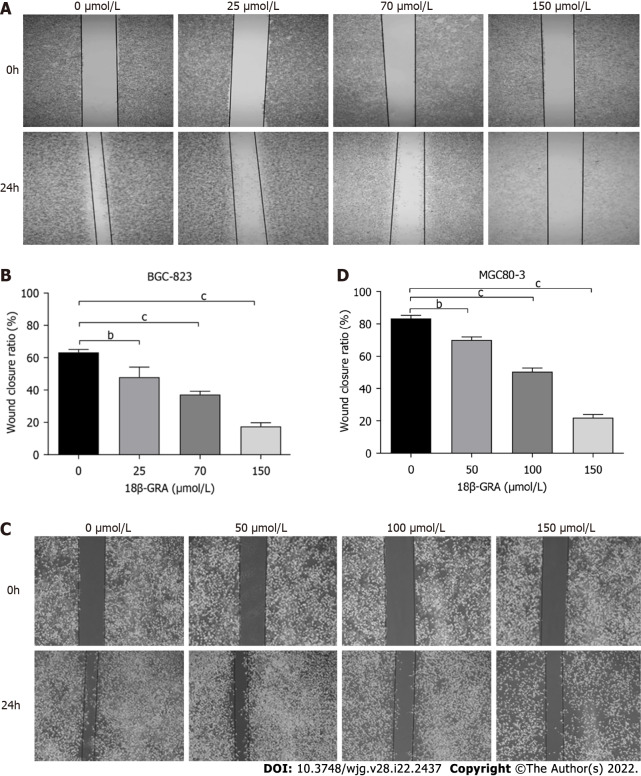
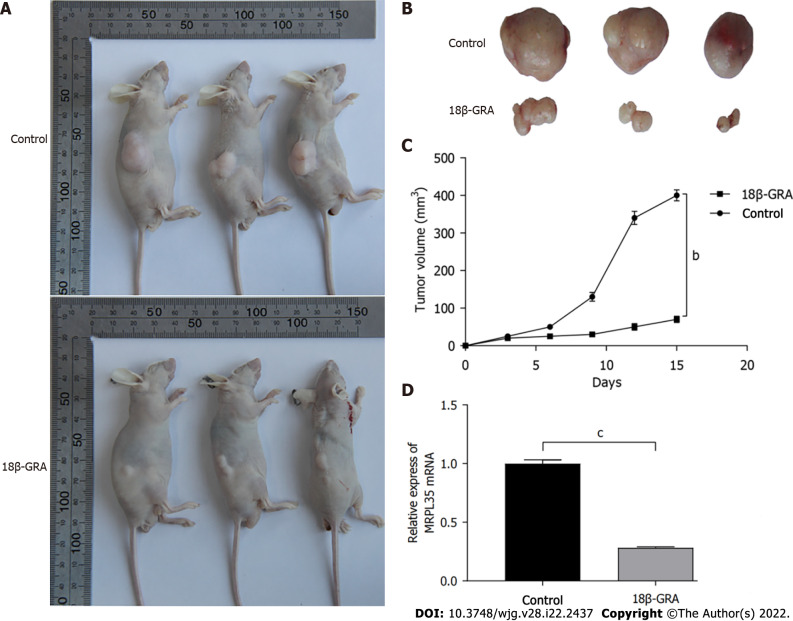
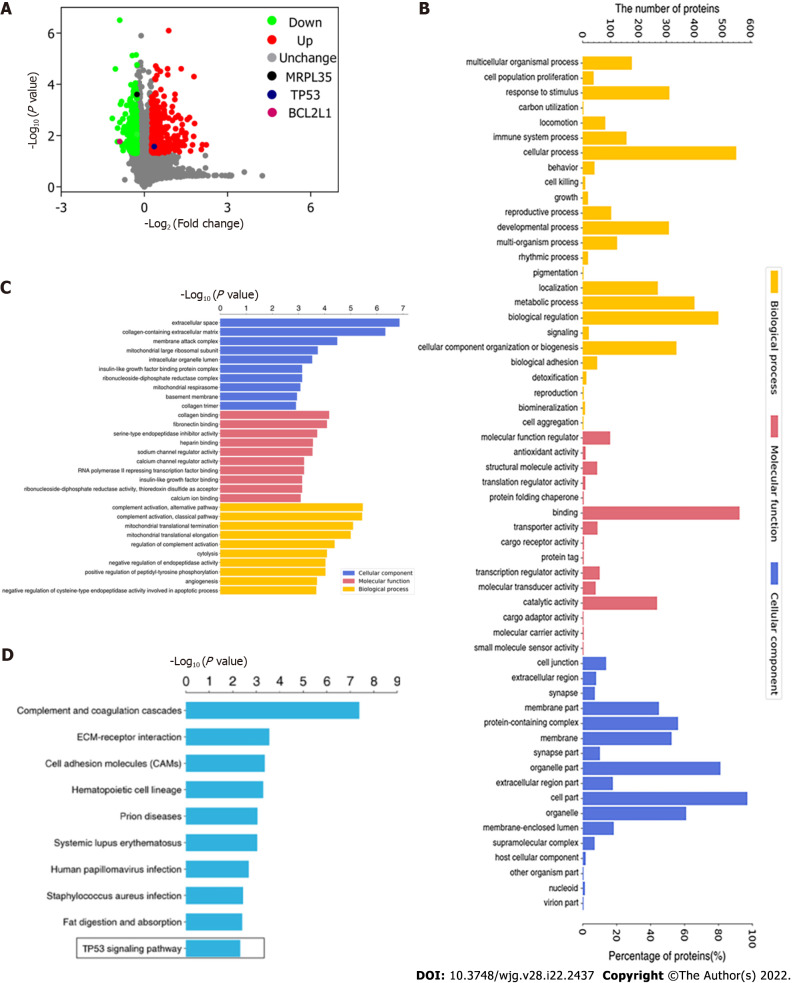
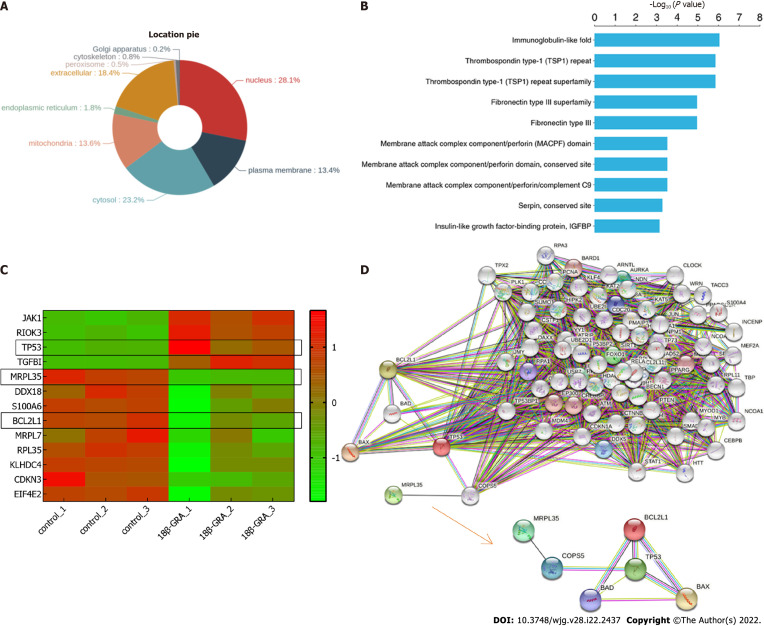
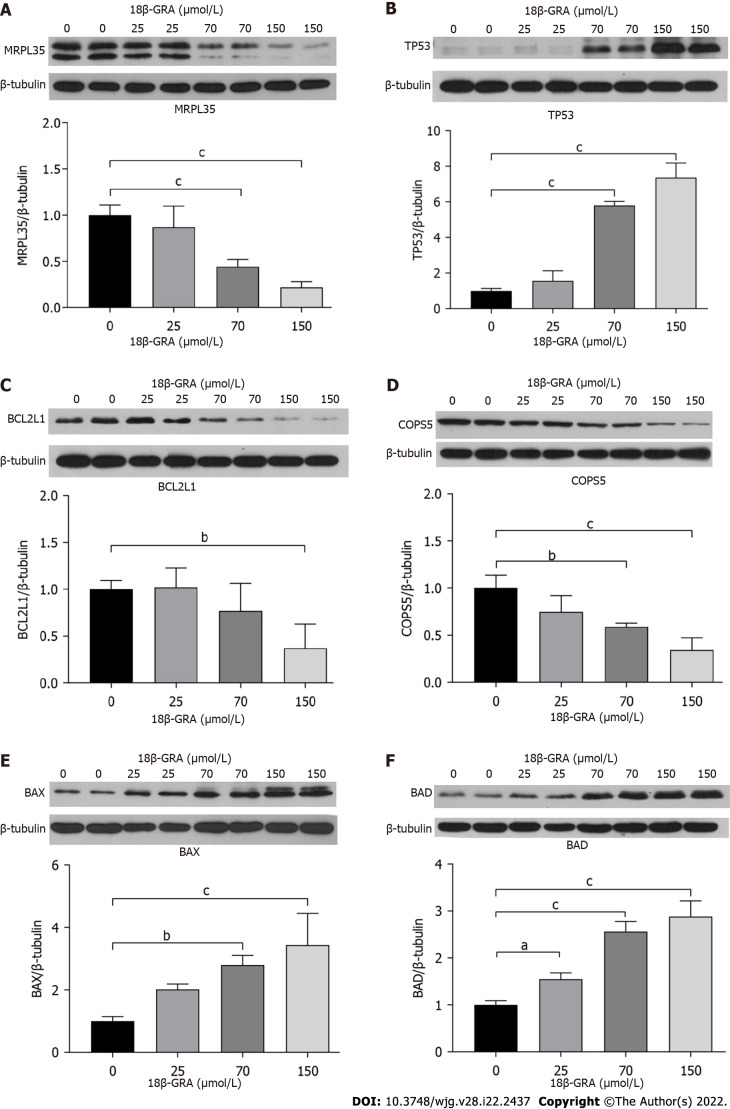
Methods: Cell counting kit-8 assay was used to detect the effects of 18β-GRA on the survival rate of human normal gastric mucosal cell line GES-1 and the proliferation of GC cell lines MGC80-3 and BGC-823. The apoptosis and cell cycle were assessed by flow cytometry. Cell invasion and migration were evaluated by Transwell assay, and cell scratch test was used to detect cell migration. Furthermore, a tumor model was established by hypodermic injection of 2.5 × 10⁶ BGC-823 cells at the selected positions of BALB/c nude mice to determine the effect of 18β-GRA on GC cell proliferation, and quantitative reverse transcription-polymerase chain reaction (qRT-PCR) was used to detect MRPL35 expression in the engrafted tumors in mice. We used the term tandem mass tag (TMT) labeling combined with liquid chromatography-tandem mass spectrometry to screen for differentially expressed proteins (DEPs) extracted from GC cells and control cells after 18β-GRA intervention. A detailed bioinformatics analysis of these DEPs was performed, including Gene Ontology annotation and enrichment analysis, Kyoto Encyclopedia of Genes and Genomes pathway enrichment analysis, and so on. Moreover, STRING database (https://string-db.org/) was used to predict protein-protein interaction (PPI) relationships and Western blot was used to detect the expression of proteins of interest in GC cells.

Results: The results indicated that 18β-GRA could inhibit the proliferation of GC cells in a dose- and time-dependent manner. It could induce GC cell apoptosis and arrest the cell cycle at G0/G1 phase. The proportion of cells arrested at S phase decreased with the increase of 18-GRA dose, and the migration and invasiveness of GC cells were inhibited. The results of animal experiments showed that 18β-GRA could inhibit tumor formation in BALB/c nude mice, and qRT-PCR results showed that MRPL35 expression level was significantly reduced in the engrafted tumors in mice. Using TMT technology, 609 DEPs, among which 335 were up-regulated and 274 were down-regulated, were identified in 18β-GRA intervention compared with control. We found that the intervention of 18β-GRA in GC cells involved many important biological processes and signaling pathways, such as cellular processes, biological regulation, and TP53 signaling pathway. Notably, after the drug intervention, MRPL35 expression was significantly down-regulated (P = 0.000247), TP53 expression was up-regulated (P = 0.02676), and BCL2L1 was down-regulated (P = 0.01699). Combined with the Retrieval of Interacting Genes/Proteins database, we analyzed the relationship between MRPL35, TP53, and BCL2L1 signaling proteins, and we found that COPS5, BAX, and BAD proteins can form a PPI network with MRPL35, TP53, and BCL2L1. Western blot analysis confirmed the intervention effect of 18β-GRA on GC cells, MRPL35, TP53, and BCL2L1 showed dose-dependent up/down-regulation, and the expression of COPS5, BAX, and BAD also increased/decreased with the change of 18β-GRA concentration.

Conclusion: 18β-GRA can inhibit the proliferation of GC cells by regulating MRPL35, COPS5, TP53, BCL2L1, BAX, and BAD.

Keywords: 18β-glycyrrhetinic acid; Apoptosis; Gastric carcinoma; Invasion; Mitochondrial ribosomal protein L35; Proliferation.


Conflict of interest statement

Conflict-of-interest statement: All authors declare no financial or commercial conflict of interest for this article.

Figures

Figure 1
Figure 1
Structure of 18β-glycyrrhetinic acid. The molecular formula for 18β-glycyrrhetinic acid is C30H46O4, and the molecular weight is 470.68.
Figure 2
Figure 2
Effect of 18β-glycyrrhetinic acid on survival rate of GES-1 cells and proliferation of MGC80-3 and BGC-823 cells detected by CCK-8 method. A: GES-1 cells; B: BGC-823 cells; C: MGC80-3 cells; D: IC50 values of 18β-glycyrrhetinic acid (18β-GRA) for BGC-823 cells and MGC80-3 cells after 24 h, 48 h, and 72 h; E and F: Inhibition rate of 18β-GRA acid at different concentrations on BGC-823 and MGC80-3 cell proliferation. All analyses were repeated three times. The data is represented as the mean ± SD. aP < 0.05; bP < 0.01; cP < 0.001. 18β-GRA: 18β-glycyrrhetinic acid.
Figure 3
Figure 3
Effects of different concentrations of 18β-glycyrrhetinic acid on gastric carcinoma cell cycle. A and B: Cell cycle and statistical graph of BGC-823 cells; C and D: Cell cycle and statistical graph of MGC80-3 cells. All analyses were repeated three times. The data is represented as the mean ± SD. aP < 0.05; bP < 0.01; cP < 0.001. 18β-GRA: 18β-glycyrrhetinic acid.
Figure 4
Figure 4
Effects of different concentrations of 18β-glycyrrhetinic acid on gastric carcinoma cell apoptosis. A and B: Cell apoptosis and statistics graph of BGC-823 cells; C and D: Cell apoptosis and statistics graph of MGC80-3 cells. All analyses were repeated three times. The data is represented as the mean ± SD. aP < 0.05; bP < 0.01; cP < 0.001. 18β-GRA: 18β-glycyrrhetinic acid.
Figure 5
Figure 5
Effects of different concentrations of 18β-glycyrrhetinic acid on invasion of human gastric carcinoma cells. A and B: Invasion ability of BGC-823 cells measured by Transwell of Matrigel matrix gel and the statistical graph; C and D: Invasion ability of MGC80-3 cells and statistical graph. All analyses were repeated three times. The data is represented as the mean ± SD. aP < 0.05; bP < 0.01; cP < 0.001. 18β-GRA: 18β-glycyrrhetinic acid.
Figure 6
Figure 6
Effects of different concentrations of 18β-glycyrrhetinic acid on migration of human gastric carcinoma cells. A and B: Migration ability of BGC-823 cells determined by Transwell assay without Matrigel matrix gel and statistical graph; C and D: Migration ability of MGC80-3 cells and statistical graph. All analyses were repeated three times. The data is represented as the mean ± SD. aP < 0.05; bP < 0.01; cP < 0.001. 18β-GRA: 18β-glycyrrhetinic acid.
Figure 7
Figure 7
Effects of different concentrations of 18β-glycyrrhetinic acid on migration of human gastric carcinoma cells. A and B: Effect of 18β-glycyrrhetinic acid (18β-GRA) on migration of BGC-823 cells evaluated by Wound-scratch assay and statistical graph; C and D: Effect of 18β-GRA on the migration of MGC80-3 cells and statistical graph. All analyses were repeated three times. The data is represented as the mean ± SD. aP < 0.05; bP < 0.01; cP < 0.001. 18β-GRA: 18β-glycyrrhetinic acid.
Figure 8
Figure 8
Effect of 18β-glycyrrhetinic acid on tumor size in nude mice. A: Nude mouse gastric carcinoma xenograft model; B: Subcutaneously transplanted tumor in nude mice. n = 6; C: Tumor growth curve of transplanted tumor model; D: Quantitative reverse transcription-polymerase chain reaction was used to detect the expression level of MRPL35 in the transplanted tumor tissues of mice. aP < 0.05; bP < 0.01; cP < 0.001. 18β-GRA: 18β-glycyrrhetinic acid.
Figure 9
Figure 9
Volcano plot of differentially expressed proteins and Gene Ontology annotation analysis. A: Volcano plot of differentially expressed proteins (DEPs). The horizontal axis is the relative quantitative value of protein after log2 conversion, and the vertical axis is the P value of difference significance test after -log10 conversion; B: Gene Ontology (GO) annotation analysis of DEPs. The number of DEPs categorized as biological processes, molecular functions, and cellular components; C: GO enrichment analysis of DEPs. The Y axis denotes the GO functional classification enriched by the DEPs, and the X axis denotes the −log10 of the P value of Fisher’s exact test of the significance of the enrichment; D: KEGG pathway enrichment analysis. The Y axis denotes the categories of KEGG pathways. The X axis is the −log10 of the P value of Fisher’s exact test of the significance of enrichment.
Figure 10
Figure 10
Differentially expressed proteins. A: Subcellular localization chart of differentially expressed proteins (DEPs); B: Protein domain enrichment analysis. The Y axis denotes the categories of the protein domain. The X axis denotes the enrichment score [−log(P value)]; C: Heatmap of the MRPL35, TP53, BCL2L1, and so on. The X-coordinate stands for the DEPs, while Y-coordinate stands for different groups; D: Network analysis of MRPL35, TP53, and BCL2L1. The connection was illustrated using the web-based tool STRING.
Figure 11
Figure 11
Validation of proteomics results using Western blot analysis of MRPL35, TP53, BCL2L1, COPS5, BAX, and BAD in cells treated with different concentrations of 18β-glycyrrhetinic acid for 48 h. β-tubulin was used as the loading control. A: MRPL35; B: TP53; C: BCL2L1; D: COPS5; E: BAX; F: BAD n = 4, aP < 0.05; bP < 0.01; cP < 0.001. 18β-GRA: 18β-glycyrrhetinic acid; MRPL35: Mitochondrial Ribosomal Protein L35.

Similar articles

Cited by

References

    1. Sung H, Ferlay J, Siegel RL, Laversanne M, Soerjomataram I, Jemal A, Bray F. Global Cancer Statistics 2020: GLOBOCAN Estimates of Incidence and Mortality Worldwide for 36 Cancers in 185 Countries. CA Cancer J Clin. 2021;71:209–249. - PubMed
    1. Duan R, Li X, Zeng D, Chen X, Shen B, Zhu D, Zhu L, Yu Y, Wang D. Tumor Microenvironment Status Predicts the Efficacy of Postoperative Chemotherapy or Radiochemotherapy in Resected Gastric Cancer. Front Immunol. 2020;11:609337. - PMC - PubMed
    1. Sun W, Jiang C, Ji Y, Xiao C, Song H. Long Noncoding RNAs: New Regulators of Resistance to Systemic Therapies for Gastric Cancer. Biomed Res Int. 2021;2021:8853269. - PMC - PubMed
    1. Wang CY, Kao TC, Lo WH, Yen GC. Glycyrrhizic acid and 18β-glycyrrhetinic acid modulate lipopolysaccharide-induced inflammatory response by suppression of NF-κB through PI3K p110δ and p110γ inhibitions. J Agric Food Chem. 2011;59:7726–7733. - PubMed
    1. Huang M, Gong P, Wang Y, Xie X, Ma Z, Xu Q, Liu D, Jing Y, Zhao L. Synthesis and antitumor effects of novel 18β-glycyrrhetinic acid derivatives featuring an exocyclic α,β-unsaturated carbonyl moiety in ring A. Bioorg Chem. 2020;103:104187. - PubMed

MeSH terms