

Vitamin B6 Metabolic Pathway is Involved in the Pathogenesis of Liver Diseases via Multi-Omics Analysis
- PMID: 35979344
- PMCID: PMC9377404
- DOI: 10.2147/JHC.S370255
Vitamin B6 Metabolic Pathway is Involved in the Pathogenesis of Liver Diseases via Multi-Omics Analysis
Abstract
Purpose: To clarify the underlying regulatory mechanisms of progression from liver cirrhosis to hepatocellular carcinoma (HCC), we analyzed the microbiomics, metabolomics, and proteomics in plasma and tissues from patients with HCC or decompensated liver cirrhosis (DC).
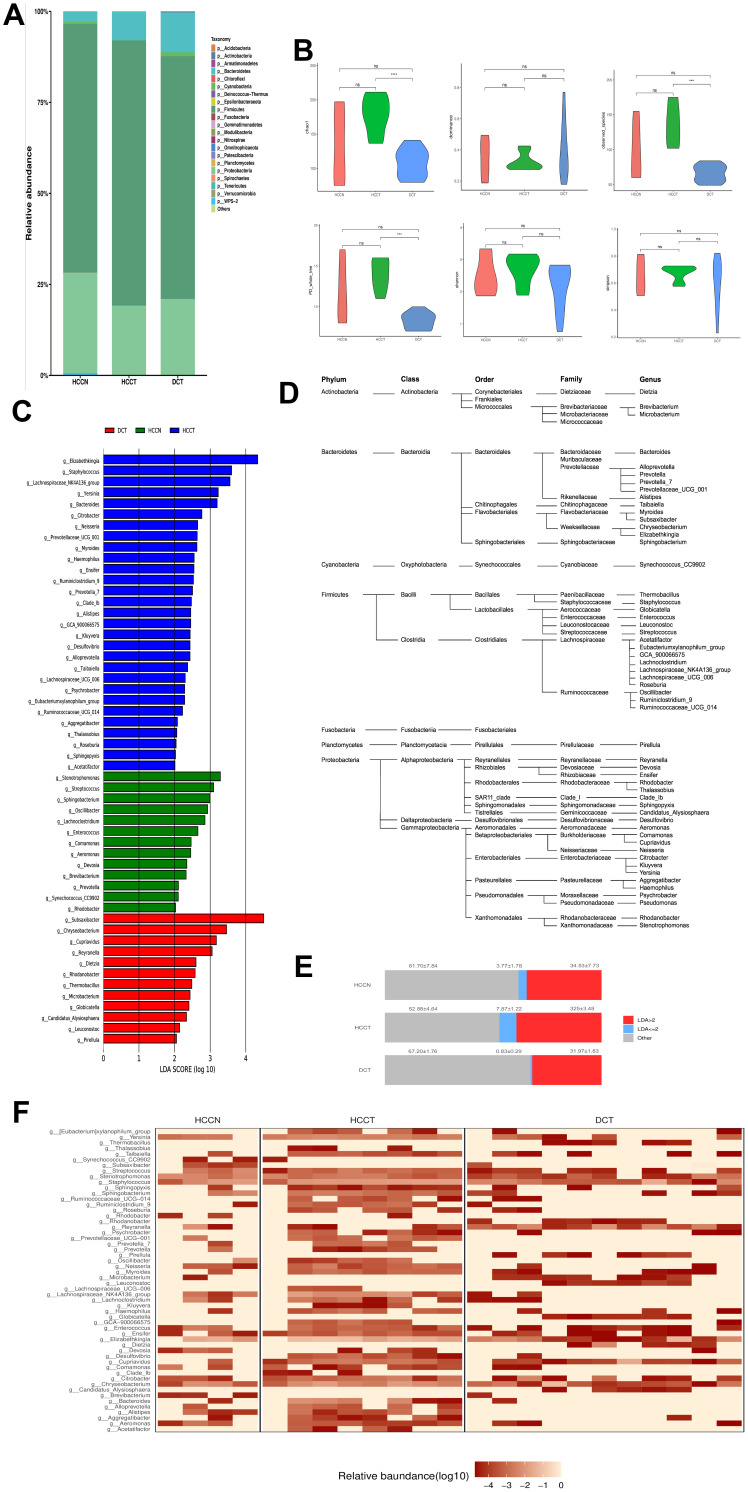
Patients and methods: Tissues and plasma from 44 HCC patients and 28 patients with DC were collected for metabolomic analysis. 16S rRNA sequencing was performed in nine HCC tissues (HCCT), four distal noncancerous tissues (HCCN), and 11 DC tissues (DCT). Five HCC tissues had liver cirrhosis (HCCT-LC). Five hepatocellular carcinoma tissues without liver cirrhosis (HCCT-NLC) and five DCT were selected for proteomic sequencing. After combining proteomic and metabolomic analysis, we constructed a mouse model of chronic liver injury using carbon tetrachloride (CCl4) and treated them with vitamin B6 (VB6).
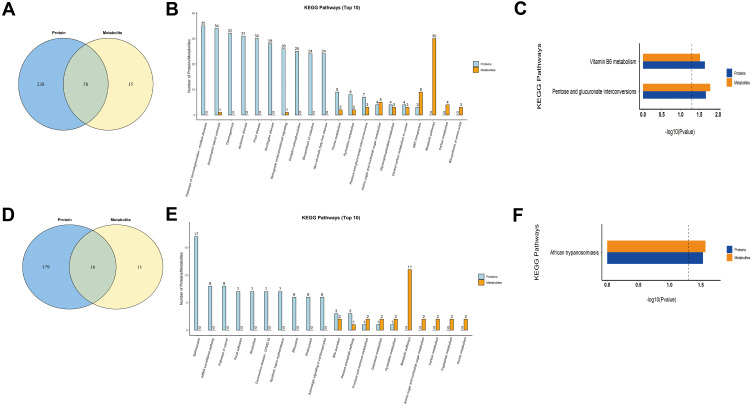
Results: 16s rRNA sequence results showed that HCC tissues had higher alpha diversity. The highest LDA scores were detected for Elizabethkingia in HCCT, Subsaxibacter in DCT, and Stenotrophomon in HCCN. Metabolomics results demonstrated some metabolites, including capric acid, L-threonate, choline, alpha-D-Glucose, D-ribose, betaine, 2E-eicosenoic acid, linoleic acid, L-palmitoylcarnitine, taurodeoxycholic acid, L-pyroglutamic acid, androsterone sulfate, and phthalic acid mono-2-ethylhexyl ester (MEHP), had better diagnostic efficacy than AFP (AUC: 0.852; 95% CI: 0.749, 0.954). In a combined analysis of metabolomics and proteomics, we found that HCCT-LC had more obvious disorders of VB6 metabolism and pentose and glucuronate interconversions than DCT, and kynurenine metabolism disorder was more significant in HCCT-LC than in HCCT-NLC. In the CCl4-induced chronic liver injury model, after VB6 supplementation, inflammatory cell infiltration, hepatocyte edema, and degeneration were significantly improved.
Conclusion: We found significant differences in the flora distribution between HCCT and DC; MEHP was a new diagnostic biomarker of HCC, and VB6 ameliorated the inflammatory cell infiltration, hepatocyte edema, and degeneration in chronic liver injury.
Keywords: cirrhosis; hepatocellular carcinoma; metabolomics; microbiomics; proteomics; vitamin B6.
© 2022 Mei et al.
Conflict of interest statement
The authors report no conflicts of interest in this work.
Figures


Similar articles
-
Multi-Omics Analyses Identify Signatures in Patients with Liver Cirrhosis and Hepatocellular Carcinoma.Cancers (Basel). 2022 Dec 29;15(1):210. doi: 10.3390/cancers15010210. Cancers (Basel). 2022. PMID: 36612207 Free PMC article.
-
Determining the protective effects of Yin-Chen-Hao Tang against acute liver injury induced by carbon tetrachloride using 16S rRNA gene sequencing and LC/MS-based metabolomics.J Pharm Biomed Anal. 2019 Sep 10;174:567-577. doi: 10.1016/j.jpba.2019.06.028. Epub 2019 Jun 21. J Pharm Biomed Anal. 2019. PMID: 31261038
-
Liver cirrhosis contributes to the disorder of gut microbiota in patients with hepatocellular carcinoma.Cancer Med. 2020 Jun;9(12):4232-4250. doi: 10.1002/cam4.3045. Epub 2020 Apr 12. Cancer Med. 2020. PMID: 32281295 Free PMC article.
-
Advances in Multi-Omics Applications in HBV-Associated Hepatocellular Carcinoma.Front Med (Lausanne). 2021 Sep 30;8:754709. doi: 10.3389/fmed.2021.754709. eCollection 2021. Front Med (Lausanne). 2021. PMID: 34660653 Free PMC article. Review.
-
Disease monitoring of hepatocellular carcinoma through metabolomics.World J Hepatol. 2017 Jan 8;9(1):1-17. doi: 10.4254/wjh.v9.i1.1. World J Hepatol. 2017. PMID: 28105254 Free PMC article. Review.
Cited by
-
Metabolomics in hepatocellular carcinoma: From biomarker discovery to precision medicine.Front Med Technol. 2023 Jan 4;4:1065506. doi: 10.3389/fmedt.2022.1065506. eCollection 2022. Front Med Technol. 2023. PMID: 36688143 Free PMC article. Review.
-
Association between vitamin B6 status and liver fibrosis: evidence from NHANES 2005-2010.Front Nutr. 2025 Aug 5;12:1564257. doi: 10.3389/fnut.2025.1564257. eCollection 2025. Front Nutr. 2025. PMID: 40837430 Free PMC article.
-
Mechanism of the Effect of Compound Anoectochilus roxburghii (Wall.) Lindl. Oral Liquid in Treating Alcoholic Rat Liver Injury by Metabolomics.Drug Des Devel Ther. 2023 Nov 15;17:3409-3428. doi: 10.2147/DDDT.S427837. eCollection 2023. Drug Des Devel Ther. 2023. PMID: 38024538 Free PMC article.
-
Integrative multi-omics characterization of hepatocellular carcinoma in Hispanic patients.J Natl Cancer Inst. 2024 Dec 1;116(12):1961-1978. doi: 10.1093/jnci/djae207. J Natl Cancer Inst. 2024. PMID: 39189979 Free PMC article.
-
Advances in experimental animal models of hepatocellular carcinoma.Cancer Med. 2023 Jul;12(14):15261-15276. doi: 10.1002/cam4.6163. Epub 2023 May 29. Cancer Med. 2023. PMID: 37248746 Free PMC article. Review.
References
-
- Sung H, Ferlay J, Siegel RL, et al. Global Cancer Statistics 2020: GLOBOCAN Estimates of Incidence and Mortality Worldwide for 36 Cancers in 185 Countries. CA Cancer J Clin. 2021;71(3):209–249. - PubMed
-
- Craig AJ, von Felden J, Garcia-Lezana T, Sarcognato S, Villanueva A. Tumour evolution in hepatocellular carcinoma. Nat Rev Gastroenterol Hepatol. 2020;17(3):139–152. - PubMed
-
- Forner A, Reig M, Bruix J. Hepatocellular carcinoma. Lancet. 2018;391(10127):1301–1314. - PubMed
-
- Garrido A, Djouder N. Cirrhosis: a Questioned Risk Factor for Hepatocellular Carcinoma. Trends in Cancer. 2021;7(1):29–36. - PubMed
-
- West J, Card TR, Aithal GP, Fleming KM. Risk of hepatocellular carcinoma among individuals with different aetiologies of cirrhosis: a population-based cohort study. Aliment Pharmacol Ther. 2017;45(7):983–990. - PubMed
LinkOut - more resources
Full Text Sources
