

Comparison of the alkalizing abilities between 1.35% sodium bicarbonate solutions with and without dextrose in healthy calves
- PMID: 35979555
- PMCID: PMC9586027
- DOI: 10.1292/jvms.22-0289
Comparison of the alkalizing abilities between 1.35% sodium bicarbonate solutions with and without dextrose in healthy calves
Abstract
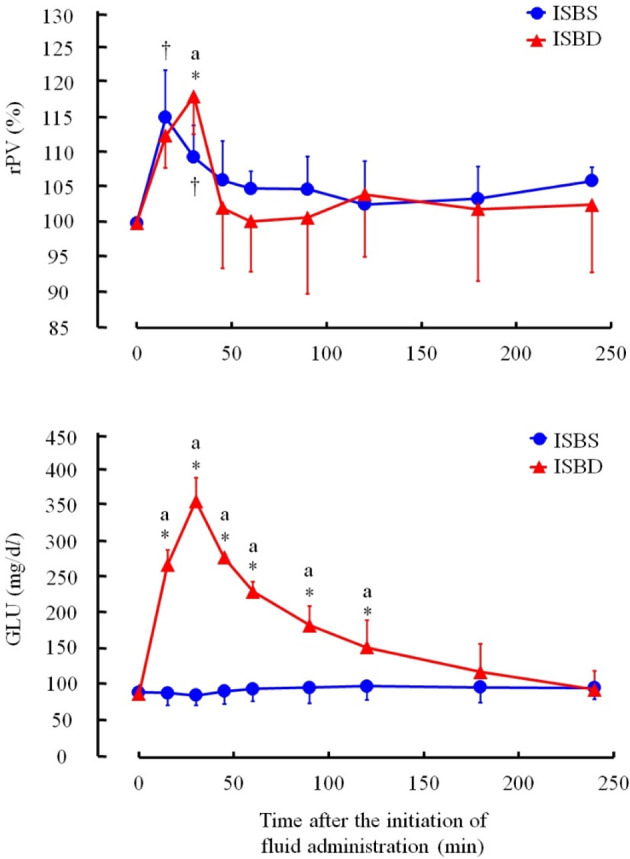
The present study aimed to clarify the alkalizing ability of 1.35% isotonic sodium bicarbonate solution (ISBS), which did not contain dextrose, compared with that of 1.35% isotonic bicarbonate sodium solution containing 4.03% dextrose (ISBD) in healthy calves. The calves were intravenously administered with 20.7 mL/kg of the solutions for 30 min as the volume required to correct base deficit of 10 mM. ISBS increased the blood pH, HCO3-, and base excess from 7.44 ± 0.02, 29.6 ± 1.9 mM, and 5.3 ± 2.1 mM to 7.49 ± 0.02, 36.9 ± 2.3 mM, and 13.5 ± 2.6 mM respectively (P<0.05). These factors for the ISBD group increased from 7.41 ± 0.02, 29.0 ± 1.1 mM, and 4.5 ± 1.3 mM to 7.43 ± 0.02, 33.5 ± 1.9 mM, and 9.5 ± 1.7 mM (P<0.05), respectively. Furthermore, in the ISBD group, the relative plasma volume and blood glucose level increased while the K+ level decreased, which did not occur in the ISBS group. Therefore, the results revealed that ISBS had better alkalizing ability in calves than ISBD.
Keywords: calf; dextrose; hyperkalemia; isotonic sodium bicarbonate; metabolic acidosis.
Figures


Similar articles
-
Effect of intravenous infusion of isotonic sodium bicarbonate solution on acidemic calves with diarrhea.J Vet Med Sci. 2002 Dec;64(12):1173-5. doi: 10.1292/jvms.64.1173. J Vet Med Sci. 2002. PMID: 12520117 Clinical Trial.
-
Comparison of the alkalizing effects of bicarbonate precursors in calves with experimentally induced metabolic acidosis.J Vet Med Sci. 2009 Jun;71(6):807-9. doi: 10.1292/jvms.71.807. J Vet Med Sci. 2009. PMID: 19578293
-
Comparison of the effects of intravenous administration of isotonic and hypertonic sodium bicarbonate solutions on venous acid-base status in dehydrated calves with strong ion acidosis.J Am Vet Med Assoc. 2010 May 15;236(10):1098-103. doi: 10.2460/javma.236.10.1098. J Am Vet Med Assoc. 2010. PMID: 20470072 Clinical Trial.
-
Evaluation of isotonic sodium bicarbonate solution for alkalizing effects in conscious calves.J Vet Med Sci. 2002 Aug;64(8):699-703. doi: 10.1292/jvms.64.699. J Vet Med Sci. 2002. PMID: 12237515
-
Pathophysiologic changes due to coronavirus-induced diarrhea in the calf.J Am Vet Med Assoc. 1978 Sep 1;173(5 Pt 2):636-42. J Am Vet Med Assoc. 1978. PMID: 212408 Review.
References
-
- Berchtold JF, Constable PD, Smith GW, Mathur SM, Morin DE, Tranquilli WJ. 2005. Effects of intravenous hyperosmotic sodium bicarbonate on arterial and cerebrospinal fluid acid-base status and cardiovascular function in calves with experimentally induced respiratory and strong ion acidosis. J Vet Intern Med 19: 240–251. doi: 10.1111/j.1939-1676.2005.tb02688.x - DOI - PubMed
-
- Constable PD, Stämpfli HR, Navetat H, Berchtold J, Schelcher F. 2005. Use of a quantitative strong ion approach to determine the mechanism for acid-base abnormalities in sick calves with or without diarrhea. J Vet Intern Med 19: 581–589. - PubMed
-
- Coskun A, Sen I, Guzelbektes H, Ok M, Turgut K, Canikli S. 2010. Comparison of the effects of intravenous administration of isotonic and hypertonic sodium bicarbonate solutions on venous acid-base status in dehydrated calves with strong ion acidosis. J Am Vet Med Assoc 236: 1098–1103. doi: 10.2460/javma.236.10.1098 - DOI - PubMed