. 2022 Aug;12(8):e995.
doi: 10.1002/ctm2.995.

Dysregulated glucuronic acid metabolism exacerbates hepatocellular carcinoma progression and metastasis through the TGFβ signalling pathway

Affiliations

Dysregulated glucuronic acid metabolism exacerbates hepatocellular carcinoma progression and metastasis through the TGFβ signalling pathway

Qingzhu Gao et al. Clin Transl Med. 2022 Aug.

Erratum in

Abstract

Background: Glucuronic acid metabolism participates in cellular detoxification, extracellular matrix remodeling and cell adhesion and migration. Here, we aimed to explore the crosstalk between dysregulated glucuronic acid metabolism and crucial metastatic signalling in glutathione S-transferase zeta 1 (GSTZ1)-deficient hepatocellular carcinoma (HCC).

Methods: Transwell, HCC xenograft and Gstz1-/- mouse models were used to examine the role of GSTZ1 in HCC metastasis. Non-targeted and targeted metabolomics and global transcriptomic analyses were performed to screen significantly altered metabolic and signalling pathways in GSTZ1 overexpressing hepatoma cells. Further, RNA-binding protein immunoprecipitation, Biotin-RNA pull-down, mRNA decay assays and luciferase reporter assays were used to explore the interaction between RNA and RNA-binding proteins.

Results: GSTZ1 was universally silenced in both human and murine HCC cells, and its deficiency contributed to HCC metastasis in vitro and in vivo. UDP-glucose 6-dehydrogenase (UGDH)-mediated UDP-glucuronic acid (UDP-GlcUA) accumulation promoted hepatoma cell migration upon GSTZ1 loss. UDP-GlcUA stabilized TGFβR1 mRNA by enhancing its binding to polypyrimidine tract binding protein 3, contributing to the activation of TGFβ/Smad signalling. UGDH or TGFβR1 blockade impaired HCC metastasis. In addition, UGDH up-regulation and UDP-GlcUA accumulation correlated with increased metastatic potential and decreased patient survival in GSTZ1-deficient HCC.

Conclusions: GSTZ1 deficiency and subsequent up-regulation of the glucuronic acid metabolic pathway promotes HCC metastasis by increasing the stability of TGFβR1 mRNA and activating TGFβ/Smad signalling. UGDH and a key metabolite, UDP-GlcUA, may serve as prognostic markers. Targeting UGDH might be a promising strategy for HCC therapy.

Keywords: TGFβ/Smad signalling; UDP-GlcUA; UGDH; hepatocellular carcinoma metastasis.


Conflict of interest statement

The authors have declared that no conflict of interest exists.

Figures

FIGURE 1
FIGURE 1
GSTZ1 loss accelerates hepatocellular carcinoma (HCC) metastasis both in vitro and in vivo. (A) Quantitative reverse transcription‐PCR (qRT‐PCR) analysis of epithelial‐to‐mesenchymal transition (EMT)‐related genes SNAI1, VIM, CDH2, FN1, VTN, CRB3, and OCLN in Huh7 or SK‐Hep1 cells infected with AdGSTZ1 or AdGFP, or GSTZ1‐KO SNU449 cells (n = 3). (B) Immunoblotting analysis of EMT‐related proteins. (C) Scheme for tail‐vein injection of GSTZ1‐OE Huh7 cells or GSTZ1‐KO SNU449 cells into randomized BALB/c nude mice. (D and E) Hematoxylin‐and‐eosin (H&E) staining of occult metastases in mouse lung tissue sections. Scale bar: 10 μm. (F and G) Number of lung metastases (n = 6 per group). (H and L) Scheme for diethylnitrosamine (DEN) and CCl4 treatment to induce HCC mouse model in C57BL/6J wild‐type (WT) and Gstz1 −/− mice (H). PB, phenobarbital. H&E staining of mouse liver tissue (I). NT, non‐tumour; T, tumour. Representative images (J and K) and quantification (L) of lung metastasis. Scale bar: 50 μm. Data are mean ± SD. p‐Values were derived from an unpaired, two‐tailed Student's t‐test in (A); Mann–Whitney U test in (F, G and L) (*p < .05, **p < .01, ***p < .001).
FIGURE 2
FIGURE 2
GSTZ1 deficiency enhances glucuronic pathway activity. (A) Principal component analysis of metabolite signatures in Huh7 cells infected with AdGSTZ1 or AdGFP using a metabolomics assay. PC, primary component. (B) Heatmap of differentially expressed metabolites subjected to identical treatment conditions as in (A). (C) Overview of the glucuronic pathway. (D) Relative changes in intermediate metabolites of the glucuronic pathway. (E–G) Uridine 5′‐diphosphate glucuronic acid (UDP‐GlcUA) levels in GSTZ1‐OE Huh7 cells (E), GSTZ1‐KO SNU449 cells (F) and Gstz1 −/− mice liver tissues (G) quantified by the liquid chromatography‐tandem mass spectrometry (LC‐MS/MS)‐targeted metabolomics assay. (H) Transwell migration assays and quantification of the migrated cells in hepatoma cells supplemented with or without UDP‐GlcUA (0.5 mM for Huh7, 1 mM for SK‐Hep1, and 0.5 mM for SNU‐449) for 24 h. The migrated cells were stained with crystal violet staining. n = 3 independent experiments. (I) Representative immunofluorescence staining of E‐cadherin and vimentin from three independent experiments. Scale bar, 100 μm. Data are mean ± SD. p‐Values were derived from an unpaired, two‐tailed Student's t‐test in (D–F and H), and Mann–Whitney U test in (G) (**p < .01, ***p < .001).
FIGURE 3
FIGURE 3
GSTZ1 loss activates transforming growth factor‐β/Smad signalling. (A) RNA sequencing analysis of top 10 significantly down‐regulated Kyoto Encyclopedia of Genes and Genomes (KEGG) pathways between AdGSTZ1‐ and AdGFP‐infected Huh7 cells (n = 3, each). (B) Heatmap of TGFβ/Smad pathway‐related differentially expressed genes (DEGs) identified based on the following criteria: false discovery rate < 0.05 and fold change > 1.5 or < 0.666. (C–E) TGFβ/Smad‐mediated gene transcriptional activities in GSTZ1‐OE (C and D) or ‐KO (E) Hepatocellular carcinoma (HCC) cells as assessed by smad binding element (SBE)‐luciferase assays (n = 3). (F and G) Intracellular localization of Smad2/3 (red) in GSTZ1‐OE Huh7 (F) or GSTZ1‐KO SNU‐449 cells (G). (H and I) Western blot analysis of cytoplasmic and nuclear Smad2/3 protein expression in GSTZ1‐OE Huh7 (H) or GSTZ1‐KO SNU‐449 (I) cells. β‐tubulin and laminB1 served as quality control for cytoplasmic and nuclear fractions, respectively. (J) Model of activation of the TGFβ/Smad pathway. (K and P) Quantification of the migrated cells and immunoblots of the epithelial‐to‐mesenchymal transition (EMT)‐related proteins in GSTZ1‐OE Huh7 cells supplemented with or without TGFβ1 (10 ng/ml, 24 h) (K and L), and GSTZ1‐KO SNU‐449 cells transfected with shSmad2 (M and N) or supplemented with SB431542 (10 μM, 36 h) (O and P). Data are mean ± SD. p‐Values were derived from an unpaired, two‐tailed Student's t‐test in (C–E); one‐way Analysis of Variance (ANOVA) followed by the Tukey test in (K, M, and O) (**p < .01, ***p < .001).
FIGURE 4
FIGURE 4
UDP‐GlcUA stabilizes TGFβR1 mRNA and activates TGFβ/Smad signalling. (A–C) qRT‐PCR analysis of TGFβ/Smad pathway‐related genes (n = 3). (D–F) The expression of TGF‐β/Smad pathway‐related proteins by immunoblot. (G and H) TGFβR1 mRNA half‐life in Huh7 and SNU449 cells supplemented with or without UDP‐GlcUA for 30 min before treated with DRB (50 μM) for indicated times (n = 3 independent experiments). DRB, 5,6‐dichloro‐1‐beta‐ribo‐furanosyl benzimidazole. (I) RNA Immunoprecipitation (RIP)‐qPCR showing the binding of PTBP3 to the TGFβR1 in Huh7 cells supplemented with or without UDP‐GlcUA. IgG served as a negative control. (J–M) mRNA (J and K) and protein (L and M) expression levels of TGFβR1 in PTBP3‐depleted Huh7 and SNU449 cells after 0.5 h of UDP‐GlcUA treatment. (N and O) mRNA half‐life of TGFβR1 in PTBP3‐depletion Huh7 (N) and SNU449 (O) cells after 0.5 h of UDP‐GlcUA treatment. Data are mean ± SD. p‐Values were derived from an unpaired, two‐tailed Student's t‐test in (A–C), (G–I), (N–O) and one‐way ANOVA  followed by the Tukey test in (J and K) (*p < .01, **p < .01, ***p < .001).
FIGURE 5
FIGURE 5
UDP‐GlcUA enhances TGFβR1 mRNA binding of PTBP3. (A) DARTS assays with pronase digestion in Huh7 cells upon UDP‐GlcUA treatment. (B) Cellular thermal shift assay curves for PTBP3 in cell lysates supplemented with or without UDP‐GlcUA. Proteins denatured at the indicated temperature were probed with anti‐PTBP3, with GAPDH as a loading control. The bands were quantified using the Image‐Pro Plus analyzer software and normalized to the protein level of PTBP3 detected at 37°C (n = 3). (C) Conserved consensus PTBP3 response element (PRE). (D) Schematic drawing of two predicted consensus PTB response elements (PREs) in TGFβR1 mRNA 3′‐UTR. WT for wild‐type, Mut 1 for PRE1 mutation, Mut 2 for PRE2 mutation, Mut 1 and Mut 2 for combo mutation. (E) Relative luciferase activities in Huh7 cells with or without PTBP3 depletion (n = 3 independent experiments). (F) Relative luciferase activities in Huh7 cells transfected with 3′‐UTR segments containing wild type (WT) or PRE‐1/2 mutants upon UDP‐GlcUA supplementation. (G–I) Streptavidin agarose affinity pull‐down assay using biotin‐PRE1 as a probe (G) in Huh7 cells with UDP‐glucose 6‐dehydrogenase (UGDH) depletion (H) or supplemented with UDP‐GlcUA (I). PRE1‐Mut served as a negative control. (J) Streptavidin agarose affinity pull‐down assay using biotin‐PREs (1 μg) as a probe by mixing purified recombinant His‐RRM3/4 (5 μg) and increasing doses of UDP‐GlcUA. Data are mean ± SD. p‐Values were derived from an unpaired, two‐tailed Student's t‐test in (B and E–F) (*p < .01, ***p < .001).
FIGURE 6
FIGURE 6
Blockage of the glucuronic pathway or TGFβ signalling blunts hepatocellular carcinoma (HCC) metastasis driven by Gstz1 loss. (A) Schematic representation of diethylnitrosamine (DEN) and CCl4‐ induced mouse model of HCC. PB, phenobarbital. (B) Representative images of lung metastasis. (C) Hematoxylin‐and‐eosin (H&E) staining of occult metastases in lung tissue sections. Scale bar, 500 μm. (D) Number of lung metastases. Data represent mean ± SD of the relative number of nodules per mouse for six mice. (E) UDP‐GlcUA levels in mouse liver tissues. n = 6. (F) The relative content of UDP‐GlcUA normalized to the average UDP‐GlcUA level in serum samples obtained from Gstz1 +/+ mice . n = 6. (G) Hematoxylin‐and‐eosin (H&E) and Immunohistochemistry (IHC) staining for GSTZ1, UGDH, pSmad2/3 and Snail in WT and Gstz1 /‐ mouse liver sections. NT, non‐tumour; T, tumour. Scale bar: 50 μm. Data are mean ± SD. p‐Values were derived from a one‐way ANOVA followed by the Tukey test in (D, E and F) (*p < .05, ***p < .001).
FIGURE 7
FIGURE 7
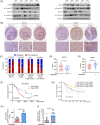
GSTZ1 deficiency with UGDH up‐regulation promotes hepatocellular carcinoma (HCC) metastasis. (A) Western blotting for UGDH, pSmad2/3, GSTZ1 and E‐cadherin in tumour tissues from HCC patients with metastatic recurrence and adjacent non‐tumoural tissues. (B) Representative Immunohistochemistry (IHC) staining of GSTZ1 and UGDH in HCC tissue microarray. Scores (ranging 0–3) were calculated by intensity and percentage of stained cells. Scale bar, 200 μm. (C) Percentage of metastatic or non‐metastatic recurrence of HCC patients (n = 58 samples), stratified by GSTZ1 and UGDH expression. Specifically, HCC patients were classified into low (scores of 5–92, 41 cases) versus high (scores of 93–159, 17 cases) GSTZ1 expression and low (scores of 89–138, 41 cases) versus high (scores of 139–162, 17 cases) UGDH expression subgroups. (D and E) Staining scores of GSTZ1 and UGDH in tumour tissues from HCC patients with metastatic recurrence (n = 21) and without metastatic recurrence (n = 37). (F) Kaplan–Meier survival analysis of overall survival rate for HCC patients in GSTZ1 low subgroup stratified by UGDH expression, using tissue microarray cohort. (G) Kaplan–Meier survival analysis of overall survival rate for patients with HCC from The Cancer Genome Atlas (TCGA)‐liver hepatocellular carcinoma dataset (n = 365), stratified by GSTZ1 and UGDH expression. (H) UDP‐GlcUA levels in tumour tissues from HCC patients with (n = 10) or without (n = 18) metastatic recurrence. (I) UDP‐GlcUA levels in serum samples from HCC patients with (n = 36) or without (n = 34) metastatic recurrence. Data are mean ± SD. p‐Values were derived from a chi‐square test in (C); an unpaired, two‐tailed Student's t‐test in (D and E); a two‐sided log‐rank test in (F–G), and Mann–Whitney U test in (H and I). (*p < .05, **p < .01, ***p < .001).
FIGURE 8
FIGURE 8
Proposed working model of this study. UDP‐glucose 6‐dehydrogenase (UGDH)‐mediated UDP‐GlcUA accumulation promotes hepatoma cell migration upon GSTZ1 loss. UDP‐GlcUA stabilized TGFβR1 mRNA by enhancing its binding to PTBP3, contributing to the activation of TGFβ/Smad signalling.

Similar articles

Cited by

References

    1. Steinway S, Zañudo J, Ding W, et al. Network modeling of TGFβ signaling in hepatocellular carcinoma epithelial‐to‐mesenchymal transition reveals joint sonic hedgehog and Wnt pathway activation. Cancer Res 2014;74:5963‐5977. - PMC - PubMed
    1. Fransvea E, Angelotti U, Antonaci S, Giannelli G. Blocking transforming growth factor‐beta up‐regulates E‐cadherin and reduces migration and invasion of hepatocellular carcinoma cells. Hepatology 2008;47:1557‐1566. - PubMed
    1. Acloque H, Adams M, Fishwick K, Bronner‐Fraser M, Nieto M. Epithelial‐mesenchymal transitions: the importance of changing cell state in development and disease. J Clin Invest 2009;119:1438‐1449. - PMC - PubMed
    1. Lehuédé C, Dupuy F, Rabinovitch R, Jones R, Siegel P. Metabolic plasticity as a determinant of tumor growth and metastasis. Cancer Res 2016;76:5201‐5208. - PubMed
    1. Bergers G, Fendt S. The metabolism of cancer cells during metastasis. Nat Rev Cancer 2021;21:162‐180. - PMC - PubMed

Publication types

MeSH terms