. 2022 Sep 9;50(16):9279-9293.
doi: 10.1093/nar/gkac689.

Metagenomics versus total RNA sequencing: most accurate data-processing tools, microbial identification accuracy and perspectives for ecological assessments

Affiliations

Metagenomics versus total RNA sequencing: most accurate data-processing tools, microbial identification accuracy and perspectives for ecological assessments

Christopher A Hempel et al. Nucleic Acids Res. .

Abstract

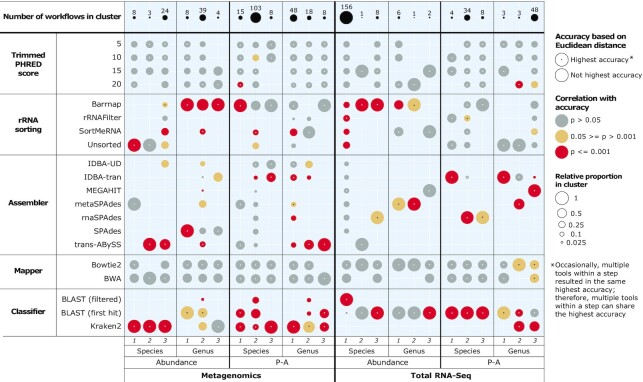
Metagenomics and total RNA sequencing (total RNA-Seq) have the potential to improve the taxonomic identification of diverse microbial communities, which could allow for the incorporation of microbes into routine ecological assessments. However, these target-PCR-free techniques require more testing and optimization. In this study, we processed metagenomics and total RNA-Seq data from a commercially available microbial mock community using 672 data-processing workflows, identified the most accurate data-processing tools, and compared their microbial identification accuracy at equal and increasing sequencing depths. The accuracy of data-processing tools substantially varied among replicates. Total RNA-Seq was more accurate than metagenomics at equal sequencing depths and even at sequencing depths almost one order of magnitude lower than those of metagenomics. We show that while data-processing tools require further exploration, total RNA-Seq might be a favorable alternative to metagenomics for target-PCR-free taxonomic identifications of microbial communities and might enable a substantial reduction in sequencing costs while maintaining accuracy. This could be particularly an advantage for routine ecological assessments, which require cost-effective yet accurate methods, and might allow for the incorporation of microbes into ecological assessments.


Figures

Figure 1.
Figure 1.
Summary of the study design. Three mock community replicates were obtained by mixing a commercially available microbial mock community with ultrapure water. Samples were filtered through 0.2 μm filters. DNA and total RNA were extracted in parallel and shotgun-sequenced, representing two sequencing methods (metagenomics and total RNA-Seq). The sequencing data were processed using 768 combinations of common data-processing tools, i.e. data-processing workflows. The accuracy of each workflow was statistically evaluated by calculating the Euclidean distance between accuracy metrics determined for each workflow and reference accuracy metrics based on the known mock community composition.
Figure 2.
Figure 2.
Summary of the 768 workflows applied to metagenomics and total RNA-Seq data, including the steps and tools used to process the data. Note that in step 3, some assemblers are metagenomics- and some metatranscriptomics-optimized, yet we tested all on both metagenomics and total RNA-Seq data. We were unable to run Trinity successfully and excluded it from further analysis (for more details see the methods section ‘Step three (assembly)’), therefore, the total number of successfully run workflows was 672.
Figure 3.
Figure 3.
Relative frequency of data-processing tools within clusters of most accurate workflows (circle size), significance of correlations between tools and accuracy (circle colour), and most accurate tools based on different evaluation levels (dot in circle centre). Evaluation levels consisted of combinations of sequencing type (metagenomics/total RNA-Seq), data type (abundance/P–A), and taxonomic rank (genus/species). Each column represents one evaluation level utilized for one of three replicates. The relative frequency of tools and the tool with the highest accuracy were determined for each data-processing step separately. Performances differed substantially among replicates and evaluation levels.
Figure 4.
Figure 4.
Comparison of the most accurate metagenomics- and total RNA-Seq-based workflow of each replicate for multiple evaluation levels based on the Euclidean distance to the reference. Evaluation levels consisted of combinations of data type (abundance/P–A), and taxonomic rank (genus/species). Since individual metrics were on a different scale than Euclidean distance to the reference, two different colour scales were applied. The reference in the middle row of the heatmaps represents expected metrics, and the closer metagenomics or total RNA-Seq metrics were to the reference, the more accurate they were. Abundance-based metrics underwent multiplicative replacement followed by clr-transformation. p-values are based on two-sided paired t-tests between metagenomics- and total RNA-Seq-based Euclidean distances to the reference. All replicates showed variations across all evaluation levels; however, total RNA-Seq-based workflows were significantly more similar to the reference than metagenomics-based workflows (P < 0.05) for all evaluation levels. For P–A-based evaluations, absolute differences among metrics and replicates were small (left). Metagenomics- and total RNA-Seq-based replicates failed to detect the 5 or 6 taxa with the lowest abundance (right).
Figure 5.
Figure 5.
Relationship between sequencing depth and accuracy for multiple evaluation levels. Evaluation levels consisted of combinations of data type (abundance/P–A), and taxonomic rank (genus/species). Blue and red lines indicate the mean Euclidean distance of all metagenomics and total RNA-Seq replicates, which have each been subsampled ten times, and the area around the lines indicates the standard deviation (SD). Lower Euclidean distances are a proxy for higher accuracy. The y-axis is inverted, and its scale varies among graphs. The SD equals zero at the highest number of reads since all available reads were used and, therefore, no subsamples could be generated. Individual replicates are shown as grey lines. Regression curves are shown as dashed black lines for the portion of the data that was comparable between metagenomics and total RNA-Seq. pseq-values are based on partial F-tests between linear models including or excluding the sequencing method (metagenomics/total RNA-Seq) as a binary independent variable. pcoef-values are based on two-sided paired t-tests between the coefficients of regression curves of individual metagenomics and total RNA-Seq replicates based on the comparable portion of the data.

References

    1. IPBES Services Díaz S., Settele J., Brondízio E.S., Ngo H.T., Guèze M., Agard J., Razzaque J., Arneth A., Balvanera P., Brauman K.A.et al... Summary for Policymakers of the Global Assessment Report on Biodiversity and Ecosystem Services of the Intergovernmental Science-Policy Platform on Biodiversity and Ecosystem. 2019; Bonn, Germany.
    1. WWF Almond R.E.A., Grooten M., Petersen T.. Living Planet Report 2020 - Bending the Curve of Biodiversity Loss. 2020; Gland, Switzerland.
    1. Pettorelli N., Graham N.A.J., Seddon N., Maria da Cunha Bustamante M., Lowton M.J., Sutherland W.J., Koldewey H.J., Prentice H.C., Barlow J.. Time to integrate global climate change and biodiversity science-policy agendas. J. Appl. Ecol. 2021; 58:2384–2393.
    1. Kubiszewski I., Costanza R., Anderson S., Sutton P.. The future value of ecosystem services: global scenarios and national implications. Ecosyst. Serv. 2017; 26:289–301.
    1. Burger J. Bioindicators: a review of their use in the environmental literature 1970–2005. Environ. Bioindic. 2006; 1:136–144.

Publication types

MeSH terms

Substances