. 2022 Oct 26;10(5):e0237922.
doi: 10.1128/spectrum.02379-22. Epub 2022 Aug 18.

Monitoring SARS-CoV-2 Infection Using a Double Reporter-Expressing Virus

Affiliations

Monitoring SARS-CoV-2 Infection Using a Double Reporter-Expressing Virus

Kevin Chiem et al. Microbiol Spectr. .

Abstract

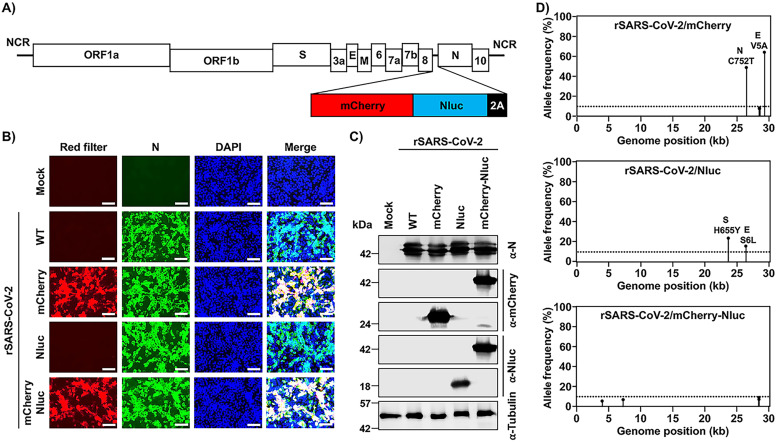
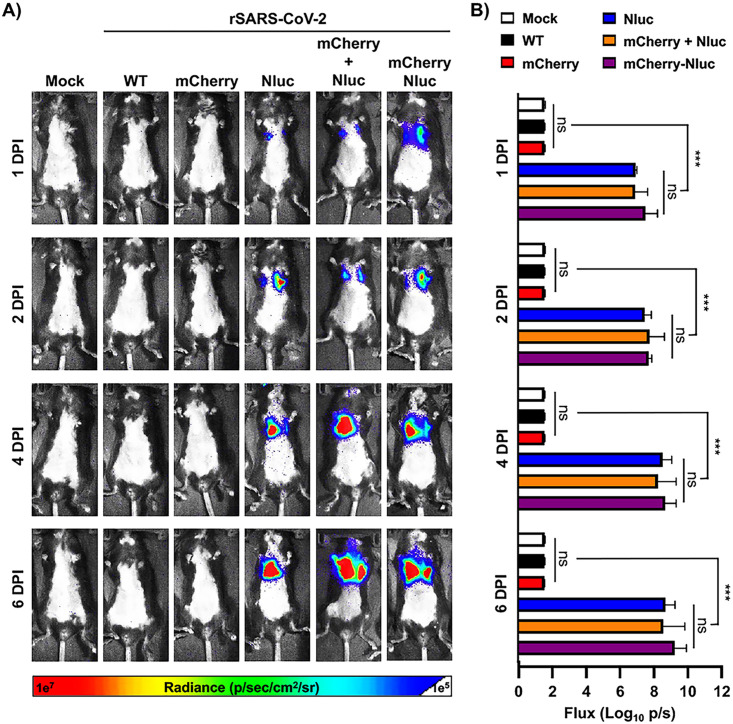
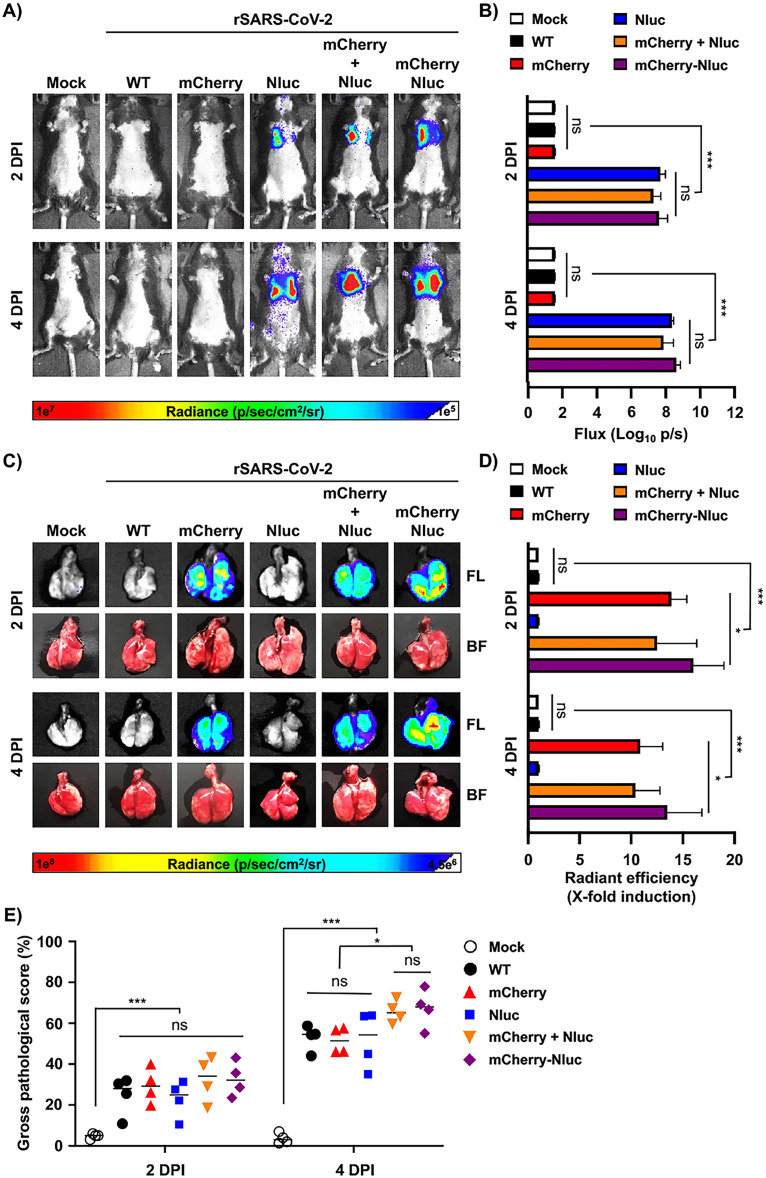
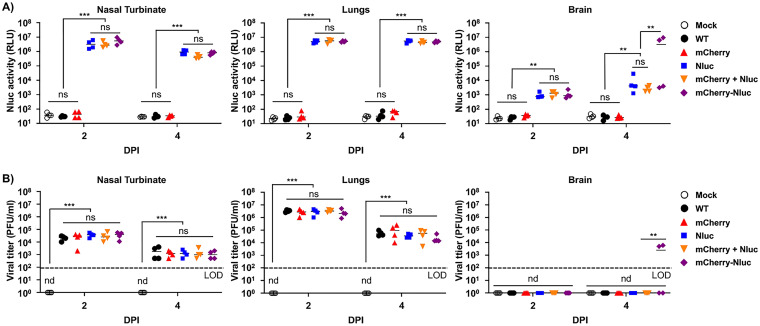
Severe acute respiratory syndrome coronavirus 2 (SARS-CoV-2) is the highly contagious agent responsible for the coronavirus disease 2019 (COVID-19) pandemic. An essential requirement for understanding SARS-CoV-2 biology and the impact of antiviral therapeutics is a robust method to detect the presence of the virus in infected cells or animal models. Despite the development and successful generation of recombinant (r)SARS-CoV-2-expressing fluorescent or luciferase reporter genes, knowledge acquired from their use in in vitro assays and/or in live animals is limited to the properties of the fluorescent or luciferase reporter genes. Herein, for the first time, we engineered a replication-competent rSARS-CoV-2 that expresses both fluorescent (mCherry) and luciferase (Nluc) reporter genes (rSARS-CoV-2/mCherry-Nluc) to overcome limitations associated with the use of a single reporter gene. In cultured cells, rSARS-CoV-2/mCherry-Nluc displayed similar viral fitness as rSARS-CoV-2 expressing single reporter fluorescent and luciferase genes (rSARS-CoV-2/mCherry and rSARS-CoV-2/Nluc, respectively) or wild-type (WT) rSARS-CoV-2, while maintaining comparable expression levels of both reporter genes. In vivo, rSARS-CoV-2/mCherry-Nluc has similar pathogenicity in K18 human angiotensin-converting enzyme 2 (hACE2) transgenic mice than rSARS-CoV-2 expressing individual reporter genes or WT rSARS-CoV-2. Importantly, rSARS-CoV-2/mCherry-Nluc facilitates the assessment of viral infection and transmission in golden Syrian hamsters using in vivo imaging systems (IVIS). Altogether, this study demonstrates the feasibility of using this novel bioreporter-expressing rSARS-CoV-2 for the study of SARS-CoV-2 in vitro and in vivo. IMPORTANCE Despite the availability of vaccines and antivirals, the coronavirus disease 2019 (COVID-19) pandemic caused by severe acute respiratory syndrome coronavirus 2 (SARS-CoV-2) continues to ravage health care institutions worldwide. Previously, we generated replication-competent recombinant (r)SARS-CoV-2 expressing fluorescent or luciferase reporter proteins to track viral infection in vitro and/or in vivo. However, these rSARS-CoV-2 are restricted to express only a single fluorescent or a luciferase reporter gene, limiting or preventing their use in specific in vitro assays and/or in vivo studies. To overcome this limitation, we have engineered a rSARS-CoV-2 expressing both fluorescent (mCherry) and luciferase (Nluc) genes and demonstrated its feasibility to study the biology of SARS-CoV-2 in vitro and/or in vivo, including the identification and characterization of neutralizing antibodies and/or antivirals. Using rodent models, we visualized SARS-CoV-2 infection and transmission through in vivo imaging systems (IVIS).

Keywords: SARS-CoV-2; coronavirus; fluorescent; infection; luciferase; recombinant; reporter; transmission.


Conflict of interest statement

The authors declare a conflict of interest. C.Y. and L.M.-S. are co-inventors on a patent that includes claims related to reverse genetics approaches to generate recombinant SARS-CoV-2.

Figures

FIG 1
FIG 1
Generation of a bireporter rSARS-CoV-2 expressing mCherry and Nluc (rSARS-CoV-2/mCherry-Nluc). (A) Schematic representation of the rSARS-CoV-2/mCherry-Nluc viral genome: SARS-CoV-2 structural, nonstructural, and accessory open reading frame (ORF) proteins are indicated in white boxes. mCherry (red), Nluc (blue), and the PTV-1 2A autoproteolytic sequence (black) were inserted in front of the viral N protein. NCR, noncoding region. (B) mCherry expression and immunofluorescence assays: Vero E6 cells (1.2 × 106 cells/well, 6-well format, triplicates) were mock infected or infected (MOI, 0.01) with rSARS-CoV-2 WT, rSARS-CoV-2/mCherry, rSARS-CoV-2/Nluc, or rSARS-CoV-2/mCherry-Nluc. Cells were fixed in 10% neutral buffered formalin 24 hpi before directly visualizing mCherry expression under a fluorescence microscope or the viral N protein using a specific 1C7C7 MAb. Cell nuclei were strained with DAPI. Representative images are shown. Scale bars = 100 μm. Magnification = ×20. (C) Western blots: Vero E6 cells (1.2 × 106 cells/well, 6-well format, triplicates) were mock infected or infected (MOI, 0.01) with rSARS-CoV-2 WT, rSARS-CoV-2/mCherry, rSARS-CoV-2/Nluc, or rSARS-CoV-2/mCherry-Nluc. At 24 hpi, cells were collected and protein expression in cell lysates were evaluated by Western blotting using specific antibodies against SARS-CoV-2 N protein or the mCherry and Nluc reporter proteins. Tubulin was included as a loading control. The molecular mass of proteins is indicated in kilodaltons (kDa) on the left. (D) Deep sequencing analysis of reporter-expressing rSARS-CoV-2: the nonreference allele frequency of rSARS-CoV-2/mCherry (top), rSARS-CoV-2/Nluc (middle), and rSARS-CoV-2/mCherry-Nluc (bottom) was calculated by comparing the short reads to the respective reference SARS-CoV-2 WA-1 viral genome (MN985325.1). Nonreference alleles present in less than 10% of reads are not shown (dotted line), and the nonreference allele frequency that is greater than 10% is indicated.
FIG 2
FIG 2
In vitro characterization of the bireporter rSARS-CoV-2/mCherry-Nluc virus. (A) Viral growth kinetics: viral titers (PFU/ml) in the cell culture supernatants of Vero E6 cells (1.2 × 106 cells/well, 6-well format, triplicates) infected (MOI, 0.01) with rSARS-CoV-2 WT (WT), rSARS-CoV-2/mCherry (mCherry), rSARS-CoV-2/Nluc (Nluc), or rSARS-CoV-2/mCherry-Nluc (mCherry-Nluc) at the indicated time points postinfection were determined by plaque assay. Data represent the mean values and SD of triplicates. LOD, limit of detection. (B) Nluc activity: Nluc activity in the cell culture supernatants obtained from the experiment in panel A is represented in relative light units (RLU). (C) mCherry expression kinetics: Vero E6 cells (1.2 × 106 cells/well, 6-well format, triplicates) were infected (MOI, 0.01) with rSARS-CoV-2 WT, rSARS-CoV-2/mCherry, rSARS-CoV-2/Nluc, or rSARS-CoV-2/mCherry-Nluc and mCherry expression was directly visualized under a fluorescence microscope at the indicated times postinfection. Representative images are shown. Scale bars = 300 μm. Magnification = ×10. (D) Plaque phenotype: viral plaques from Vero E6 cells (2 × 105 cells/well, 24-well plate format, triplicates) infected with rSARS-CoV-2 WT, rSARS-CoV-2/mCherry, rSARS-CoV-2/Nluc, or rSARS-CoV-2/mCherry-Nluc at 3 dpi were observed under a fluorescence imaging system (first column, red filter), fluorescently stained with an antibody against Nluc (second column, FITC), or immunostaining with an antibody against the viral N protein (third column, N). White arrowheads depict the overlapping signal of mCherry fluorescence (left), Nluc bioluminescence (middle), and immunostaining of the viral N protein (right) in Vero E6 cells infected with rSARS-CoV-2/mCherry, rSARS-CoV-2/Nluc, or rSARS-CoV-2/mCherry-Nluc. *, P < 0.05; **, P < 0.01; ns, not significant.
FIG 3
FIG 3
Bireporter-based microneutralization assay to identify NAbs and antivirals against SARS-CoV-2. (A) A bireporter microneutralization assay to identify NAbs: three-fold serial dilutions of the SARS-CoV-2 1212C2 hMAb (starting concentration of 500 ng) were prepared in postinfection media and incubated with 100–200 PFU/well of rSARS-CoV-2 WT (WT), rSARS-CoV-2/mCherry (mCherry), rSARS-CoV-2/Nluc (Nluc), or rSARS-CoV-2/mCherry-Nluc (mCherry-Nluc) for 1 h at RT. Vero E6 cells (96-well plate format, 4 × 104 cells/well, quadruplicates) were infected and incubated with the virus-antibody mixture at 37°C for 24 h. Viral neutralization was determined by immunostaining using an anti-N protein MAb (1C7C7) for rSARS-CoV-2/WT (left) or by fluorescence expression for rSARS-CoV-2/mCherry and rSARS-CoV-2/mCherry-Nluc (middle), or bioluminescence for rSARS-CoV-2/Nluc and rSARS-CoV-2/mCherry-Nluc (right) using a microplate reader. The 50% neutralization titer (NT50) was calculated using sigmoidal dose-response curves on GraphPad Prism. Viral neutralization was normalized to wells containing infected cells without the 1212C2 hMAb. The dotted line indicates 50% virus inhibition. Data are represented by the mean values and SD of quadruplicates. (B) A bireporter microneutralization assay to assess antivirals: vero E6 cells (96-well plate format, 4 × 104 cells/well, quadruplicates) were infected with 100 to 200 PFU of rSARS-CoV-2/WT, or reporter viruses expressing mCherry, Nluc, or mCherry-Nluc. After 1 h viral absorption, cells were incubated in postinfection media containing 3-fold serial dilutions of remdesivir (starting concentration of 100 μM). Viral inhibition was determined by immunostaining using an anti-N protein MAb (1C7C7) for rSARS-CoV-2/WT (left) or by fluorescence expression for rSARS-CoV-2/mCherry and rSARS-CoV-2/mCherry-Nluc (middle), or bioluminescence for rSARS-CoV-2/Nluc and rSARS-CoV-2/mCherry-Nluc (right) using a microplate reader. The 50% effective concentration (EC50) was calculated using sigmoidal dose-response curves on GraphPad Prism. Viral inhibition was normalized to wells containing infected cells without remdesivir. The dotted line indicates the 50% virus inhibition. The data are represented by the mean values and SD of quadruplicates.
FIG 4
FIG 4
Virulence of rSARS-CoV-2/mCherry-Nluc in K18 hACE2 transgenic mice: 4- to 6-week-old female K18 hACE2 transgenic mice (n = 4) were mock infected or intranasally inoculated with 105 PFU/mouse of rSARS-CoV-2 WT (WT), rSARS-CoV-2/mCherry (mCherry), rSARS-CoV-2/Nluc (Nluc), or the bireporter rSARS-CoV-2/mCherry-Nluc (mCherry-Nluc). A group of 4- to 6-week-old female K18 hACE2 transgenic mice (n = 4) were also coinfected with rSARS-CoV-2/mCherry and rSARS-CoV-2/Nluc (mCherry + Nluc). Body weight loss (A) and survival (B) of mice were monitored for 12 days after viral infection.
FIG 5
FIG 5
In vivo kinetics of rSARS-CoV-2/mCherry-Nluc in K18 hACE2 transgenic mice: 4- to 6-week-old female K18 hACE2 transgenic mice (n = 4) were mock infected or infected intranasally with 105 PFU/mouse of rSARS-CoV-2 WT, rSARS-CoV-2/mCherry, rSARS-CoV-2/Nluc, rSARS-CoV-2/mCherry + rSARS-CoV-2/Nluc, or with rSARS-CoV-2/mCherry-Nluc (mCherry-Nluc). Nluc activity in the whole mouse at the indicated dpi was evaluated with an Ami HT in vivo imaging system. Representative images of the same mouse at 1, 2, 4, and 6 dpi are shown (A). Means and SD of the radiance (number of photons per second per square centimeter per steradian [p/second/cm2/sr]) and bioluminescence (total flux [log10 photons per second (p/s)]) over each mouse are shown (B). ***, P < 0.001; ns, not significant.
FIG 6
FIG 6
In vivo bioluminescence and ex vivo fluorescence in K18 hACE2 transgenic mice infected with rSARS-CoV-2/mCherry-Nluc. (A) In vivo Nluc expression: Nluc activity in live mice (n = 4) mock infected or infected (105 PFU/mouse) with rSARS-CoV-2 WT, rSARS-CoV-2/mCherry, rSARS-CoV-2/Nluc, rSARS-CoV-2/mCherry + rSARS-CoV-2/Nluc, or the bireporter rSARS-CoV-2/mCherry-Nluc (mCherry-Nluc) were determined on 2 and 4 dpi using the Ami HT IVIS. A representative image of a mouse per time point is shown. (B) Quantification of Nluc signal: means and SD of the radiance (number of photons per second per square centimeter per steradian [p/second/cm2/sr]) and bioluminescence (total flux [log10 photons per second (p/s)]) of mock and infected mice is shown. (C) Ex vivo mCherry expression: excised lungs from mock-infected or infected mice from panel A were monitored for mCherry fluorescent expression (FL, top) and bright field (BF, bottom) at 2 and 4 dpi. Representative lung images from the same mouse used in panel A are shown. (D) Quantification of mCherry expression: the mean values of mCherry signal around the regions of interest were normalized to the autofluorescence of mock-infected lungs at each time point and the fold changes in fluorescence were calculated. (E) Gross pathology score: pathology lesions, consolidation, congestion, and atelectasis, of excised lungs were measured using NIH ImageJ and are represented as percentages of total lung surface area affected. *, P < 0.05; ***, P < 0.001; ns, not significant.
FIG 7
FIG 7
Nluc activity and viral titers in tissue homogenates from infected K18 hACE2 transgenic mice: the nasal turbinate (left), lungs (middle), and brain (right) of four-to-6-weeks-old female K18 hACE2 transgenic mice (n = 4) mock infected or infected intranasally with 105 PFU/mouse of rSARS-CoV-2 WT, rSARS-CoV-2/mCherry, rSARS-CoV-2/Nluc, rSARS-CoV-2/mCherry + rSARS-CoV-2/Nluc, or the bireporter rSARS-CoV-2/mCherry-Nluc were collected after imaging on an Ami HT IVIS on 2 and 4 dpi. After homogenization, Nluc activity (A) and viral titers (B) in tissue homogenates were determined on a microplate reader or by plaque assay, respectively. The results are the mean values and SD. LOD, limit of detection. **, P < 0.01; ***, P < 0.001; ns, not significant; nd, not detected.
FIG 8
FIG 8
In vivo bioluminescence and ex vivo fluorescence in golden Syrian hamsters infected with rSARS-CoV-2/mCherry-Nluc. (A) In vivo Nluc expression: Nluc activity in 4- to 6-week-old female golden Syrian hamsters (n = 4) mock infected or infected with 105 PFU/hamster of rSARS-CoV-2/mCherry-Nluc were determined on 2, 4, and 6 dpi using the Ami HT IVIS. Contact animals were exposed to infected animals 1 dpi. A representative image of a hamster per time points and experimental condition is shown. (B) Quantification of Nluc signal: means and SD of the radiance (number of photons per second per square centimeter per steradian [p/second/cm2/sr]) and bioluminescence (total flux [log10 photons per second (p/s)]) were quantified from whole hamsters after IVIS imaging. (C) Ex vivo mCherry and Nluc expression: excised lungs from mock-infected or infected golden Syrian hamsters from panel A were monitored for mCherry fluorescence (FL, top), Nluc signal (Nluc, middle), and bright field (BF, bottom) at 2, 4, and 6 dpi. Representative lung images from the same hamster used in panel A are shown. (D) Quantification of mCherry expression: the mean values of mCherry signal around the regions of interest were normalized to the autofluorescence of mock-infected lungs at each time point and the fold changes in fluorescence were calculated. (E) Gross pathology score: pathological lesions, consolidation, congestion, and atelectasis, of excised lungs were measured using NIH ImageJ and are represented as percentages of total lung surface area affected. *, P < 0.05; ***, P < 0.001; ns, not significant.
FIG 9
FIG 9
Nluc activity and viral titers in golden Syrian hamster tissue homogenates infected with rSARS-CoV-2/mCherry-Nluc: the nasal turbinate (left) and lungs (right) of 4- to 6-week-old female golden Syrian hamsters (n = 4) mock infected or infected intranasally with 105 PFU/hamster of rSARS-CoV-2/mCherry-Nluc were collected after imaging on an Ami HT IVIS at 2 and 4 dpi. In addition, after 24 hpi, contact golden Syrian hamsters (n = 4, contact) were added to the cages of infected animals. After homogenization, Nluc activity (A) and viral titers (B) in tissue homogenates were determined on a microplate reader or by plaque assay, respectively. Results are the means and SD. LOD, limit of detection. *, P < 0.05; ***, P < 0.001; ns, not significant; nd, not detected.

Similar articles

Cited by

References

    1. Zhu N, Zhang D, Wang W, Li X, Yang B, Song J, Zhao X, Huang B, Shi W, Lu R, Niu P, Zhan F, Ma X, Wang D, Xu W, Wu G, Gao GF, Tan W, China Novel Coronavirus Investigating and Research Team . 2020. A novel coronavirus from patients with pneumonia in China, 2019. N Engl J Med 382:727–733. doi:10.1056/NEJMoa2001017. - DOI - PMC - PubMed
    1. Dong E, Du H, Gardner L. 2020. An interactive web-based dashboard to track COVID-19 in real time. Lancet Infect Dis 20:533–534. doi:10.1016/S1473-3099(20)30120-1. - DOI - PMC - PubMed
    1. Mizumoto K, Kagaya K, Zarebski A, Chowell G. 2020. Estimating the asymptomatic proportion of coronavirus disease 2019 (COVID-19) cases on board the Diamond Princess cruise ship, Yokohama, Japan, 2020. Euro Surveill 25:2000180. doi:10.2807/1560-7917.es.2020.25.10.2000180. - DOI - PMC - PubMed
    1. Gudbjartsson DF, Helgason A, Jonsson H, Magnusson OT, Melsted P, Norddahl GL, Saemundsdottir J, Sigurdsson A, Sulem P, Agustsdottir AB, Eiriksdottir B, Fridriksdottir R, Gardarsdottir EE, Georgsson G, Gretarsdottir OS, Gudmundsson KR, Gunnarsdottir TR, Gylfason A, Holm H, Jensson BO, Jonasdottir A, Jonsson F, Josefsdottir KS, Kristjansson T, Magnusdottir DN, le Roux L, Sigmundsdottir G, Sveinbjornsson G, Sveinsdottir KE, Sveinsdottir M, Thorarensen EA, Thorbjornsson B, Löve A, Masson G, Jonsdottir I, Möller AD, Gudnason T, Kristinsson KG, Thorsteinsdottir U, Stefansson K. 2020. Spread of SARS-CoV-2 in the Icelandic population. N Engl J Med 382:2302–2315. doi:10.1056/NEJMoa2006100. - DOI - PMC - PubMed
    1. Zaki AM, van Boheemen S, Bestebroer TM, Osterhaus AD, Fouchier RA. 2012. Isolation of a novel coronavirus from a man with pneumonia in Saudi Arabia. N Engl J Med 367:1814–1820. doi:10.1056/NEJMoa1211721. - DOI - PubMed

Publication types