. 2022 Oct 3;219(10):e20211574.
doi: 10.1084/jem.20211574. Epub 2022 Aug 18.

TGF-β regulates the stem-like state of PD-1+ TCF-1+ virus-specific CD8 T cells during chronic infection

Affiliations

TGF-β regulates the stem-like state of PD-1+ TCF-1+ virus-specific CD8 T cells during chronic infection

Yinghong Hu et al. J Exp Med. .

Abstract

Recent studies have defined a novel population of PD-1+ TCF-1+ stem-like CD8 T cells in chronic infections and cancer. These quiescent cells reside in lymphoid tissues, are critical for maintaining the CD8 T cell response under conditions of persistent antigen, and provide the proliferative burst after PD-1 blockade. Here we examined the role of TGF-β in regulating the differentiation of virus-specific CD8 T cells during chronic LCMV infection of mice. We found that TGF-β signaling was not essential for the generation of the stem-like CD8 T cells but was critical for maintaining the stem-like state and quiescence of these cells. TGF-β regulated the unique transcriptional program of the stem-like subset, including upregulation of inhibitory receptors specifically expressed on these cells. TGF-β also promoted the terminal differentiation of exhausted CD8 T cells by suppressing the effector-associated program. Together, the absence of TGF-β signaling resulted in significantly increased accumulation of effector-like CD8 T cells. These findings have implications for immunotherapies in general and especially for T cell therapy against chronic infections and cancer.


Conflict of interest statement

Disclosures: Y. Hu reported a patent for inhibitory molecules specifically expressed by a subset of stem-like CD8 T cells for therapeutic intervention pending. C. Medina reported a patent for inhibitory molecules specifically expressed by a subset of stem-like CD8 T cells for therapeutic intervention pending. S.J. Turley is an employee of Genentech/Roche. R. Ahmed reported a patent for monoclonal antibodies directed against PD-1 issued and a patent for inhibitory molecules specifically expressed by a subset of stem-like CD8 T cells for therapeutic intervention pending. No other disclosures were reported.

Figures
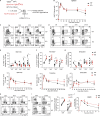
Figure 1.
Figure 1.
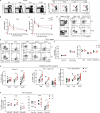
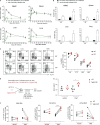
TGF-β regulates the differentiation of different subsets of antigen-specific CD8 T cells during chronic LCMV infection. (A) Congenically marked WT and TGF-βRII–deficient (KO) LCMV GP33-specific P14 CD8 T cells were cotransferred into naive mice treated with anti-CD4 depleting antibody GK1.5, followed by LCMV clone 13 infection. (B) Longitudinal analysis of the numbers of WT and KO P14 cells in the spleen. Graph shows the mean and SEM. Paired Student’s t test; *, P < 0.05. (C) Representative FACS plots show the expression of Tim3 and TCF-1 by WT and KO P14 cells in the spleen at indicated time points. (D) Representative FACS plots show the expression of Tim3 and CD101 by WT and KO P14 cells in the spleen at indicated time points. (E–G) Frequencies and numbers of TCF-1+ Tim3 stem-like subset (E), Tim3+ CD101 transitory subset (F), and Tim3+ CD101+ exhausted subset (G) among WT and KO P14 cells in the spleen. Paired Student’s t test; *, P < 0.05; **, P < 0.01. (H) Representative FACS plots show the expression of Ki67 and TCF-1 by WT and KO P14 cells in the spleen. (I) Representative FACS plots show the expression of CX3CR1 and CXCR5 by WT and KO P14 cells in the spleen (left). Graph shows frequencies of of CX3CR1+ CXCR5 transitory cells among WT and KO P14 cells at indicated time points (right). Paired Student’s t test; **, P < 0.01; ***, P < 0.001. (J) Longitudinal analysis of the numbers of WT and KO P14 cells in the peripheral blood. Graph shows the mean and SEM. Paired Student’s t test; *, P < 0.05; **, P < 0.01. PBMC, peripheral blood mononuclear cells. Data in B–J are representative of three independent experiments (n = 4–5 each time point per experiment).
Figure S1.
Figure S1.
TGF-β regulates CD8 T cell differentiation during chronic infection. Congenically marked WT and Tgfbr2−/− (KO) LCMV GP33-specific P14 CD8 T cells were cotransferred into naive mice treated with anti-CD4 depleting antibody GK1.5, followed by LCMV Cl13 infection. (A) Representative FACS plots show frequencies of CD45.1+ donor cells in the spleen after Cl13 infection, gated on lymphocytes (left), and the ratio of WT and KO P14 cells in the spleen, gated on donor P14 cells (right). (B and C) Longitudinal analysis of the numbers of WT and KO P14 cells in liver (B) and lungs (C). Graph shows the mean and SEM. Paired Student’s t test; *, P < 0.05. (D) Representative FACS plots show the expression of PD-1 on WT and KO P14 cells in the spleen at indicated time points. (E) Phenotype of WT and KO P14 cells in the spleen on D5 p.i. (F) Graphs showed the frequencies and numbers of subsets of WT and KO P14 cells on D5 p.i. Data in A–F are representative of three independent experiments (n = 4–6 each time point per experiment). (G) Pool results from two independent experiments (n = 4–5 mice per time point per experiment) showing frequencies of Ki67-expressing cells among total WT and KO P14 cells (left), among TCF-1+ Tim3 stem-like WT and KO P14 cells (middle), and among Tim3+ TCF-1 differentiated WT and KO P14 cells (right) at indicated time points. Paired Student’s t test; **, P < 0.01; ***, P<0.001. (H) Production of IFN-γ by subsets of WT and KO P14 cells harvested from spleen on D15 and D30 after in vitro stimulation with GP33 peptide. Paired Student’s t test; *, P < 0.05. Data are representative of two independent experiments (n = 4–6 per time point per experiment).
Figure 2.
Figure 2.
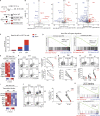
TGF-βRII deletion results in enhanced transcription of effector-associated genes in more differentiated antigen-specific CD8 T cells. (A) Tim3+ CXCR5 differentiated cells were sorted from transferred KO and WT P14 cells in the spleen on D15 and D30 p.i. for RNA-seq. (B) Heatmap showing the relative expression (z-scores derived from expression values) of selected genes in Tim3+ KO vs. WT P14 cells on D15 p.i. (C) Volcano plots show log2 (fold-change) vs. −log10 (adjusted P value) of selected genes upregulated or downregulated in Tim3+ KO P14 cells compared with Tim3+ WT P14 cells on D30 p.i. The dotted lines indicates log2 (fold-change) = 0.6 or −0.6, and adjusted P = 0.05. (D) Heatmap showing the relative expression (z-scores derived from expression values) of selected genes in Tim3+ KO vs. WT P14 cells on D30 p.i. (E and F) Confirmation of increased expression of IL18Rα (E), and decreased expression of CD200R (F) on Tim3+ KO P14 cells by FACS. Paired Student’s t test; *, P < 0.05; **, P < 0.01. (G) GSEA for enrichments of gene signatures of indicated cell types in D15 and D30 Tim3+ KO vs. WT P14 cells were visualized by NES and −log10 (FDR q value). RNA-seq datasets were generated from two to three biological replicates for each group at each time point.
Figure 3.
Figure 3.
TGF-β signaling regulates the transcriptional signature of stem-like subset during chronic infection. (A) CXCR5+ Tim3 stem-like cells were sorted on D8, D15, and D30 p.i. from transferred WT and KO P14 cells in the spleen for RNA-seq. (B) Volcano plots show log2 (fold-change) vs. −log10 (adjusted P value) of genes upregulated or downregulated in stem-like KO P14 cells compared with stem-like WT P14 cells at indicated time points. The dotted line indicates log2(fold-change) = 0.6 or −0.6, and adjusted P = 0.05. (C) Numbers of differentially expressed genes between stem-like KO vs. WT P14 cells at indicated time points (log2[fold-change] >0.6 or <−0.6, adjusted P < 0.05). (D) GSEA compared genes uniquely upregulated in stem-like subset with the transcriptional profiles of stem-like KO vs. WT P14 cells on D15 and D30 p.i. (E) Heatmap showing the relative expression (z-scores derived from expression values) of selected inhibitory molecules in stem-like KO vs. WT P14 cells on D30 p.i. (F) Representative FACS plots confirm reduced expression of CD73 and CD200 on stem-like KO P14 cells compared with stem-like WT P14 cells in the spleen on D30 p.i. (left). Frequencies of CD73+ CXCR5+ cells and CD200+ CXCR5+ cells among WT and KO P14 cells on D30 p.i. (right). Paired Student’s t test; *, P < 0.05; **, P < 0.01. (G) Representative FACS plots confirm reduced expression of NRP1 on stem-like KO P14 cells compared with stem-like WT P14 cells in the spleen on D40 p.i. (upper). Frequencies of NRP1+ TCF-1+ cells among WT and KO P14 cells on D40 p.i. (lower). Paired Student’s t test; ***, P < 0.001. (H) Representative FACS plots confirm reduced expression of P2RX7 on stem-like KO P14 cells compared with stem-like WT P14 cells in the spleen on D50 p.i. (upper). Frequencies of P2RX7+ CXCR5+ cells among WT and KO P14 cells at indicated time points (lower). Paired Student’s t test; **, P < 0.01; ****, P < 0.0001. Data in F–H are representative of two independent experiments with four to seven mice per time point per experiment. (I) Heatmap showing the relative expression (z-scores derived from expression values) of selected transcription factors in stem-like KO vs. WT P14 cells on D30 p.i. (J) Representative FACS plots show EGR2 expression on TCF-1+ WT and KO P14 cells in the spleen on D40 and D135 p.i. (left). Frequencies of EGR2+ TCF-1+ cells among WT and KO P14 cells at indicated time points (right). Paired Student’s t test; ***, P < 0.001. (K) GSEA showed that NFAT target genes in exhausted CD8 T cells were negatively enriched in stem-like KO P14 cells on D15 and D30 p.i. RNA-seq datasets were generated from two to three biological replicates for each group.
Figure 4.
Figure 4.
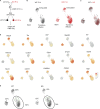
scRNA-seq of WT and TGF-βRII–deficient P14 cells from chronically infected mice. (A) Congenically marked WT and TGF-βRII–deficient (KO) P14 CD8 T cells were cotransferred into naive mice treated with anti-CD4 depleting antibody GK1.5, followed by LCMV clone 13 infection. WT and KO P14 cells were sorted from spleen on D30 p.i. for scRNA-seq. (B) UMAP analyses identified three distinct clusters for both WT and KO P14 cells: stem-like, transitory, and exhausted. (C) An overlay of WT (black) and KO (red) UMAP analyses. (D) UMAP plots showing the expression of selected genes. (E) The frequencies of WT and KO P14 cells in the stem, transitory, and exhausted clusters, with two subclusters identified within the transitory cluster. The green dotted line circles the subcluster at possible pre-exhaustion state.
Figure S2.
Figure S2.
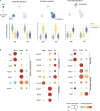
scRNA-seq of WT and TGF-βRII–deficient P14 cells from chronically infected mice. (A) VISION analyses of WT and KO P14 cells for enrichment of gene signatures associated with LCMV-specific stem-like, transitory, and exhausted CD8 T cells. UMAP plots identified the cells enriched for each gene signature shown in blue color. Violin plots showed the enrichment of each gene signature in the clusters of WT and KO P14 cells (stem, transitory, and exhausted). (B) Dot plots showing the relative expression levels and the percentages of cells in each cluster expressing the selected genes.
Figure S3.
Figure S3.
TGF-β suppresses the expansion and differentiation of antigen-specific CD8 T cells activated in an established chronic infection. (A) Reduced expansion of antigen-specific CD8 T cells activated in the immunosuppressive environment of an established chronic infection. Longitudinal analysis compared the numbers of WT P14 cells when 2 × 10³ P14 cells were transfer into naive mice followed by LCMV Clone 13 infection (black) vs. when 1 × 10⁴ P14 cells were into mice with established chronic LCMV infection (>day 45 p.i.; green). (B) KO/WT ratio when P14 cells were transferred in a 1:1 ratio into naive mice followed by LCMV Clone 13 infection or into mice with established chronic LCMV infection. Data in A and B are representative of three independent experiments (n = 4–5 each time point per experiment). (C) Expression of Ki67 and TCF-1 by WT and KO P14 cells in the spleen at indicated time points after transfer. Paired Student’s t test; *, P < 0.05. Data are representative of three independent experiments (n = 4–5 each time point per experiment). (D) Rosa26Cre-ERT2+ (ER-Cre+) TGF-βRIIfl/fl (Tgfbr2fl/fl) and ER-Cre+ TGF-βRII+/+(WT) P14 cells were cotransferred into mice chronically infected with LCMV clone 13. Recipient mice were treated with TAM or vehicle for 5 consecutive days (day 0–4 after transfer) to induce the deletion of TGF-βRII. Donor cells were harvested from spleen on D15 after transfer. (E) Numbers of ER-Cre+ WT and ER-Cre+ Tgfbr2fl/fl P14 cells in the spleen of mice treated with vehicle or TAM. Paired Student’s t test; *, P < 0.05. (F) Plots show frequencies of TCF-1+ Tim3 stem-like cells, Tim3+ CD101 transitory cells, and Tim3+ CD101+ exhausted cells among ER-Cre+ WT and ER-Cre+ Tgfbr2fl/fl P14 cells in the spleen. Paired Student’s t test; ***, P < 0.001. Data in E and F are representative of two independent experiments (n = 4–6 each time point per experiment).
Figure 5.
Figure 5.
TGF-β signaling is continuously needed to inhibit differentiation of antigen-specific CD8 T cells during chronic LCMV infection. (A) Rosa26Cre-ERT2+ TGF-βRIIfl/fl (Tgfbr2fl/fl) and Rosa26Cre-ERT2+ TGF-βRII+/+ (WT) P14 cells were cotransferred into naive B6 mice with CD4 T cell depletion and were then infected with LCMV clone 13. Recipient mice were treated with TAM or vehicle for 5 consecutive days (D31–D35 p.i.) to induce the deletion of TGF-βRII. Donor cells were harvested from spleen 3 wk after TAM treatment. (B and C) Donor cells were harvested from spleen on D60 p.i. Representative FACS plots show the expression of Tim3 and TCF-1 (B) or Ki67 and TCF-1 (C) by Tgfbr2fl/fl and WT P14 cells from mice treated with vehicle or TAM. (D–G) Plots show frequencies of TCF-1+ Tim3 (D), Ki67+ (E), Tim3+ CD101 (F), and CX3CR1+ TCF-1 (G) cells among WT and Tgfbr2fl/fl P14 cells in the spleen. In D–G, paired Student’s t test; *, P < 0.05. **, P < 0.01. Data in B–G are representative of two independent experiments (n = 5–6 each time point per experiment).
Figure 6.
Figure 6.
TGF-β suppresses the differentiation of antigen-specific CD8 T cells activated in an established chronic infection. (A) Congenically marked WT and KO P14 cells were cotransferred into mice chronically infected with LCMV clone 13 (D45–D60 p.i.). (B) Longitudinal analysis showed the numbers of WT and KO P14 cells in the peripheral blood. (C) Longitudinal analysis of the numbers of WT and KO P14 cells in the spleen, liver, and lungs. Graph shows the mean and SEM. In B and C, paired Student’s t test; *, P < 0.05; **, P < 0.01; ***, P < 0.001. (D) Representative FACS plots show the expression of Tim3 and TCF-1 by WT and KO P14 cells in the spleen at indicated time points after transfer. (E) Representative FACS plots show the expression of Tim3 and CD101 by WT and KO P14 cells in the spleen at indicated time points after transfer. (F–H) Frequencies and numbers of TCF-1+ Tim3 stem-like subset (F), Tim3+ CD101 transitory subset (G), and Tim3+ CD101+ exhausted subset (H) among WT and KO P14 cells in the spleen. Paired Student’s t test; *, P < 0.05; **, P < 0.01. Data in B–H are representative of three independent experiments (n = 4–5 each time point per experiment).
Figure S4.
Figure S4.
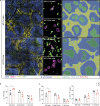
TGF-β regulates the anatomic location of antigen-specific CD8 T cells activated in chronically infected mice. (A) CD45.1 WT or KO P14 cells were transferred separately into chronically infected CD45.2 recipient mice (>D45 p.i.). Representative confocal microscopy images of WT and KO P14 cells in the spleen on D20 after transfer. (B) Histocytometry analysis showing the distribution of total WT and KO P14 cells in different compartments of the spleen. (C) Histocytometry analysis showing the distribution of TCF-1 (left) and TCF-1+ (right) WT and KO P14 cells in different compartments of the spleen. The experiment was done with three mice per group. Two regions of 1.25 × 1.25 mm were analyzed per spleen, and the plots show the average. Student’s t test; *, P < 0.05.
Figure 7.
Figure 7.
Transcriptional analysis of WT and TGF-β receptordeficient antigen-specific CD8 T cells activated in chronically infected mice. (A) Graph showing the experimental design of RNA-seq. (B) Volcano plots show log2(fold-change) vs. −log10 (adjusted P value) of selected genes upregulated or downregulated in KO P14 cells compared with WT P14 cells on D12 after transfer into mice with established chronic LCMV infection. The dotted lines indicate log2(fold-change) = 0.6 or −0.6, and adjusted P = 0.05. (C) GSEA shows biological pathways enriched in KO P14 cells activated in mice with established chronic LCMV infection. Plotted by NES. (D) Heatmap showing the relative expression of metabolism-related genes in KO vs. WT P14 cells. Heatmaps generated using z-scores derived from normalized counts. (E) Representative FACS plots showed phosphorylation of S6 ribosome protein ex vivo on D15 after transfer. (F) GSEA-compared gene signatures of IL-7Rlo effector cells on D8 after acute LCMV Armstrong infection for enrichment in the transcriptional profiles of KO vs. WT P14 cells. (G) Representative FACS plots showed KLRG-1 expression on WT and KO P14 cells on D15 after transfer. (H) IFN-γ and TNF production after in vitro stimulation by subsets of WT and KO P14 cells harvested from spleen on D15 after transfer. Graphs showing the frequencies of IFN-γ–producing and TNF- and IFN-γ–producing cells among different subsets of WT and KO P14 cells. Paired Student’s t test; *, P < 0.05; **, P < 0.01; ***, P < 0.001; ****, P < 0.0001. (I) A summary of GSEA enrichments of WT and KO P14 cells for gene signatures of indicated cell types. Visualized by NES and −log10 (FDR q value). Flow cytometry data in E, G, and H are representative of two independent experiments (n = 4–5 per experiment). RNA-seq datasets were generated from four biological replicates.
Figure S5.
Figure S5.
Selected genes altered by TGF-β receptor deletion in antigen-specific CD8 T cells activated during an established chronic infection. Heatmap showing the relative expression (z-scores derived from normalized expression values) of selected genes in KO vs. WT P14 cells harvested on D12 after transfer into chronically infected mice. RNA-seq datasets were generated from four biological replicates.
Figure 8.
Figure 8.
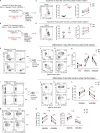
Adoptive transfer of stem-like and transitory subsets into chronically infected mice. (A and B) CD45.1 WT P14 cells or CD45.1.2 KO P14 cells were transferred into CD45.2 naive B6 mice with CD4 T cell depletion, followed by LCMV clone 13 infection. On D10 p.i., Slamf6+ Tim3 CX3CR1 stem-like cells and Tim3+ Slamf6 CD101 transitory cells were sorted from WT and KO P14 donor populations. Mice chronically infected with LCMV (>D45 p.i.) received cotransfer of stem-like WT and KO P14 cells (1:1, 2 × 10⁵ each; A) or transitory WT and KO P14 cells (1:1, 3.5 × 10⁵ each; B). The donor cells were examined on D9 after transfer. (C and D) Frequencies and numbers of WT and KO P14 cells in the spleen of mice receiving stem-like WT and KO P14 cells transfer (C) or receiving transitory WT and KO P14 cells transfer (D). Paired Student’s t test; ****, P < 0.0001. (E) FACS plots showing the expression of Tim3 and Slamf6 before and after sorting for stem-like cells on D10 p.i. (F) Representative FACS plots showing the expression of Tim3 and TCF-1 by WT and KO P14 cells at 9 d after transfer from the spleen of mice receiving the stem-like WT and KO P14 cells. Solid green arrow showing the differentiation trajectory from stem-like subset to Tim3+ differentiated cells. (G) Representative FACS plots showing the expression of Tim3 and CD101 by WT and KO P14 cells 9 d after transfer from the spleen of mice receiving the stem-like WT and KO P14 cells. Solid green arrow shows the differentiation trajectory from stem-like cells to transitory cells, and dashed green arrow shows that exhausted cells could emerge from the transitory population or from the stem-like cells. (H) Graph showing the frequencies of stem-like (TCF-1+ Tim3), transitory (Tim3+ CD101), and exhausted (Tim3+ CD101+) cells generated in the spleen from transferred stem-like WT and KO P14 cells. Paired Student’s t test; **, P < 0.01; ***, P < 0.001. (I) FACS plots showing the expression of Tim3 and CD101 before and after sorting for transitory cells on D10 p.i. (J and K) Representative FACS plots showing the expression of Tim3 and TCF-1 (J) or Tim3 and CD101 (K) by WT and KO P14 cells in the spleen of mice receiving the transitory WT and KO P14 cells transfer. Solid green arrow shows the differentiation trajectory from transitory cells to exhausted cells. (L) Graph showing the frequencies of transitory (Tim3+ CD101) and exhausted (Tim3+ CD101+) WT and KO P14 cells in the spleen of mice receiving the transitory cells transfer. Paired Student’s t test; **, P < 0.01; ***, P < 0.001. (M) Representative FACS plot showing the expression of Tim3 and CD101 by WT and KO P14 cells generated from transferred transitory WT and KO P14 cells in the liver and lungs. (N) Graph showing the frequencies of transitory (Tim3+ CD101) and exhausted (Tim3+ CD101+) cells among WT and KO P14 cells in the liver and lungs of mice receiving the transitory cells transfer. Paired Student’s t test; **, P < 0.01; ***, P < 0.001 and ****, P < 0.0001. Data in B–N are representative of two independent experiments with three mice per experiment. In C, D, H, L, and N, pooled results from two independent experiments (n = 6 total) are shown.
Figure 9.
Figure 9.
TGF-β signaling blockade enhances the generation of transitory cells during chronic infection. (A) Mice chronically infected with LCMV Cl13 (>D45 p.i.) were treated with 1 mg of either anti–TGF-β or isotype control antibodies every other day for 2 wk. (B) Numbers of GP33-specific and GP276-specific CD8 T cells in the spleen of chronically infected mice treated with isotype or anti–TGF-β antibodies. Student’s t test; *, P < 0.05; ***, P < 0.001. (C) Representative FACS plots of Ki67 and TCF-1 expression in splenic GP33-specific CD8 T cells. (D) Frequencies of Ki67+ cells among GP33-specific and GP276-specific CD8 T cells in the spleen. Student’s t test; **, P < 0.01; ***, P < 0.001. (E) Representative staining of Tim3 and CD101 on GP33-specific CD8 T cells in the spleen. (F) Frequencies of transitory Tim3+ CD101 subset among splenic GP33-specific and GP276-specific CD8 T cells. Student’s t test; **, P < 0.01. Graphs in B, D, and F show the mean and SEM and show pooled data of four independent experiments with five to six mice per experiment.
Figure 10.
Figure 10.
The role of TGF-β in CD8 T cell differentiation during chronic infection. (A) The frequencies of stem-like, transitory, and exhausted subsets among WT and KO P14 cells through LCMV clone 13 infection. (B) Model of how TGF-β regulates CD8 T cell differentiation during chronic infection. By inhibiting the effector-associated program, on one hand, TGF-β maintains the quiescence of stem-like subsets and inhibits their differentiation to transitory cells; on the other hand, TGF-β inhibits the proliferation of the transitory cells and promotes their terminal differentiation to exhausted cells.

References

    1. Alfei, F., Kanev K., Hofmann M., Wu M., Ghoneim H.E., Roelli P., Utzschneider D.T., von Hoesslin M., Cullen J.G., Fan Y., et al. . 2019. TOX reinforces the phenotype and longevity of exhausted T cells in chronic viral infection. Nature 571:265–269. 10.1038/s41586-019-1326-9 - DOI - PubMed
    1. Barber, D.L., Wherry E.J., Masopust D., Zhu B., Allison J.P., Sharpe A.H., Freeman G.J., and Ahmed R.. 2006. Restoring function in exhausted CD8 T cells during chronic viral infection. Nature. 439:682–687. 10.1038/nature04444 - DOI - PubMed
    1. Batlle, E., and Massagué J.. 2019. Transforming growth factor-β signaling in immunity and cancer. Immunity. 50:924–940. 10.1016/j.immuni.2019.03.024 - DOI - PMC - PubMed
    1. Boettler, T., Cheng Y., Ehrhardt K., and von Herrath M.. 2012. TGF-β blockade does not improve control of an established persistent viral infection. Viral Immunol. 25:232–238. 10.1089/vim.2011.0079 - DOI - PMC - PubMed
    1. Borges da Silva, H., Beura L.K., Wang H., Hanse E.A., Gore R., Scott M.C., Walsh D.A., Block K.E., Fonseca R., Yan Y., et al. . 2018. The purinergic receptor P2RX7 directs metabolic fitness of long-lived memory CD8+ T cells. Nature. 559:264–268. 10.1038/s41586-018-0282-0 - DOI - PMC - PubMed

Publication types

Substances