. 2022 Oct 3;219(10):e20220126.
doi: 10.1084/jem.20220126. Epub 2022 Aug 18.

HER2 drives lung fibrosis by activating a metastatic cancer signature in invasive lung fibroblasts

Affiliations

HER2 drives lung fibrosis by activating a metastatic cancer signature in invasive lung fibroblasts

Xue Liu et al. J Exp Med. .

Abstract

Progressive tissue fibrosis, including idiopathic pulmonary fibrosis (IPF), is characterized by excessive recruitment of fibroblasts to sites of tissue injury and unremitting extracellular matrix deposition associated with severe morbidity and mortality. However, the molecular mechanisms that control progressive IPF have yet to be fully determined. Previous studies suggested that invasive fibroblasts drive disease progression in IPF. Here, we report profiling of invasive and noninvasive fibroblasts from IPF patients and healthy donors. Pathway analysis revealed that the activated signatures of the invasive fibroblasts, the top of which was ERBB2 (HER2), showed great similarities to those of metastatic lung adenocarcinoma cancer cells. Activation of HER2 in normal lung fibroblasts led to a more invasive genetic program and worsened fibroblast invasion and lung fibrosis, while antagonizing HER2 signaling blunted fibroblast invasion and ameliorated lung fibrosis. These findings suggest that HER2 signaling may be a key driver of fibroblast invasion and serve as an attractive target for therapeutic intervention in IPF.


Conflict of interest statement

Disclosures: B.R. Stripp reported grants from Bristol Myers Squibb outside the submitted work. No other disclosures were reported.

Figures

None
Graphical abstract
Figure S1.
Figure S1.
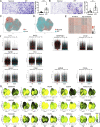
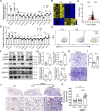
Identification of novel marker genes of invasive and noninvasive lung fibroblasts. (A and B) Cell migration (A) and invasion (B) assays were performed on normal and IPF fibroblasts (A, n = 8 per group; B, n = 7 for normal and n = 8 for IPF). (C and D) Visualization of the distribution of invasive and noninvasive cells (C) and healthy and IPF cells (D). (E) Heatmap of the top 1,000 significant genes in invasive and noninvasive fibroblasts. (F) Violin plot visualization of the canonical lung fibrosis related genes and cell proliferation marker genes. (G) Identification of the novel cell-surface marker, LincRNA, and transcriptional factor genes differentially expressed in invasive and noninvasive fibroblasts. non, noninvasive; in, invasive. Three independent experiments were performed on fibroblasts from different patients (A and B). Data are the mean ± SEM. **, P < 0.01; ***, P < 0.001 by Student’s t test (A and B).
Figure 1.
Figure 1.
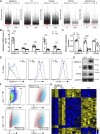
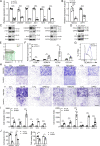
Cell-surface markers were used to identify invasive fibroblasts. (A) Violin plot comparisons of cell-surface marker gene expression in invasive and noninvasive fibroblasts. (B) Relative expression of cell-surface marker genes in bulk RNA-seq on invasive and noninvasive fibroblasts (n = 9 per group). (C) Relative expression of SEMA7A, F3, and ITGA6 in invasive and noninvasive fibroblasts by qRT-PCR (n = 6 for SEMA7A and F3, and n = 4 for ITGA6). (D) Cell-surface expression of SEMA7A, F3, and ITGA6 in invasive and noninvasive fibroblasts by flow cytometry. (E) Western blot analysis of SEMA7A, F3, and ITGA6 expression in invasive and noninvasive fibroblasts. GAPDH served as loading control. (F) Cell-surface expression of CD274, F3, and ITGA6 in SEMA7A negative and high fibroblasts by flow cytometry. (G) Heatmap of consistent genes in SEMA7Ahigh and invasive, SEMA7Anegative and noninvasive fibroblasts, respectively, by bulk RNA-seq. non, noninvasive fibroblasts; in, invasive fibroblasts; neg, negative. Three independent experiments were performed on fibroblasts from different patients (B and C). Data are the mean ± SEM. *, P < 0.05; ****, P < 0.0001 by student’s t test (B and C). Source data are available for this figure: SourceData F1.
Figure 2.
Figure 2.
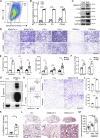
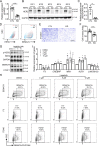
Specific cell-surface marker genes of invasive fibroblasts promoted invasion and fibrosis. (A) Cell sorting strategy of F3, SEMA7A, and ITGA6 negative and high fibroblasts for following experiments. (B and C) Relative mRNA levels (B; n = 4 per group) and total protein levels (C) of F3, SEMA7A, and ITGA6 expression in sorted F3, SEMA7A, and ITGA6 negative and high fibroblasts. (D and E) Representative images (D) and index (E; SEMA7ANeg/High migration/invasion, n = 4 per group; F3Neg/High migration, n = 12 per group, invasion, n = 9 per group; ITGA6Neg/High migration, n = 9 per group, invasion, n = 12 per group) of migration and invasion of SEMA7A, F3, and ITGA6 negative and high fibroblasts. (F) Cell adhesion of SEMA7A and ITGA6 high and negative fibroblasts was quantified (n = 4 per group). (G) Overexpression of SEMA7A was confirmed by Western blotting. (H) Cell-surface expression of SEMA7A in SEMA7A overexpression and control fibroblasts. (I and J) Representative images (I) and index (J; n = 3 per group) of migration and invasion of SEMA7A overexpression fibroblasts. (K) Quantification of percentage of SEMA7A+ fibroblasts by flow cytometry on freshly isolated normal and IPF human lungs (Normal, n = 4; IPF, n = 7). (L and M) Trichrome staining (L) and hydroxyproline (M; n = 10 per group) of mice lungs receiving SEMA7A high and negative fibroblasts, and age-matched mice were treated with culture medium only. Dash-boxed regions were shown at higher magnification. CTL, control; OE, overexpression. Scale bar: 1 mm (D and I), 500 μm (L). Three or four independent experiments were performed on fibroblasts from different patients (B, E, F, J, K, and M). Data are the mean ± SEM. *, P < 0.05; **, P < 0.01; ***, P < 0.001; ****, P < 0.0001 by Student’s t test (B, E, F, and I–K) and two-way ANOVA (M). Source data are available for this figure: SourceData F2.
Figure S2.
Figure S2.
ERBB2 (HER2) was the top inhibited upstream regulator in noninvasive fibroblasts. (A) Flow cytometry analysis confirmed the overexpression of SEMA7A in lung fibroblasts. (B) Cell proliferation rates of fibroblasts with SEMA7A overexpression or control fibroblasts were determined by EdU assays. (C) Cell-surface expression of SEMA7A was determined by flow cytometry on single-cell homogenate of CD31, CD45, EPCAM cells from IPF and healthy samples. (D) Single-cell Western blot confirmed the downregulation of FOXF1 in invasive fibroblasts. (E and F) Dot plot visualization of the −Log10(FDR) (E) and bar plot visualization of the Activation Z-score (F) of the top 30 activated and inhibited upstream regulators of noninvasive fibroblasts by IPA analysis. ERBB2 was the top inhibited regulators of noninvasive fibroblasts. ERBB2 was highlighted as the most inhibited regulator. (G) The regulating network of invasive fibroblasts combining canonical signaling pathways and upstream regulators showed that the core signaling pathway was the invasion of tumor cell lines, suggesting that invasive lung fibroblasts had metastatic cancer-related signatures.
Figure 3.
Figure 3.
Differentially expressed transcription factors in invasive and noninvasive fibroblasts. (A) Visualization of differentially expressing transcription factors using violin plot in invasive and noninvasive fibroblasts. (B–D) Expression validation of transcription factors by bulk RNA-seq analysis (B) and qRT-PCR analysis (C and D). B, n = 9 per group; C, n = 4 for TSC22D1 and n = 5 for other groups; D, n = 6 per group. (E and F) Western blot analysis of transcription factor expression in invasive and noninvasive fibroblasts. GAPDH served as loading control. non, noninvasive fibroblasts; in, invasive fibroblasts. Three independent experiments were performed on fibroblasts from different patients (B–D). Data are the mean ± SEM. *, P < 0.05; **, P < 0.01; ***, P < 0.001; ****, P < 0.0001 by Student’s t test (B–D). Source data are available for this figure: SourceData F3.
Figure 4.
Figure 4.
Transcription factors regulated lung fibroblast invasion. (A–D) Knockdown of transcriptional factors was confirmed by qRT-PCR (A and B) and Western blotting (C and D). A, n = 9 for FOXF1, n = 4 for CREBRF, TSC22D1, and KLF9, n = 6 for MXI1, n = 3 for NFE2L2; B, n = 4 for HMGA2, n = 5 for DPF3. (E) FOXF1 and SEMA7A expressions showed negative correlation in scRNA-seq by SeqGeq. (F and G) Relative mRNA levels of FOXF1, SEMA7A, and collagen-related protein gene, ACTA2 and COL1A1 (F, n = 5 per group) and cell-surface expression of SEMA7A (G) after FOXF1 knockdown. (H–J) Representative images (H) and index quantification (I and J) of migration and invasion of fibroblasts after knockdown assay. I, FOXF1, CREBRF, TSC22D1, and MXI1, n = 6 for migration and invasion, KLF9, n = 3 for migration and invasion, NFE2L2, n = 3 for migration and n = 11 for invasion; J, HMGA2, n = 6 for migration and invasion, DPF3, n = 3 for migration and invasion. CTL, control; non, noninvasive; in, invasive. Three or four independent experiments were performed on fibroblasts from different patients (A, B, F, I, and J). Data are the mean ± SEM. Scale bar: 1 mm. *, P < 0.05; **, P < 0.01; ***, P < 0.001; ****, P < 0.0001 by Student’s t test. Source data are available for this figure: SourceData F4.
Figure 5.
Figure 5.
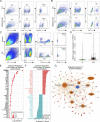
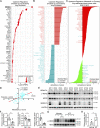
Significantly activated ERBB2 (HER2) signaling pathway in invasive fibroblasts. (A and B) Dot plot visualization of the −Log10(FDR) (A) and bar plot visualization of the activation Z-score (B) of the top 30 activated and inhibited upstream regulators of invasive fibroblasts by IPA analysis. ERBB2 was the most activated regulators of invasive fibroblasts. ERBB2 was highlighted as the most activated regulator. (C) IPA analysis revealed the upstream regulators of metastatic lung adenocarcinoma cancer cells compared to primary cancer cells retrieved from GSE131907. Most of the top activated/inhibited (listed in red/green texts, respectively) upstream regulators of invasive fibroblasts were these of metastatic cancer cells. (D) Pearson correlation analysis of activation z-score of shared upstream regulators (n = 129) of invasive fibroblasts versus metastatic lung adenocarcinoma cancer cell. Linear regression analysis was performed and visualized in red line. (E) p-HER2, total HER2, and SEMA7A protein levels in sorted SEMA7A high and negative fibroblasts in nine IPF fibroblast lines were determined by Western blot. GAPDH served as loading control. (F) Quantification of the Western blot was used to determine the relative protein levels of p-HER2, total HER2, and SEMA7A in E (n = 9 per group). (G and H) p-HER2 and total HER2 in sorted fibroblasts from three normal and four IPF lung were determined by Western blot and quantification was performed (H; n = 4). Neg, megative; P, proximal lung regions; D, distal lung regions. Two independent experiments were performed on fibroblasts from different patients (F and H). Data are the mean ± SEM. *, P < 0.05; **, P < 0.01; ****, P < 0.0001 by Student’s t test (F and H). Source data are available for this figure: SourceData F5.
Figure S3.
Figure S3.
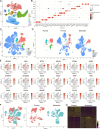
Retrieval of scRNA-seq on primary and metastatic lung adenocarcinoma from GSE131907. (A and B) Cell-type identification (A) by the expression of canonical cell-type marker gene expression (B). Epi, epithelial cell lineage; Fib, fibroblast; Endo, endothelial cell; Myel, myeloid cell; NK, natural killer; Oligo, Oligodendrocyte; Ukn, unknown cell. (C–E) Epithelial cell lineage extraction and definition (C) and distribution (D) of epithelial cell type by the expression of canonical epithelial cell-type marker genes (E). (F) Extraction and distribution of cancer cell from primary and metastatic tumors. (G) Heatmap of top 500 genes of primary and metastatic cancer cells.
Figure S4.
Figure S4.
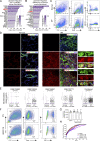
ERBB2 was the top upstream regulator in fibrotic fibroblasts in human and mouse lungs. (A and B) ERBB2 was the top upstream regulator of both human IPF lung fibroblasts (A) and bleomycin-induced mouse lung fibrotic fibroblasts (B). (C) Sorting strategy for normal and IPF lung fibroblasts for p-HER2 and total HER2 Western blot. (D) Immunostaining of HER2/p-HER2 with activated fibroblast (myofibroblast) marker, α-SMA, in normal and IPF human lung cryosections. IgG isotype was used as control for HER2 and p-HER2 staining. Higher magnifications of the boxed regions were provided. (E) Transcription of ERBB2 (HER2) in myofibroblasts in published scRNA-seq datasets. P value of each comparison, cell number (n) of each group, and average expressions of ERBB2 (purple dotted line) were included. (F) Cell proliferation rates of normal fibroblasts with HER2 overexpression or control fibroblasts were determined by EdU assays. (G) Fibroblast viability after Lapatinib treatment was determined by Calcein AM Assay (n = 8 per group). (H) Fibroblast growth rate after treatment of Lapatinib at increasing concentration (n = 6 per group). Three independent experiments were performed on fibroblasts from different patients (G and H). Data are the mean ± SEM. ns, not significant by two-way ANOVA (G). Scale bars, 20 μm (D).
Figure 6.
Figure 6.
HER2 signaling activation increased fibroblast invasion and fibrosis. (A) The expression of invasive and noninvasive specific genes in HER2 overexpression normal fibroblasts were detected by qRT-PCR (n = 3 per group). (B) Heatmap of the differentially expressed genes of control and HER2 overexpressing normal human lung fibroblasts by bulk RNA-seq. (C) Volcano plot of the top differentially expressed genes between control and HER2 overexpressed normal human lung fibroblasts by bulk RNA-seq. Red dots indicated the genes at Fold_change >0.5 and black dots indicated the genes at Fold_change ≤0.5. (D) Relative expression of invasive and noninvasive specific genes in HER2 overexpression normal fibroblasts detected by bulk RNA-seq (n = 5 per group). (E) Upregulated cell-surface expression of SEMA7A in HER2 overexpression normal lung fibroblasts was confirmed by flow cytometry analysis. (F and G) Western blotting confirmation of the expression of p-HER2, HER2, SEMA7A, and FOXF1 in HER2 overexpression normal human lung fibroblasts (F) and quantification of the densitometry (G; n = 3 per group). GAPDH served as loading control. (H and I) Representative images (H) and index quantification (I; n = 6 per group) of normal lung fibroblast invasion after HER2 overexpression. (J and K) Trichrome staining (J) and hydroxyproline (K; n = 10 per group) of mice lungs receiving HER2 overexpressing and control normal human lung fibroblasts, and age-matched mice were treated with culture medium only. Dash-boxed regions were shown at higher magnification. CTL, control; OE, overexpression. Scale bar: 1 mm (H) and 500 μm (J). Three or four independent experiments were performed on fibroblasts from different patients (A, D, G, I, and K). Data are the mean ± SEM. *, P < 0.05; **, P < 0.01; ***, P < 0.001; ****, P < 0.0001 by Student’s t test (A, D, G, and I) and two-way ANOVA (K). Source data are available for this figure: SourceData F6.
Figure 7.
Figure 7.
HER2 deficiency rescued the dysregulated gene profiles in IPF lung fibroblasts. (A–C) HER2 knockdown efficiency was confirmed by qRT-PCR (A) and Western blotting (B and C; A, n = 8 per group; C, n = 5 per group). (D) Cell-surface protein level of HER2 and SEMA7A in HER2 knockdown IPF lung fibroblasts. (E and F) Representative images (E) and index quantification (F; n = 9 per group) of fibroblast invasion after HER2 knockdown. (G) Protein levels of p-HER2, total HER2, SEMA7A, and FOXF1 in IPF lung fibroblasts after treatment of HER2 inhibitor, Lapatinib, at increasing concentrations. (H) Downregulation of cell-surface expression of SEMA7A, F3, and ITGA6 in Lapatinib-treated fibroblasts was determined by flow cytometry analysis. (I) Transcription levels of other representative genes in IPF lung fibroblasts after Lapatinib treatment were determined by qRT-PCR (n = 3 per group). Scale bar: 1 mm (E). CTL, control; KD, knockdown. Three or four independent experiments were performed on fibroblasts from different patients (A, C, F, and I). Data are the mean ± SEM. *, P < 0.05; **, P < 0.01; ****, P < 0.0001 by Student’s t test (A, C, and F) or one-way ANOVA (I). Source data are available for this figure: SourceData F7.
Figure 8.
Figure 8.
Blocking HER2 signaling inhibited IPF lung fibroblast invasion and attenuated fibrosis. (A–C) Representative images (A) and index quantification (B and C) of migration and invasion of fibroblasts treated with increasing doses of Lapatinib or DMSO (n = 3 per group). (D–F) Representative images (D) and index quantification (E and F) of migration and invasion of fibroblasts treated with Pertuzumab or IgG1 (n = 3 per group). (G and H) Masson’s trichrome staining of collagen in lung sections (G) and hydroxyproline content in lung tissues (H) from NSG mice injected with SEMA7Ahigh IPF fibroblasts and treated with Lapatinib, vehicle control, Pertuzumab, or IgG1 control (n = 10 per group). Dash-boxed regions were shown at higher magnification. Three independent experiments were performed on fibroblasts from different patients (B, C, E, and F). Data are the mean ± SEM. Scale bar: 1 mm (A and D) and 500 μm (G). *, P < 0.05; **, P < 0.01; ***, P < 0.001; and ****, P < 0.0001 by one-way ANOVA (B, C, E, and F) and two-way ANOVA (H).
Figure S5.
Figure S5.
Targeting HER2 blunted bleomycin-induced murine lung fibrosis. (A and B) Fibroblast invasion (A) and invasion index (B) after combined treatment of Lapatinib and α-PDL1 (n = 3 per group). (C and D) Masson’s trichrome staining (C) and hydroxyproline content of lung tissues (D) from C57BL/6J mice injured with 1.25 U bleomycin and treated with Lapatinib or vehicle control. Dash-boxed regions were shown at higher magnification (control [CTL] with vehicle, n = 9; CTL with Lapatinib, n = 8; bleomycin with vehicle, n = 9; bleomycin with Lapatinib, n = 7). Three independent experiments were performed on fibroblasts from different patients (B and D). Data are the mean ± SEM. Scale bar: 1 mm (A) and 500 μm (C). *, P < 0.05; **, P < 0.01; ***, P < 0.001; and ****, P < 0.0001 by two-way ANOVA (B and D).
Figure 9.
Figure 9.
Schematic outline summarizing the genetic and regulatory programs of invasive IPF lung fibroblasts and the similarities to that of metastatic lung cancer cells, as well as their contribution to progressive lung fibrosis in a humanized mouse model for idiopathic pulmonary fibrosis.

Similar articles

Cited by

References

    1. Adams, T.S., Schupp J.C., Poli S., Ayaub E.A., Neumark N., Ahangari F., Chu S.G., Raby B.A., DeIuliis G., Januszyk M., et al. . 2020. Single-cell RNA-seq reveals ectopic and aberrant lung-resident cell populations in idiopathic pulmonary fibrosis. Sci. Adv. 6:eaba1983. 10.1126/sciadv.aba1983 - DOI - PMC - PubMed
    1. Ahluwalia, N., Grasberger P.E., Mugo B.M., Feghali-Bostwick C., Pardo A., Selman M., Lagares D., and Tager A.M.. 2016. Fibrogenic lung injury induces non-cell-autonomous fibroblast invasion. Am. J. Respir. Cell Mol. Biol. 54:831–842. 10.1165/rcmb.2015-0040OC - DOI - PMC - PubMed
    1. Artaud-Macari, E., Goven D., Brayer S., Hamimi A., Besnard V., Marchal-Somme J., Ali Z.E., Crestani B., Kerdine-Romer S., Boutten A., and Bonay M.. 2013. Nuclear factor erythroid 2-related factor 2 nuclear translocation induces myofibroblastic dedifferentiation in idiopathic pulmonary fibrosis. Antioxid. Redox Signal. 18:66–79. 10.1089/ars.2011.4240 - DOI - PubMed
    1. Baughman, R.P., Lower E.E., Miller M.A., Bejarano P.A., and Heffelfinger S.C.. 1999. Overexpression of transforming growth factor-α and epidermal growth factor-receptor in idiopathic pulmonary fibrosis. Sarcoidosis Vasc. Diffuse Lung Dis. 16:57–61 - PubMed
    1. Black, M., Milewski D., Le T., Ren X., Xu Y., Kalinichenko V.V., and Kalin T.V.. 2018. FOXF1 inhibits pulmonary fibrosis by preventing CDH2-CDH11 cadherin switch in myofibroblasts. Cell Rep. 23:442–458. 10.1016/j.celrep.2018.03.067 - DOI - PMC - PubMed

Publication types