. 2022 Sep 8;7(17):e154804.
doi: 10.1172/jci.insight.154804.

MCP-1/CCR2 axis inhibition sensitizes the brain microenvironment against melanoma brain metastasis progression

Affiliations

MCP-1/CCR2 axis inhibition sensitizes the brain microenvironment against melanoma brain metastasis progression

Sabina Pozzi et al. JCI Insight. .

Abstract

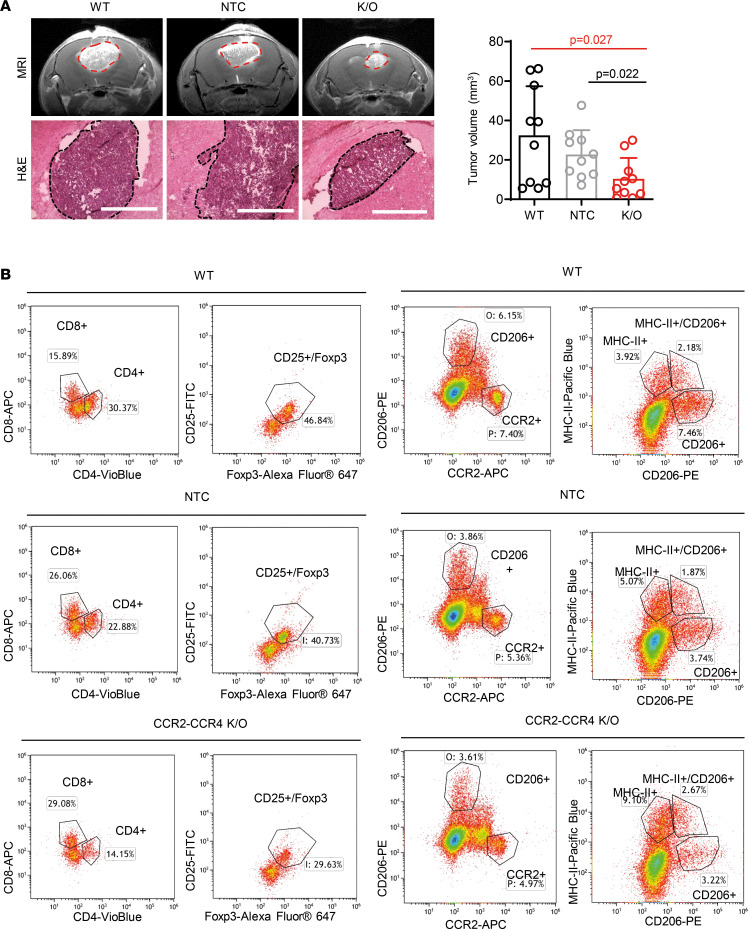
Development of resistance to chemo- and immunotherapies often occurs following treatment of melanoma brain metastasis (MBM). The brain microenvironment (BME), particularly astrocytes, cooperate toward MBM progression by upregulating secreted factors, among which we found that monocyte chemoattractant protein-1 (MCP-1) and its receptors, CCR2 and CCR4, were overexpressed in MBM compared with primary lesions. Among other sources of MCP-1 in the brain, we show that melanoma cells altered astrocyte secretome and evoked MCP-1 expression and secretion, which in turn induced CCR2 expression in melanoma cells, enhancing in vitro tumorigenic properties, such as proliferation, migration, and invasion of melanoma cells. In vivo pharmacological blockade of MCP-1 or molecular knockout of CCR2/CCR4 increased the infiltration of cytotoxic CD8+ T cells and attenuated the immunosuppressive phenotype of the BME as shown by decreased infiltration of Tregs and tumor-associated macrophages/microglia in several models of intracranially injected MBM. These in vivo strategies led to decreased MBM outgrowth and prolonged the overall survival of the mice. Our findings highlight the therapeutic potential of inhibiting interactions between BME and melanoma cells for the treatment of this disease.

Keywords: Cancer immunotherapy; Oncology; Skin cancer; Therapeutics.


Conflict of interest statement

Conflict of interest: HB is a consultant for AsclepiX Therapeutics, Perosphere Inc./AMAG Pharmaceuticals, Inc.; StemGen; InSightec; Accelerating Combination Therapies; Camden Partners; LikeMinds, Inc.; Galen Robotics, Inc.; Nurami Medical; and B*CURED. RSF is on the Board of Directors at Teva Pharmaceutical Industries Ltd.

Figures

Figure 1
Figure 1. MCP-1 is a major astrocyte-secreted factor that influences melanoma migration.
(A) Coculture with astrocytes and melanoma 3D multicellular spheroid (WM115 and D4M.3A mCherry-labeled melanoma cells). Mouse astrocytes unlabeled. Human astrocyte GFP-labeled in green. Dots represent melanoma cell invasion as fluorescence signal of mean ± SD of n = 3 spheroids/well of n = 3 wells of 3 independent experiments (representative image of 1 independent experiment). Nonparametric Student’s 2-sided t test. Scale bar — 400 μm. (B) Astrocyte conditioned media (CM — black) enhance melanoma Transwell migration (WM115 and D4M.3A cells). Pixel density (total area covered per field) of the migrated cancer cells. Representative cell-migrating fields are shown (n = 3). Scale bar — 400 μm. Mean ± SD of n = 3 fields/well of 3 wells of 3 independent experiments. Nonparametric Student’s t test. (C) Levels of 6 proinflammatory astrocyte-secreted cytokines in CM of melanoma cells (B16-F10 — black, A375 — gray, 131/4-5B1 — blue, WM115 — red, and D4M.3A — green) or alternatively in SFM of melanoma cells for 24 hours. Fold change ± SD of 3 independent biological repeats. (D) Melanoma cells (D4M.3A and WM115) were allowed to migrate in the presence of SFM or astrocyte CM (AS CM) in the presence or absence of neutralizing antibodies. AS CM without LPS and AS CM were used as negative controls (NCs) for cell migration in D4M.3A and WM115, respectively. n = 3, mean ± SD of replicates of 3 independent biological repeats. One-way ANOVA. §P < 0.0001, §§P = 0.0014, §§§P = 0.0004, *P = 0.003, **P = 0.0002, ***P = 0.0003.
Figure 2
Figure 2. Inhibition of astrocyte-secreted MCP-1 decreases melanoma migration.
(A) MCP-1 mRNA in murine astrocytes cocultured with melanoma cells (B16-F10 — black, B2905 — gray, D4M.3A — dark green, Mel-ret — green) or human astrocytes cocultured in SFM with melanoma cells (WM115 — red, 131/4-5B1 — blue). Mean ± SD of 3 independent biological repeats. Ordinary 1-way ANOVA. (B) Wound healing migration assay of WM115 cells grown in AS CM (untreated — black empty dot), siRNA:PEI targeting MCP-1 (blue), or NC (black full dot). Mean ± SD of n = 2 fields per well biological replicates (n = 3). Two-way ANOVA. (C) B16-F10 — in black, D4M.3A — in green, WM115 — in blue, A375 — in gray exposed to bindarit for 72 hours. Tumor cell viability assessed by metabolic activity MTT assay. Mean ± SD of triplicates of 3 independent biological repeats. Nonparametric Student’s t test. (D) Secretion of MCP-1 in the CM of untreated, bindarit-treated astrocytes, melanoma CM-treated astrocytes, or melanoma CM-treated astrocytes treated with bindarit. Basal secretion of MCP-1 in WM115 melanoma cells (gray). Human astrocyte CM (hAS CM) (black); bindarit-treated astrocyte CM (red). Unactivated astrocytes (black), LPS-activated (light gray), melanoma CM-treated astrocytes (gray), bindarit-treated astrocytes (red). Mean ± SD of triplicates of 3 independent biological repeats. One-way ANOVA. (E) Western blot of phosphorylated p65 (p-p65) in bindarit-treated astrocytes. Density bands of 1 representative experiment. p-p65 signal is presented as fold change expression relative to p65 expression. Density bands of p-p65 and p65 were normalized by vinculin (loading control). Mean ± SD of triplicates of 3 independent biological repeats. (F) Transwell migration of melanoma WM115 cells toward untreated AS (black), bindarit-treated AS (red), or bindarit-treated AS supplemented with rh-MCP-1 (blue). Representative fields of WM115 migrated cells (n = 3). Scale bar — 400 μm. Mean ± SD of biological replicates (n = 3). One-way ANOVA.
Figure 3
Figure 3. MCP-1 inhibition delays B16-F10 MBM progression.
(A) B16-F10 melanoma cells were intracranially (i.cr.) inoculated in immunocompetent C57BL/6 mice to generate brain metastasis (n = 20). Three days after tumor cell inoculation into the brain, mice were treated with 100 mg/kg i.v. bindarit (n = 10) or PBS (n = 10) QOD until day 15. Image created with BioRender.com. (B) Tumor size in MRI scans at day 13. Representative images of mice bearing brain tumors in PBS- or bindarit-treated groups (n = 10); H&E staining for tumor morphology and size. Scale bar — 400 μm. Quantification of tumor size in B16-F10 brain tumor. Mean ± SD (n = 3 PBS; n = 5 bindarit). Nonparametric Student’s t test. (C) Kaplan-Meier survival curve (n = 7). Two-tailed P values from log-rank (Mantel–Cox). (D) Mouse body weight change was monitored twice a week upon injection of B16-F10 melanoma cells. Mean ± SEM of n = 10 per group. (E) Brain cryosections at day 13 (n = 3) were stained for MCP-1 (red), GFAP (activated astrocytes — green), Iba1 (activated microglia/macrophages — green), IL-6 (green), F4/80 (macrophages — green), CD31 (blood vasculature — green), PD-1/PD-L1 (exhausted T cells/inhibitory molecule — red/green), and CD8+ (cytotoxic T cells — green) markers. Nuclei are shown by DAPI staining (blue). Scale bar — 100 μm. Mean ± SEM of n = 7–10 fields per marker in n = 3 mice per group. Nonparametric Student’s t test. PD-1/PD-L1, programmed cell death 1/programmed cell death ligand 1; T, tumor.
Figure 4
Figure 4. Bindarit treatment improves CD8+ T cell infiltration and decreases immune coinhibitory molecules.
(A) Tumor size and quantification of D4M.3A MBM–bearing mice in MRI scans at day 10 and 14. Representative images of mice bearing brain tumors in PBS- and bindarit-treated group. Mean ± SEM of n = 4 in bindarit-treated group, n = 5 in PBS-treated group. Nonparametric Student’s t test. (B) Tumor size and quantification of B16-F10 or Mel-ret MBM–bearing mice in MRI scans at day 8. Representative images of mice bearing brain tumors in PBS- and bindarit-treated group. Mean ± SEM of n = 5 in bindarit- and PBS-treated group. (C) Histological analysis at day 8 (representative fields of n = 5–7 fields per marker in n = 3 mice per group) of MCP-1/GFAP (in red and in green, respectively), CD206 staining associated with F4/80+ macrophages (in red and in green, respectively), infiltration of CD8+ T cells/Iba1+ microglia/microphages (red/green), tumor proliferation (Ki67 — in red) and blood vasculature (CD31 — in green), and PD-1/PD-L1 exhausted T cells/inhibitory molecules (red/green) in B16-F10 MBM. Nuclei are shown by DAPI staining (blue). Scale bar — 1,000 μm (H&E) and 100 μm (immunofluorescence). Mean ± SEM. Nonparametric Student’s t test.
Figure 5
Figure 5. Bindarit-treated MBM results in a discrete although significant prolongation of the overall mouse survival.
(A) Representative MRI scans and H&E staining, and (B) tumor size quantification of B16-F10 and B2905 MBM–bearing mice in PBS- and bindarit-treated group. B16-F10 MBM — mean ± SEM of n = 7 in bindarit-treated group and n = 8 in PBS-treated group. B2905 MBM — mean ± SEM of n = 7 in PBS- and bindarit-treated groups. Nonparametric Student’s t test. (C) Kaplan-Meier survival curve of B16-F10 MBM–bearing mice showed that bindarit prolonged survival. B16-F10 MBM — n = 8 in PBS-treated group, n = 7 in bindarit. B2905 MBM — n = 8 in PBS- and bindarit-treated group. Two-tailed P values from log-rank (Mantel-Cox). (D) Body weight change was monitored twice a week upon B16-F10 or B2905 tumor resection. Mean ± SEM of n = 8 in PBS-treated group, n = 7 in bindarit in B16-F10 MBM, and n = 8 B2905 MBM in PBS- and bindarit-treated groups.
Figure 6
Figure 6. Astrocytes’ activation and MCP-1 secretion may trigger CCR2/CCR4 overexpression in MBM.
(A) GFAP/MCP-1 immunostaining (green/red) in activated astrocytes within melanoma tumors and in normal brain of human and mouse. FFPE PD-2; cryosection of MBM of mouse models (intracardiac injection of mCherry-labeled D4M.3A cells or mCherry-labeled B16-F10 cells). Representative fields of n = 3 MBM per cell line. Nuclei are shown by DAPI staining (blue). Scale bar — 100 μm. Mean ± SD (n = 3–7 fields of n = 3 MBM per cell line). One-way ANOVA. (B) Representative fields of MCP-1/CCR2 and MCP-1/CCR4 staining in PD-2 and in mouse models of PM and MBM. Scale bar — 100 μm. Nuclei are shown by DAPI staining (blue). Mean ± SD n = 7–10 fields of n = 3 MBM per cell line. One-way ANOVA. (C) Quantification of A GFAP/MCP-1 immunostaining (green/red) in activated astrocytes within melanoma tumors and in normal brain of human and mouse. (D) Quantification of B in PD-2 and in mouse models of PM and MBM.
Figure 7
Figure 7. CCR2/CCR4 CRISPR/Cas9 K/O recapitulates tumor growth and tumor landscape as observed following pharmacological inhibition of MCP-1.
(A) Tumor size and quantification of K/O WT and NTC, shown by its relative tumor volume quantification of MRI scans and H&E staining. Mean ± SEM of n = 10 mice per group. Ordinary 1-way ANOVA. (B) Immune cell infiltration into tumors (A) was analyzed by FACS. For each marker analyzed, the percentage of positive cells gated is presented. n = 2 mice per group.
Figure 8
Figure 8. Summary of the proposed interaction mechanism of MCP-1/CCR2 in MBM.
PM (in the skin) locally invades the tissue, intravasates into the vasculature, and spreads to distant organs, especially to the brain. In this scenario, cancer cells, BME cells, and in particular activated astrocytes, secrete MCP-1, and in return, melanoma cells express CCR2. TAMs/microglia, activated toward antiinflammatory/protumorigenic phenotypes together with Tregs, are recruited to the tumor site. CD8+ T cells are poorly activated (CD107) and express PD-1, which results in uncontrolled tumor dissemination. Created with BioRender.com.

Similar articles

Cited by

References

    1. Goyal S, et al. Clinical management of multiple melanoma brain metastases: a systematic review. JAMA Oncol. 2015;1(5):668–676. doi: 10.1001/jamaoncol.2015.1206. - DOI - PMC - PubMed
    1. Durão C, et al. Sudden death associated with melanoma brain metastases. J Pathol Nepal. 2018;8(2):1412–1415. doi: 10.3126/jpn.v8i2.20896. - DOI
    1. Friedlander P. Advances in the Systemic Treatment of Melanoma Brain Metastases. In: Morgan LR, Sarica FB, eds. Brain and Spinal Tumors Primary and Secondary. IntechOpen; 2020.
    1. Vosoughi E, et al. Survival and clinical outcomes of patients with melanoma brain metastasis in the era of checkpoint inhibitors and targeted therapies. BMC Cancer. 2018;18(1):490. doi: 10.1186/s12885-018-4374-x. - DOI - PMC - PubMed
    1. Di Giacomo AM, et al. Immunotherapy of brain metastases: breaking a “dogma”. J Exp Clin Cancer Res. 2019;38(1):419. doi: 10.1186/s13046-019-1426-2. - DOI - PMC - PubMed

Publication types