. 2022 Sep 22;7(18):e162101.
doi: 10.1172/jci.insight.162101.

Fetal maturation revealed by amniotic fluid cell-free transcriptome in rhesus macaques

Affiliations

Fetal maturation revealed by amniotic fluid cell-free transcriptome in rhesus macaques

Augusto F Schmidt et al. JCI Insight. .

Abstract

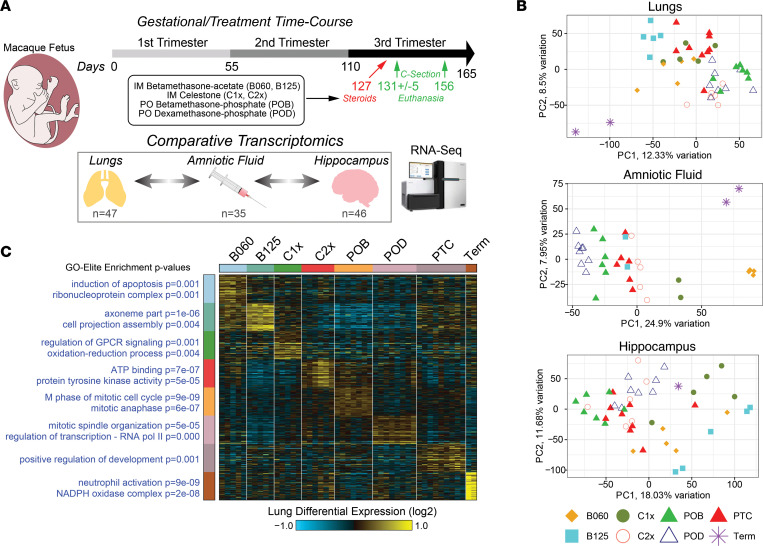
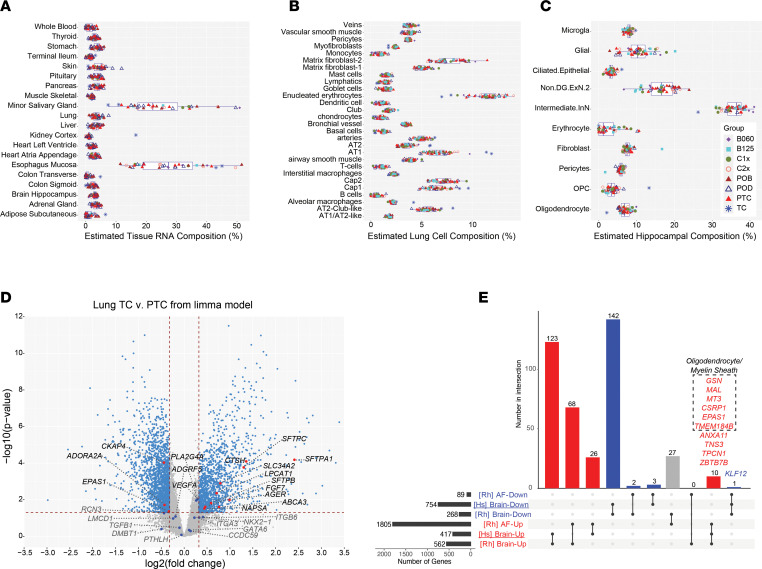
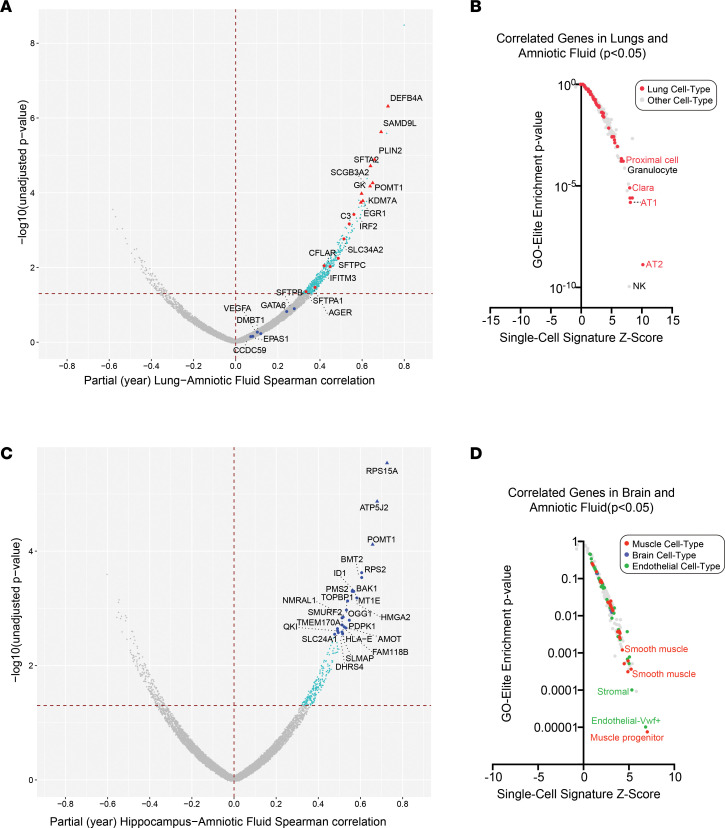
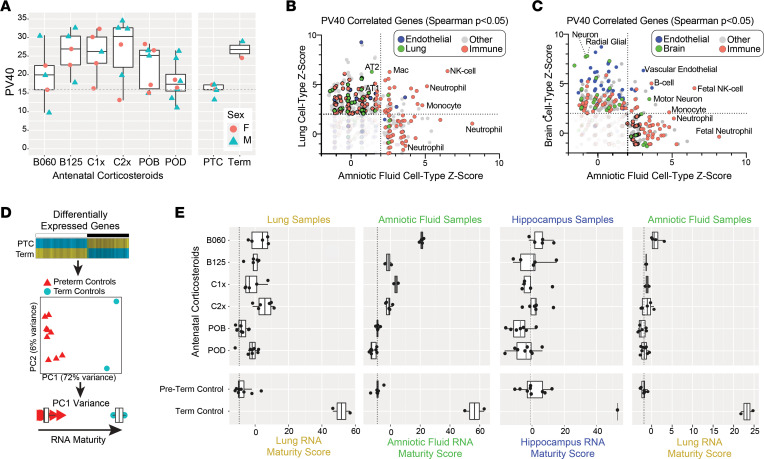
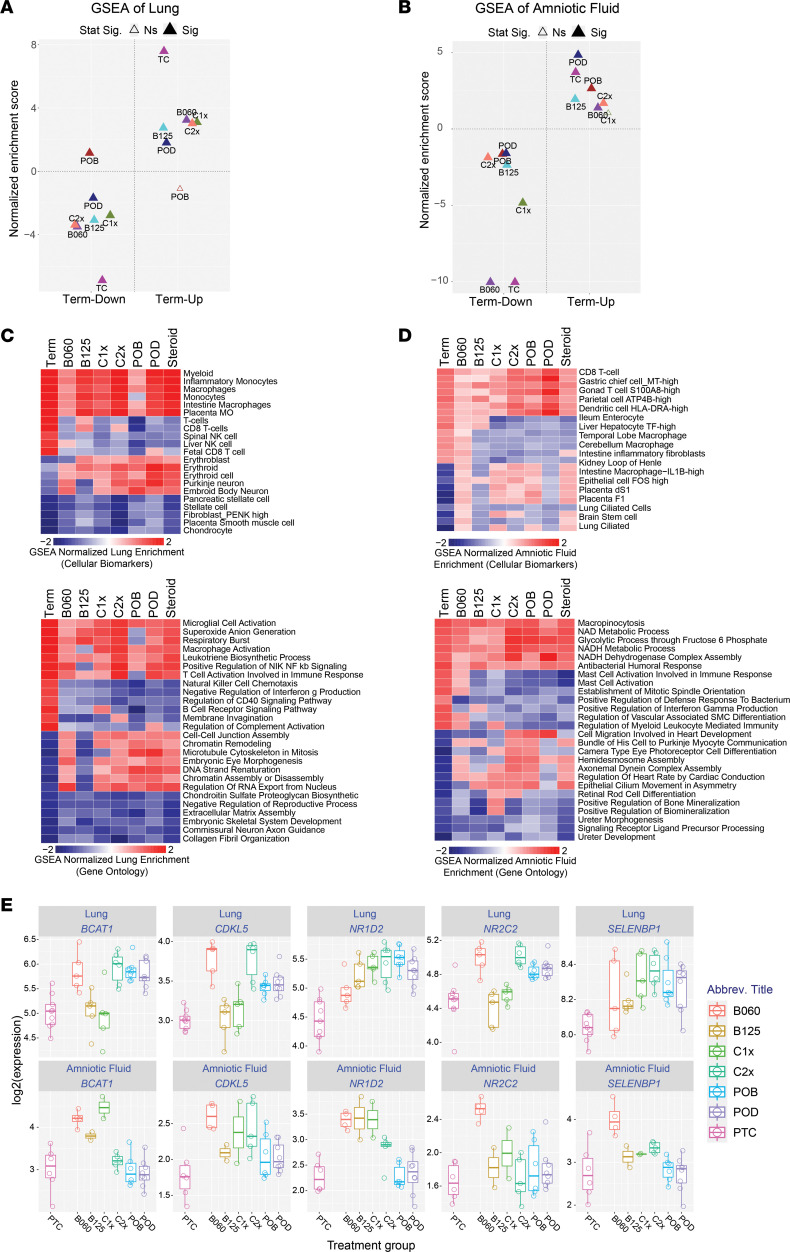
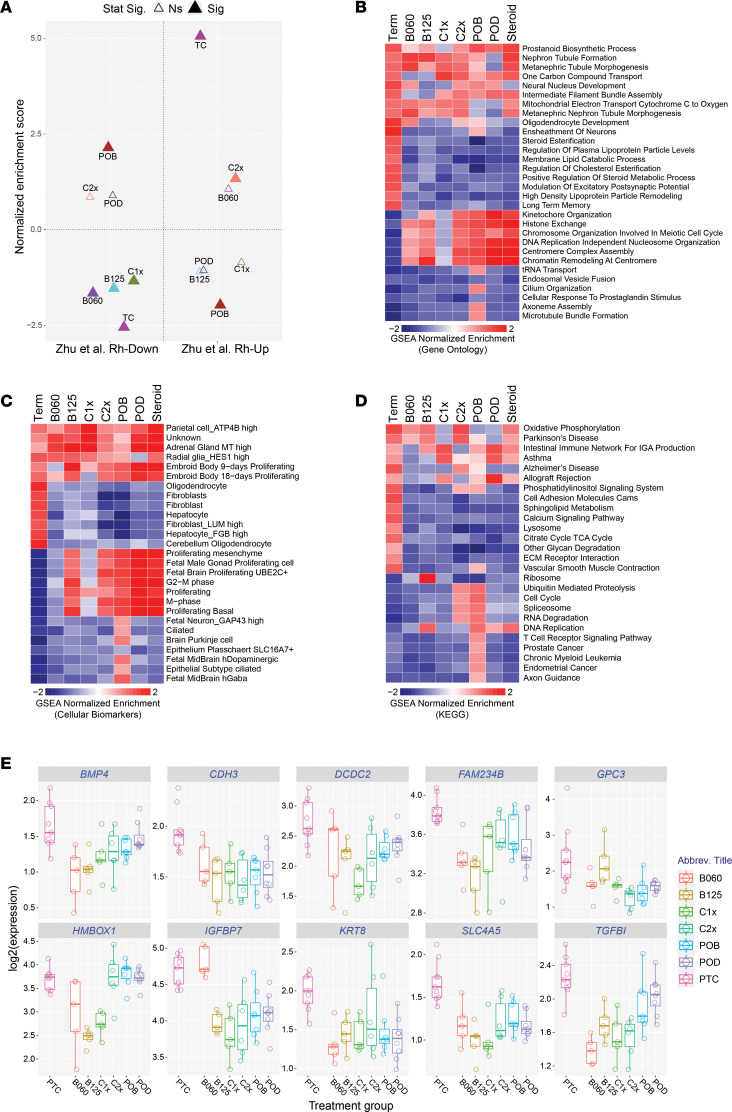
Accurate estimate of fetal maturity could provide individualized guidance for delivery of complicated pregnancies. However, current methods are invasive, have low accuracy, and are limited to fetal lung maturation. To identify diagnostic gestational biomarkers, we performed transcriptomic profiling of lung and brain, as well as cell-free RNA from amniotic fluid of preterm and term rhesus macaque fetuses. These data identify potentially new and prior-associated gestational age differences in distinct lung and neuronal cell populations when compared with existing single-cell and bulk RNA-Seq data. Comparative analyses found hundreds of genes coincidently induced in lung and amniotic fluid, along with dozens in brain and amniotic fluid. These data enable creation of computational models that accurately predict lung compliance from amniotic fluid and lung transcriptome of preterm fetuses treated with antenatal corticosteroids. Importantly, antenatal steroids induced off-target gene expression changes in the brain, impinging upon synaptic transmission and neuronal and glial maturation, as this could have long-term consequences on brain development. Cell-free RNA in amniotic fluid may provide a substrate of global fetal maturation markers for personalized management of at-risk pregnancies.

Keywords: Bioinformatics; Obstetrics/gynecology; Reproductive Biology.


Figures

Figure 1
Figure 1. Evaluation of antenatal corticosteroids across tissues and amniotic fluid during rhesus gestation.
(A) Study design for treatment and C-section of pregnant rhesus macaque females using indicated antenatal corticosteroid dosing. Amniotic fluid and brain (hippocampus) and lung tissue were collected from each fetus from either preterm (127–136 days) or term (156 and 157 days) gestation and analyzed by bulk RNA-Seq analysis. (B) PCA of all genes, following removal of strongly sex-associated genes and NOISeq batch-effect correction, for amniotic fluid, brain, and lungs (mean TPM ≥ 1). (C) Heatmap of the top most-specific marker genes for lung RNA-Seq for each treatment. Expression values were calculated as log2 fold changes relative to the mean of each row. The top GO-Elite Gene Ontology enrichment results are denoted to the left of each cluster, along with corresponding Fischer’s exact test enrichment P values. B060, i.m. betamethasone-acetate 0.06 mg/kg × 1 dose; B125, i.m. betamethasone-acetate 0.125 mg/kg × 1 dose; C1x, i.m. Celestone (betamethasone-acetate + betamethasone-phosphate) 0.25 mg/kg × 1 dose; C2x, i.m. Celestone 0.25 mg/kg × 2 doses; POB, oral betamethasone-phosphate 0.15 mg/kg × 3 doses; POD, oral dexamethasone-phosphate 0.15 mg/kg × 3 doses; and PTC, preterm control. n = 47 animals for lung; 35 animals for amniotic fluid and 46 animals for hippocampus.
Figure 2
Figure 2. Amniotic fluid reflects tissue- and cell type–specific maturation programs.
(AC) Predicted relative frequency of Rhesus (A) amniotic fluid, (B) lung, and (C) hippocampus relative to appropriate reference tissue/single-cell collections, using deconvolution. (A) Predicted contribution of specific cell types to amniotic fluid relative to adult human tissue bulk RNA-Seq with GTEx, with only the most frequently detected tissues shown with specific estimates for all rhesus samples by treatment groups. (B) Predicted frequency of rhesus lung cell types, based on human neonatal, child, and adult scRNA-Seq samples. (C) Predicted frequency of Rhesus hippocampus cell-types using human fetal hippocampus cell population scRNA-Seq as a reference. (D) Volcano plot of differentially genes comparing the limma P value and fold change for all genes in term amniotic fluid versus preterm controls. Human term-induced genes from amniotic fluid defined previously are highlighted red (significant) or blue (nonsignificant) (fold ≥ 1.25 and limma P ≤ 0.05 adjusted for treatment year effects). Dashed reference lines mark fold change (vertical) and P value (horizontal) thresholds. (E) UpSet-style plot (marginal intersection counts) indicating overlap of differentially expressed genes in human neonatal versus midgestation hippocampus [Hs], compared with rhesus macaque term versus preterm hippocampus (25) and/or amniotic fluid [Rh]. Genes associated with oligodendrocyte cell identity and myelin sheath formation are highlighted. B060, i.m. betamethasone-acetate 0.06 mg/kg × 1 dose; B125, i.m. betamethasone-acetate 0.125 mg/kg × 1 dose; C1x, i.m. Celestone (betamethasone-acetate + betamethasone-phosphate) 0.25 mg/kg × 1 dose; C2x, i.m. Celestone 0.25 mg/kg × 2 doses; POB, oral betamethasone-phosphate 0.15 mg/kg × 3 doses; POD, oral dexamethasone-phosphate 0.15 mg/kg × 3 doses; PTC, preterm control; AT1/2, alveolar type 1/2; OPC, oligodendrocyte precursor cell; InN, inhibitory interneuron; and Non.DG.ExN.2, nondentate gyrus excitatory neuron 2. Data are presented as individual values; boxes represent median, 25th, and 75th percentiles; whiskers extend to ± 1.5 interquartile range. n = 47 animals (lung), 35 animals (amniotic fluid), and 46 animals (hippocampus).
Figure 3
Figure 3. Detection of tissue maturation programs in amniotic fluid.
(A and C) Volcano plot of gene expression correlation (Spearman’s rank, controlling for treatment year) from the same animals (treatment and controls) in (A) amniotic fluid and lungs or (C) amniotic fluid and hippocampus. Spearman P value and rank correlation are shown in the plot, with genes previously observed to be induced in human amniotic fluid, called out and designated by red (significant correlation) or blue (nonsignificant) in A. In C, the top significant genes (Spearman’s correlation ≥ 0.5 and P < 0.003) are designated in blue. Triangle markers denote FDR-adjusted P < 0.05. (B and D) Gene-set enrichment of all available single-cell, cell type signatures for (B) amniotic-fluid/lung positively correlated transcripts (P ≤ 0.05) or (D) amniotic-fluid/brain positively correlated transcripts. Gene sets for lung associated with lung are specifically denoted in B, and those for muscle, brain, or endothelial (most frequently enriched) are denoted in D. n = 35 paired samples for lung with amniotic fluid and hippocampus with amniotic fluid.
Figure 4
Figure 4. In silico tissue maturation analysis predicts optimal corticosteroid regimens from amniotic fluid.
(A) Measurement of lung gas volume at 40 cmH2O on the pressure volume curve (PV40) was performed on fetal lungs immediately following euthanasia. Preterm samples had the lowest PV40 and term samples the highest, with substantial variation among antenatal corticosteroid treated animals. Male and female fetuses are separately indicated. (B) Statistical enrichment of gene sets from diverse single-cell data sets (n > 2,000) for lung and amniotic fluid transcripts that are positively correlated with PV40, across the collection of rhesus samples (2 outlier animals removed). Cell type signatures associated with endothelial cells, lung cells, immune, and cell type signatures associated with endothelial cells, lung cells, immune, and other annotated cell types are highlighted, along with significant enrichment results (Z score > 2, Fisher’s exact P < 0.05 [FDR corrected]) in either or both lungs and amniotic fluid. (C) Data plotted as in B, comparing statistically enriched single-cell signatures from brain and amniotic fluid samples. (D) RNA maturity scoring algorithm design. Differentially expressed genes for term versus preterm control animals are calculated (see Methods) and selected for PCA of term and preterm samples to capture the loadings for PC1 to compute scores for all samples using the PCATools predict function. (E) In silico maturity scores from each fetus lung, brain, or amniotic fluid sample are displayed according to treatment group using either the scoring schema from that same tissue (left 3 plots) or for amniotic fluid scored based on the lung scoring schema for lung PC1 loading genes. Data on A and E are presented as individual values, with box representing the median and the 25th and 75th percentile and whiskers extending to ± 1.5 IQR. n = 47 animals for lung, 35 animals for amniotic fluid, and 46 animals for hippocampus.
Figure 5
Figure 5. Treatment-specific and common pathways impacted in rhesus lung and amniotic fluid.
(A and B) Comparison of gene set enrichment results for each steroid treatment regimen in (A) lungs or (B) amniotic fluid relative to term versus preterm impacted genes (up- or downregulated), to identify consistent maturation impacts. Top 500 up- and downregulated genes for each signature were used for GSEA. The filled triangulates indicate P < 0.1 (FDR corrected). (C and D) Heatmaps of gene set enrichments for each steroid treatment regimen or term versus preterm controls, to clarify maturation, common treatment or specific regimen impacts for GO terms or cellular biomarkers (AltAnalyze). (C) Heatmaps for lung. (D) Heatmaps for amniotic fluid. Full differential expression gene sets P value ordered (signed according to the fold direction) are provided for all fgsea analyses. Heatmap color coding uses fgsea normalized enrichment score, with red indicating positive and blue indicating negative enrichment. n = 47 animals for lung and 35 animals for amniotic fluid. (E) Box plots common upregulated genes in fetal lung and amniotic fluid comparing corticosteroid treated versus preterm controls. Open circles denote individual biological replicates lung (FC ≥ 1.5, unadjusted P < 0.05) and amniotic fluid (log[FC] > 0, unadjusted P < 0.05).
Figure 6
Figure 6. Steroids alter neuronal developmental pathways in vivo.
(A) Comparison of gene set enrichment results for each steroid treatment regimen in hippocampus relative to term versus preterm impacted genes (up- or downregulated), to identify consistent maturation impacts. Top 500 up- and downregulated genes for each signature were used for GSEA. The filled triangulates indicate P < 0.1 (FDR corrected). (BD) Heatmaps of gene set enrichments in the hippocampus for each steroid treatment regimen or term versus preterm controls, to clarify maturation, common treatment, or specific regimen impacts for (B) GO terms, (C) single-cell biomarkers, or (D) curated pathways. Full differential expression gene sets P value ordered (signed according to the fold direction) are provided for all GSEA analyses. Heatmap color coding uses GSEA normalized enrichment score, with red indicating positive and blue indicating negative enrichment. n = 47 animals for lung, 35 animals for amniotic fluid, and 46 animals for hippocampus. (E) Gene expression box plots for selected genes illustrating the range of intratreatment variation among hippocampal transcripts induced by the different steroid regimens. Selected genes are from the set of n = 38 genes with log2 fold change < –0.4 and an unadjusted P < 0.05 in the comparison of combined steroid treatment samples to preterm controls.

Similar articles

Cited by

References

    1. Blencowe H, et al. Born too soon: the global epidemiology of 15 million preterm births. Reprod Health. 2013;10 Suppl 1:S2. - PMC - PubMed
    1. ACOG Medically indicated late-preterm and early-term deliveries: ACOG Committee Opinion, Number 831. Obstet Gynecol. 2021;138(1):35–39. doi: 10.1097/AOG.0000000000004447. - DOI - PubMed
    1. Spong CY, et al. Timing of indicated late-preterm and early-term birth. Obstet Gynecol. 2011;118(2 pt 1):323–333. - PMC - PubMed
    1. Geary CWJ. In: Spitzer AR, ed. Amniotic fluid markers of fetal maturity. Intensive Care of the Fetus and Neonate. Elsevier-Mosby; 2005:1440.
    1. Kamath-Rayne BD, et al. Amniotic fluid: the use of high-dimensional biology to understand fetal well-being. Reprod Sci. 2014;21(1):6–19. doi: 10.1177/1933719113485292. - DOI - PMC - PubMed

Publication types

Substances