. 2022 Aug 18;17(8):e0272093.
doi: 10.1371/journal.pone.0272093. eCollection 2022.

Multi-omics assessment of dilated cardiomyopathy using non-negative matrix factorization

Affiliations

Multi-omics assessment of dilated cardiomyopathy using non-negative matrix factorization

Rewati Tappu et al. PLoS One. .

Abstract

Dilated cardiomyopathy (DCM), a myocardial disease, is heterogeneous and often results in heart failure and sudden cardiac death. Unavailability of cardiac tissue has hindered the comprehensive exploration of gene regulatory networks and nodal players in DCM. In this study, we carried out integrated analysis of transcriptome and methylome data using non-negative matrix factorization from a cohort of DCM patients to uncover underlying latent factors and covarying features between whole-transcriptome and epigenome omics datasets from tissue biopsies of living patients. DNA methylation data from Infinium HM450 and mRNA Illumina sequencing of n = 33 DCM and n = 24 control probands were filtered, analyzed and used as input for matrix factorization using R NMF package. Mann-Whitney U test showed 4 out of 5 latent factors are significantly different between DCM and control probands (P<0.05). Characterization of top 10% features driving each latent factor showed a significant enrichment of biological processes known to be involved in DCM pathogenesis, including immune response (P = 3.97E-21), nucleic acid binding (P = 1.42E-18), extracellular matrix (P = 9.23E-14) and myofibrillar structure (P = 8.46E-12). Correlation network analysis revealed interaction of important sarcomeric genes like Nebulin, Tropomyosin alpha-3 and ERC-protein 2 with CpG methylation of ATPase Phospholipid Transporting 11A0, Solute Carrier Family 12 Member 7 and Leucine Rich Repeat Containing 14B, all with significant P values associated with correlation coefficients >0.7. Using matrix factorization, multi-omics data derived from human tissue samples can be integrated and novel interactions can be identified. Hypothesis generating nature of such analysis could help to better understand the pathophysiology of complex traits such as DCM.


Conflict of interest statement

The authors have declared that no competing interests exist.

Figures
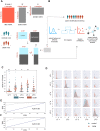
Fig 1
Fig 1. Overview of matrix factorization and distribution of latent factors.
A) The general concept of matrix factorization is detailed in the figure. Matrix A with m features and n samples can be decomposed at rank r in two matrices, one signifying the relationship of the original features with the latent factors (W matrix) and another signifying the relationship of the latent factors and the samples (H matrix). The cohort with 24 control and 33 DCM samples is profiled for gene expression and methylation and matrix factorization is carried out on the combined methylation and gene expression data matrices at rank 5. B) The H matrix is used for clustering of patients and determining the potential of the latent factors in discriminating DCM from control samples. From the W matrix, features with high loadings above a threshold (90th percentile) are selected and GO analysis is performed, followed by correlations and network analysis. C) Swarm plot of latent factor values. *** = P<0.0005, ** = P<0.005 as per a Mann-Whitney U test. D) Scatterplots of the latent factors show the pairwise distribution of latent factor values for DCM and control samples. E) Receiver operating characteristic curve for differentiating between DCM and control with the 5 latent factors. TPR = true positive rate. FPR = false positive rate. F) Receiver operating characteristic curve using 4 significant latent factors.
Fig 2
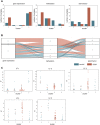
Fig 2. Clustering of the samples with latent factor profile.
A) Clusters obtained using the k-means algorithm at k = 4 for the gene expression data matrix, methylation data matrix and latent factor profile. Clusters 0, 1, 2 and 3 are plotted on the X-axis and Y-axis represents the number of control and DCM samples in each cluster. B) A Sankey-flow diagram depicts the flow of samples between the 4 clusters as per the gene expression, methylation and latent factor profile. We see that as per the latent factor profile, several DCM samples (27) are binned into cluster 2. C) Swarm-plots depicting the value of five latent factors for samples in each cluster as obtained by the latent factor profile show which samples have an over-expression of that particular latent factor. We see that for cluster 2 in which DCM samples predominate, have a high value for latent factors 3 and 4.
Fig 3
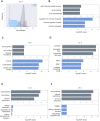
Fig 3. Distribution of W matrix coefficient and top gene ontology terms.
A) The distribution plot of the W coefficients for gene and CpG features for latent factor 3. The labels a-e represent the 99th, 95th, 90th, 75th and 25th quantiles. B-F) Bar plots representing the log10 P value of significance of enrichment for a gene ontology term. For the selected features from each latent factor, (>90th percentile), a GO terms analysis performed for gene and methylation features and the FDR corrected P for significance of the term is reported. ASM = anatomical structure morphogenesis, ECM = extra-cellular matrix, ICMBO = intracellular membrane-bounded organelle.
Fig 4
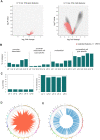
Fig 4. Characterization of features involved in correlations.
A) Volcano plots showing the selected features for latent factor 3. The red dots represent the selected features which is plot against a kernel density estimate representation of all the gene/CpG features. B) The CpG sites were binned into regulatory categories of promoter associated and promoter associated cell type specific. C) For each CpG part of the selected features, the percentage of annotated enhancers and transcription factor binding sites is denoted by bar plots. D) The correlations are characterized in terms of the distance between the interacting partners, for the gene and CpG pairs derived from a latent factor analysis. The red ribbons on the CircOS plot show the connection between the interacting gene and CpG pair having a significant correlation. For this plot, top 5000 such significant correlations part of latent factor 3 were selected. E). The correlations are characterized in terms of distance between interacting partners for m-QTL analysis. Here, the blue ribbons represent the significant correlating pairs (top 5000 randomly selected for m-QTL analysis of genes part of latent factor 3). The visualization emphasizes that the correlations obtained for latent factor analysis are distal (trans-acting) in nature.
Fig 5
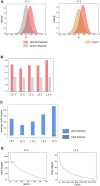
Fig 5. Distribution of the correlation coefficients for latent factor analysis and analysis of node degree of the resulting network.
A) The figure represents the distribution of the correlation coefficients for the correlations analysis performed for selected gene and CpG features (for LF 3). This distribution is compared to a distribution obtained by random selection of gene and CpG features. It is also compared to the distribution obtained in the m-QTL analysis. B) The barplots represent the mean R for the latent factor analysis as compared to random background. C) Average node degree for gene and CpG features per latent factor is represented. D) The sorted node degree values for all gene and CpG features for latent factor 3 are shown. The orange line represents the 90th percentile cut-off used for further analysis of high node-degree genes.
Fig 6
Fig 6. Distribution of correlation coefficients for the gene features within 90th percentile of node degree for latent factor 1 and latent factor 3.
A) Box plots represent the correlation coefficients of the gene features that fall into the 90th percentile of node degree for latent factor 1. B) Similarly, boxplots for the features belonging to latent factor 3 are represented. C) The contingency matrix shows the top correlations (R>0.7) with the gene and CpG features for latent factor 1 and 3, along with the contingency matrix for the validation cohort. D) The bar-plots represent the number of correlating pairs part of the discovery and validation cohorts.
Fig 7
Fig 7. Top gene features for latent factor 3 with differential gene expression between DCM and controls.
A) The boxplots depict the correlations for the genes that have a high node degree and are also significantly differentially expressed between DCM and controls. B) The contingency matrix depicts the correlations for high node degree and significant DCM association features in the discovery and validation cohorts. All CpG sites are not listed in the contingency matrix, refer to S10 Fig for the full list. C) For the TPM3, NEB and ERC2 genes, we plot a network for the CpG sites shared between them. The blue nodes represent the genes and the grey boxes represent the CpG sites. The CpG sites are named by the genes that they are part of.
Fig 8
Fig 8. Scatterplots showing the association between key gene and CpG features.
A) Scatterplots showing the correlation of ERC2, NEB and TPM3 with the CpG site on LRRC14B. Additionally, it represents some of the highly correlating gene and CpG pairs involving high node-degree and differentially expressed genes. B) The expression of the genes and the CpG methylation is visualized by partitioning the samples into clusters as determined using the latent factor profile. The expression of the NEB, TPM3 is particularly high in the cluster 2, which also has a high number of DCM samples.

Similar articles

Cited by

References

    1. Hershberger RE, Hedges DJ, Morales A. Dilated cardiomyopathy: the complexity of a diverse genetic architecture. Nat Rev Cardiol. 2013;10(9):531‐547. doi: 10.1038/nrcardio.2013.105 - DOI - PubMed
    1. McNally EM, Mestroni L. Dilated Cardiomyopathy: Genetic Determinants and Mechanisms. Circ Res. 2017. Sep 15;121(7):731–748. doi: 10.1161/CIRCRESAHA.116.309396 . - DOI - PMC - PubMed
    1. Elliott Perry, Andersson Bert, Arbustini Eloisa, Bilinska Zofia, Cecchi Franco, Charron Philippe, et al.. Classification of the cardiomyopathies: a position statement from the European society of cardiology working group on myocardial and pericardial diseases, European Heart Journal, Volume 29, Issue 2, January 2008, Pages 270–276, doi: 10.1093/eurheartj/ehm342 - DOI - PubMed
    1. Japp AG, Gulati A, Cook SA, Cowie MR, Prasad SK. The Diagnosis and Evaluation of Dilated Cardiomyopathy. J Am Coll Cardiol. 2016;67(25):2996‐3010. doi: 10.1016/j.jacc.2016.03.590 - DOI - PubMed
    1. Greenberg MVC, Bourc’his D. The diverse roles of DNA methylation in mammalian development and disease. Nat Rev Mol Cell Biol. 2019;20(10):590–607. doi: 10.1038/s41580-019-0159-6 - DOI - PubMed

Publication types