. 2022 Aug 18;20(8):e3001686.
doi: 10.1371/journal.pbio.3001686. eCollection 2022 Aug.

Network modeling of dynamic brain interactions predicts emergence of neural information that supports human cognitive behavior

Affiliations

Network modeling of dynamic brain interactions predicts emergence of neural information that supports human cognitive behavior

Ravi D Mill et al. PLoS Biol. .

Abstract

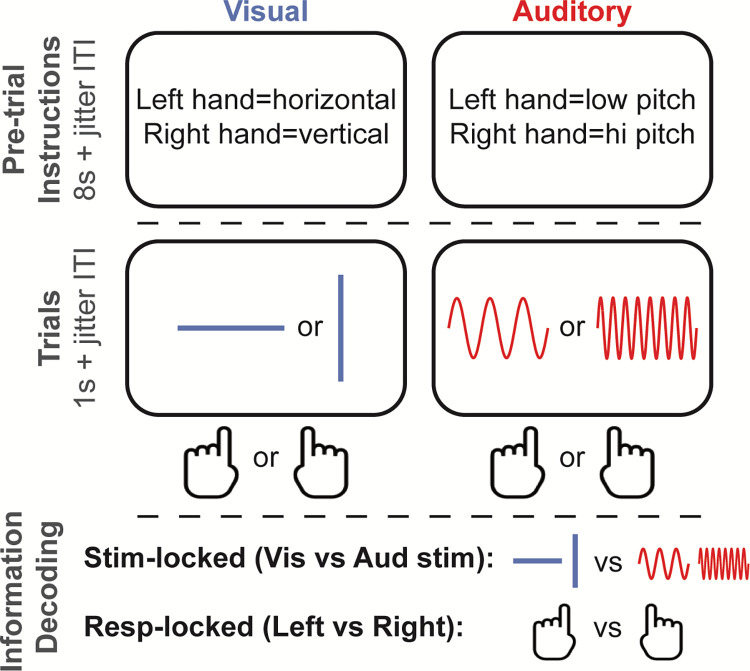
How cognitive task behavior is generated by brain network interactions is a central question in neuroscience. Answering this question calls for the development of novel analysis tools that can firstly capture neural signatures of task information with high spatial and temporal precision (the "where and when") and then allow for empirical testing of alternative network models of brain function that link information to behavior (the "how"). We outline a novel network modeling approach suited to this purpose that is applied to noninvasive functional neuroimaging data in humans. We first dynamically decoded the spatiotemporal signatures of task information in the human brain by combining MRI-individualized source electroencephalography (EEG) with multivariate pattern analysis (MVPA). A newly developed network modeling approach-dynamic activity flow modeling-then simulated the flow of task-evoked activity over more causally interpretable (relative to standard functional connectivity [FC] approaches) resting-state functional connections (dynamic, lagged, direct, and directional). We demonstrate the utility of this modeling approach by applying it to elucidate network processes underlying sensory-motor information flow in the brain, revealing accurate predictions of empirical response information dynamics underlying behavior. Extending the model toward simulating network lesions suggested a role for the cognitive control networks (CCNs) as primary drivers of response information flow, transitioning from early dorsal attention network-dominated sensory-to-response transformation to later collaborative CCN engagement during response selection. These results demonstrate the utility of the dynamic activity flow modeling approach in identifying the generative network processes underlying neurocognitive phenomena.


Conflict of interest statement

The authors have declared that no competing interests exist.

Figures

Fig 1
Fig 1. Task design.
Depicted is one trial from each sensory block condition (10 trials per block, 12 blocks per participants session) and the types of decodable task information.
Fig 2
Fig 2. EEG preprocessing and source modeling pipeline.
Applying this pipeline separately to task and resting-state EEG data reconstructed their respective activation time series. Colored text in panel (iii) provides functional network affiliations for correspondingly colored regions localized from the Power functional atlas: AUD, auditory; CER, cerebellar; CON, cingulo-opercular; DMN, default mode; DAN, dorsal attention; FPN, frontoparietal; SAL, salience; MOT, motor; SUB, subcortical; VAN, ventral attention; VIS, visual. See Methods for full details. EEG, electroencephalography; FEM, finite element modeling; ICA, independent component analysis.
Fig 3
Fig 3. Approach to restFC estimation (via MVAR) and dynamic activity flow modeling.
(A) Estimation of MVAR restFC. Note that for demonstration purposes the schematic uses just 4 regions (1 Motor network target j1, and 3 predictor sources i1-3), whereas the full procedure iterated over 35 Motor targets and included all other 263 regions as sources. Lagged FC weights (β) from source regions and self-coupling terms to each Motor network region were calculated after regularizing the nPCs. This was achieved via cross-validated minimization of the MSE of the MVAR-predicted rest time series for held-out ptrials. (B) The lagged MVAR restFC weights were then combined with the lagged task activation time series to predict future Motor task activations via dynamic activity flow modeling. Iterating over all to-be-predicted Motor targets [35], ptrials (approximately 30), and trial time points (−0.45 to 0.45 s around response commission) populated the full predicted Motor task activation matrix. This predicted matrix was the basis of subsequent response information decoding (dynamic MVPA), motor ERP, and representational overlap analyses that assessed model accuracy. ERP, event-related potential; FC, functional connectivity; MSE, mean squared error; MVAR, multivariate autoregression; nPCs, number of principal components; PCA, principal component analysis; ptrial, pseudo-trial; restFC, resting-state functional connectivity.
Fig 4
Fig 4. Detection of behavioral response information is improved for source versus sensor feature sets.
Group-averaged response decoding time courses for the SourceAll and SensorAll sets, with shaded patches reflecting the standard error of the mean across time points. Colored dots represent time points with significantly decodable information, as assessed by Wilcoxon sign rank tests against 50% classification accuracy (p < 0.05, Bonferroni corrected). The legend in the top right provides the peak decoding accuracy for each time course. Subject-level data underlying this figure are accessible via the public data repository (https://osf.io/mw4k3, subdirectory: Results_figures_data/Figure4).
Fig 5
Fig 5. Network decoding of behavioral response information reveals prominent roles for Motor network and CCNs.
(A) Group decoding time courses color-coded by network affiliation. Colored dots represent significantly decodable time points for each network (p < 0.05 via Wilcoxon sign rank against 50% chance, Bonferroni corrected) and the legend in the top right provides peak decoding accuracies for each network. A magnified plot of the onset of the first significant time point for each network is provided in the top left. (B) Response decoding accuracy ranked across networks at peak 1 (0.03 s). Each bar represents the mean and standard error for each network, with individual participant data points also overlaid. (C) Matrix capturing the significance of cross-network differences in decoding accuracy at peak 1. Plotted is the pairwise difference in mean decoding accuracy, thresholded via paired Wilcoxon tests (p < 0.05, FDR corrected). Positive values denote significantly higher decoding accuracy for the row network > the column network and vice versa for the negative values. (D) and (E) follow the same conventions as (C) and (D), respectively, albeit focusing on peak 2 (0.125 s). Subject-level data underlying this figure are accessible via the public data repository (https://osf.io/mw4k3, subdirectory: Results_figures_data/Figure5). CCN, cognitive control network; FDR, false discovery rate.
Fig 6
Fig 6. Dynamic activity flow modeling accurately and veridically predicts future behavioral response information.
(A) The model accurately predicted future response information dynamics in the Motor network. Predicted and actual group decoding time courses are plotted, with overall decoding peaks (top right), and predicted-to-actual time course overlap (Pearson r) at group and subject levels. (B) The motor ERP waveform (and spatial pattern) was also successfully predicted, demonstrating fidelity to the underlying activations. Group averaged ERP difference waves are plotted (contralateral minus ipsilateral; a.u. = arbitrary units). To aid visualization, the top right depicts the z-scored group waveforms, along with the temporal predicted-to-actual overlap (at group and subject levels). The bottom right provides the spatial overlap between the predicted and actual Motor region activation vectors, extracted over the −0.035 to 0.050 s epoch of significance in the actual data. (C) Representational overlap analyses highlight veridicality of the model-predicted representations, given their ability to decode the actual data. The group information time course resulting from training on predicted representations and testing on the actual data (TrainPred-TestActual) is depicted, as well as the result of training and testing on the actual data (TrainActual-TestActual) for comparison. Response information was quantified as the difference in Pearson r values computed for the test activation pattern at each time point with correct minus incorrect response condition templates (see Methods). Overall information peaks (top right) and temporal overlap between the 2 time courses (bottom right) are provided. For all panels, significance at each time point was assessed via Wilcoxon sign rank tests (versus 50% chance for panel A, and versus 0 for B/C) with Bonferroni correction. Subject-level data underlying this figure are accessible via the public data repository (https://osf.io/mw4k3, subdirectory: Results_figures_data/Figure6). ERP, event-related potential.
Fig 7
Fig 7. Network lesioning reveals contributions of individual functional networks in driving future behavior.
Unlike the visually similar Fig 5 that provided descriptive insight, these analyses provided explanatory insight into which spatial networks likely drive response information representations in the Motor network and their accompanying temporal signatures. For these analyses, all networks were lesioned except for the indicated (non-lesioned) network. (A) Group predicted decoding time courses for each of the network-lesioned models, color-coded by affiliation as before. Magnified decoding onsets (top left), overall decoding peaks (top right) and significant decodability at each time point (assessed via Bonferroni corrected Wilcoxon tests, as before) are provided for each network model. (B) Predicted response decoding accuracy ranked across network models at peak 1 (0.045 s). Each bar represents the mean and standard error for each network, with overlaid subject data points. (C) Matrix capturing cross-network differences in predicted decoding accuracy at peak 1. Plotted is the pairwise difference in mean decoding accuracy, thresholded via paired Wilcoxon (p < 0.05, FDR corrected). Positive values denote significantly higher predicted decoding accuracy for the row network > the column network, and vice versa for the negative values. (D) and (E) follow the same conventions as (C) and (D), respectively, except now focusing on peak 2 (0.155 s). Subject-level data underlying this figure are accessible via the public data repository (https://osf.io/mw4k3, subdirectory: Results_figures_data/Figure7). FDR, false discovery rate.
Fig 8
Fig 8. Control analyses varying number of electrodes and model order.
(A) Group response decoding time courses for the SourceAll (dark lines) and SensorAll (softer lines) feature sets, plotted across variation in number of available electrodes (color-coded). (B) Group response decoding time courses for actual (softer lines) and model-predicted (darker lines) Motor network information, plotted across electrode systems. Note that subject-level predicted-to-actual overlap r values are also provided in the legend (all p < 0.00001). (C) Group response decoding time courses for model-predicted Motor network information across variation in model order (MO; number of lagged predictors). Subject-level predicted-to-actual overlap r values are also provided in the legend (all p < 0.00001). For all panels, significantly decodable time points and group peak decoding accuracies are depicted per conventions in the earlier figures.

Comment in

Similar articles

Cited by

References

    1. Haynes JD. A Primer on Pattern-Based Approaches to fMRI: Principles, Pitfalls, and Perspectives. Neuron. 2015. Jul;87(2):257–70. doi: 10.1016/j.neuron.2015.05.025 - DOI - PubMed
    1. Kriegeskorte N, Kievit RA. Representational geometry: integrating cognition, computation, and the brain. Trends Cogn Sci. 2013. Aug;17(8):401–12. doi: 10.1016/j.tics.2013.06.007 - DOI - PMC - PubMed
    1. Kriegeskorte N, Mur M, Ruff DA, Kiani R, Bodurka J, Esteky H, et al.. Matching Categorical Object Representations in Inferior Temporal Cortex of Man and Monkey. Neuron. 2008. Dec;60(6):1126–41. doi: 10.1016/j.neuron.2008.10.043 - DOI - PMC - PubMed
    1. Grootswagers T, Wardle SG, Carlson TA. Decoding Dynamic Brain Patterns from Evoked Responses: A Tutorial on Multivariate Pattern Analysis Applied to Time Series Neuroimaging Data. J Cogn Neurosci. 2017. Apr;29(4):677–97. doi: 10.1162/jocn_a_01068 - DOI - PubMed
    1. Jimura K, Poldrack RA. Analyses of regional-average activation and multivoxel pattern information tell complementary stories. Neuropsychologia. 2012. Mar;50(4):544–52. doi: 10.1016/j.neuropsychologia.2011.11.007 - DOI - PubMed

Publication types