. 2022 Aug 18;17(8):e0268031.
doi: 10.1371/journal.pone.0268031. eCollection 2022.

Computational analysis on two putative mitochondrial protein-coding genes from the Emydura subglobosa genome: A functional annotation approach

Affiliations

Computational analysis on two putative mitochondrial protein-coding genes from the Emydura subglobosa genome: A functional annotation approach

Megan Yu. PLoS One. .

Abstract

Rapid advancements in automated genomic technologies have uncovered many unique findings about the turtle genome and its associated features including olfactory gene expansions and duplications of toll-like receptors. However, despite the advent of large-scale sequencing, assembly, and annotation, about 40-50% of genes in eukaryotic genomes are left without functional annotation, severely limiting our knowledge of the biological information of genes. Additionally, these automated processes are prone to errors since draft genomes consist of several disconnected scaffolds whose order is unknown; erroneous draft assemblies may also be contaminated with foreign sequences and propagate to cause errors in annotation. Many of these automated annotations are thus incomplete and inaccurate, highlighting the need for functional annotation to link gene sequences to biological identity. In this study, we have functionally annotated two genes of the red-bellied short-neck turtle (Emydura subglobosa), a member of the relatively understudied pleurodire lineage of turtles. We improved upon initial ab initio gene predictions through homology-based evidence and generated refined consensus gene models. Through functional, localization, and structural analyses of the predicted proteins, we discovered conserved putative genes encoding mitochondrial proteins that play a role in C21-steroid hormone biosynthetic processes and fatty acid catabolism-both of which are distantly related by the tricarboxylic acid (TCA) cycle and share similar metabolic pathways. Overall, these findings further our knowledge about the genetic features underlying turtle physiology, morphology, and longevity, which have important implications for the treatment of human diseases and evolutionary studies.


Conflict of interest statement

The authors have declared that no competing interests exist.

Figures

Fig 1
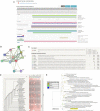
Fig 1. Homology-based genome annotation of the cholesterol side-chain cleavage enzyme.
(A) Apollo gene editor view and AUGUSTUS track of the g19.t1 gene located within the ML679947.1 scaffold. (B) Graphical representation of query coverage across the top 10 BLAST hits on 10 subject sequences. Red means high conservation. (C) COBALT multiple sequence alignment demonstrating high conservation (red) across the homologs. Low conservation is colored gray. Exons (thick lines) and introns (thin lines) are shown. Query sequence is the top, while the subjects are below.
Fig 2
Fig 2. Functional analysis of the cholesterol side-chain cleavage enzyme.
(A) InterPro functional analysis of the enzyme. (B) GO terms for the enzyme outputted by InterPro. (C) STRING network of predicted protein-protein interactions in H. sapiens. (D) List of functional partners predicted by STRING corresponding to C. (E) Gene co-occurrence of the protein. (F) BLAST phylogenetic tree built based on pairwise alignment.
Fig 3
Fig 3. Subcellular localization of the cholesterol side-chain cleavage enzyme.
(A) Bar chart displaying WoLF PSORT prediction of the protein’s localization sites based on 32 nearest neighbors. Mito, mitochondria; cyto_mito, cytoplasm and mitochondria; cyto, cytoplasm; extr, extracellular. (B) TMHMM prediction of TMHs. X-axis represents the amino acid number, and y-axis represents the probability that the amino acid is located within, outside, or inside the membrane. Probabilities >0.75 are significant. (C) SignalP analysis of signal sequences existing in the amino acid sequence of the polypeptide. (D) Phobius predictions of TMHs and signal peptides. X-axis represents the amino acid number, and y-axis represents the probability that the amino acid is transmembrane, cytoplasmic, non-cytoplasmic, and/or a signal peptide. Probabilities >0.75 are significant. (E) TargetP-2.0 prediction of N-terminal pre-sequences, signal peptides, and transit peptides.
Fig 4
Fig 4. Homology modeling and structural predictions of the mitochondrial cholesterol side-chain cleavage enzyme.
(A) Three-dimensional homology model built by SWISS-MODEL. Blue regions are highly conserved, while orange regions are less conserved. (B) Oligo-state, ligands, global quality estimates, template, sequence identity, and coverage outputted by SWISS-MODEL. (C) Local quality estimate showing pair residue estimates. Similarities >0.6 are high-quality models. (D) Comparison with non-redundant set of PDB structures showing QMEAN scores for experimental structures that have been deposited of similar size. The red star is our model. (E) Ramachandran plot showing the probability of a residue having a specific orientation. Dots in the dark green regions represent high probability and a high-quality model. (F) Secondary structure prediction through PSIPRED.
Fig 5
Fig 5. Homology-based genome annotation of the methylmalonyl-CoA epimerase (MCEE) enzyme.
(A) Apollo gene editor view and AUGUSTUS track of the g112.t1 gene located within the ML679947.1 scaffold. Bottom: initial ab initio prediction. Top: consensus gene model. (B) Graphical representation of query coverage across the top 7 BLAST hits on 7 subject sequences before (top) and after (bottom) genome editing. Red means high conservation, and magenta means moderate conservation. (C) COBALT multiple sequence alignment before (top) and after (bottom) genome editing, demonstrating high conservation (red) across the homologs. Low conservation is colored gray. Exons (thick lines) and introns (thin lines) are shown. Query sequence is the top, while the subjects are below.
Fig 6
Fig 6. Functional analysis of the MCEE enzyme.
(A) InterPro functional analysis of the enzyme. (B) STRING network of predicted protein-protein interactions in H. sapiens. (C) List of functional partners predicted by STRING corresponding to B. (D) Gene co-occurrence of the enzyme. (E) BLAST phylogenetic tree built based on pairwise alignment.
Fig 7
Fig 7. Subcellular localization of the MCEE enzyme.
(A) Bar chart showing WoLF PSORT prediction of the protein’s localization sites based on 32 nearest neighbors. Mito, mitochondria; pero = peroxisome; cyto = cytoplasm; extr = extracellular; cyto-nucl, cytoplasm and nucleus. (B) TMHMM prediction of TMHs. X-axis represents the amino acid number, and y-axis represents the probability that the amino acid is located within, outside, or inside the membrane. Probabilities >0.75 are significant. (C) SignalP analysis of signal sequences existing in the amino acid sequence of the polypeptide. (D) Phobius predictions of TMHs and signal peptides. X-axis represents the amino acid number, and y-axis represents the probability that the amino acid is transmembrane, cytoplasmic, non-cytoplasmic, and/or a signal peptide. Probabilities >0.75 are significant. (E) TargetP-2.0 prediction of N-terminal pre-sequences, signal peptides, and transit peptides.
Fig 8
Fig 8. Homology modeling and structural predictions of the MCEE enzyme.
(A) Three-dimensional homology model built by SWISS-MODEL. Blue regions are highly conserved, while orange regions are less conserved. (B) Oligo-state, ligands, global quality estimates, template, sequence identity, and coverage outputted by SWISS-MODEL. (C) Local quality estimate showing pair residue estimates. Similarities >0.6 are high-quality models. (D) Comparison with non-redundant set of PDB structures showing QMEAN scores for experimental structures that have been deposited of similar size. The red star is our model. (E) Ramachandran plot showing the probability of a residue having a specific orientation. Dots in the dark green regions represents high probability and a high-quality model. (F) Secondary structure prediction through PSIPRED.

Similar articles

References

    1. Schoch RR, Sues HD. A Middle Triassic stem-turtle and the evolution of the turtle body plan. Nature. 2015. Jul 30;523(7562):584–7. doi: 10.1038/nature14472 Epub 2015 Jun 24. . - DOI - PubMed
    1. Li C, Fraser NC, Rieppel O, Wu XC. A Triassic stem turtle with an edentulous beak. Nature. 2018. Aug;560(7719):476–479. doi: 10.1038/s41586-018-0419-1 Epub 2018 Aug 22. . - DOI - PubMed
    1. Stanford CB, Iverson JB, Rhodin AGJ, Paul van Dijk P, Mittermeier RA, Kuchling G, et al.. Turtles and Tortoises Are in Trouble. Curr Biol. 2020. Jun 22;30(12):R721–R735. doi: 10.1016/j.cub.2020.04.088 . - DOI - PubMed
    1. Turtle Taxonomy Working Group, Rhodin AGJ. Turtles of the World: Annotated Checklist and Atlas of Taxonomy, Synonymy, Distribution, and Conservation Status (9th Ed.). [Internet]. First. Chelonian Research Foundation and Turtle Conservancy; 2021 [cited 2022 May 5]. (Rhodin A, editor. Chelonian Research Monographs; vol. 8). Available from: https://iucn-tftsg.org/checklist/
    1. Avise JC, Bowen BW, Lamb T, Meylan AB, Bermingham E. Mitochondrial DNA evolution at a turtle’s pace: evidence for low genetic variability and reduced microevolutionary rate in the Testudines. Mol Biol Evol. 1992. May;9(3):457–73. doi: 10.1093/oxfordjournals.molbev.a040735 . - DOI - PubMed

Substances