. 2022 Aug 19;377(6608):eabk0637.
doi: 10.1126/science.abk0637. Epub 2022 Aug 19.

GPNMB confers risk for Parkinson's disease through interaction with α-synuclein

Affiliations

GPNMB confers risk for Parkinson's disease through interaction with α-synuclein

Maria E Diaz-Ortiz et al. Science. .

Abstract

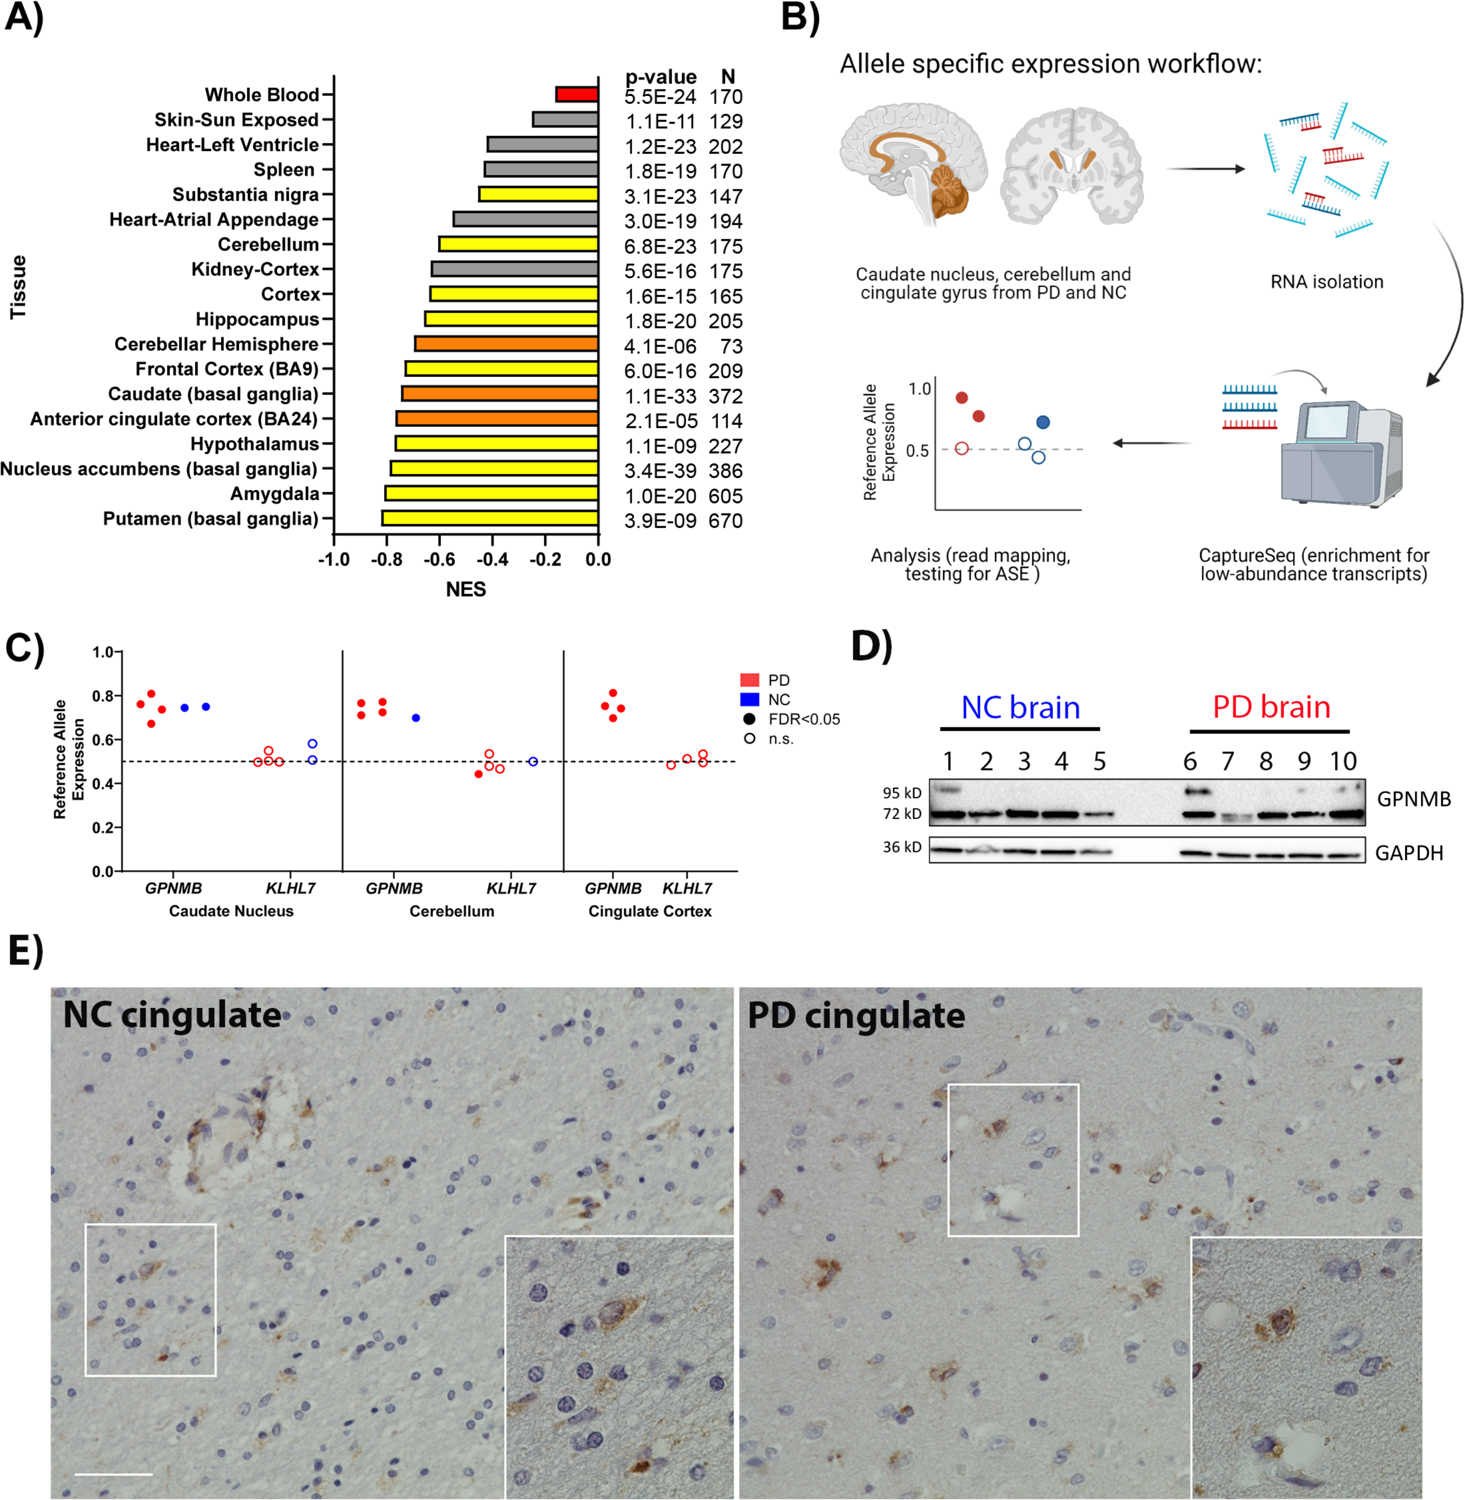
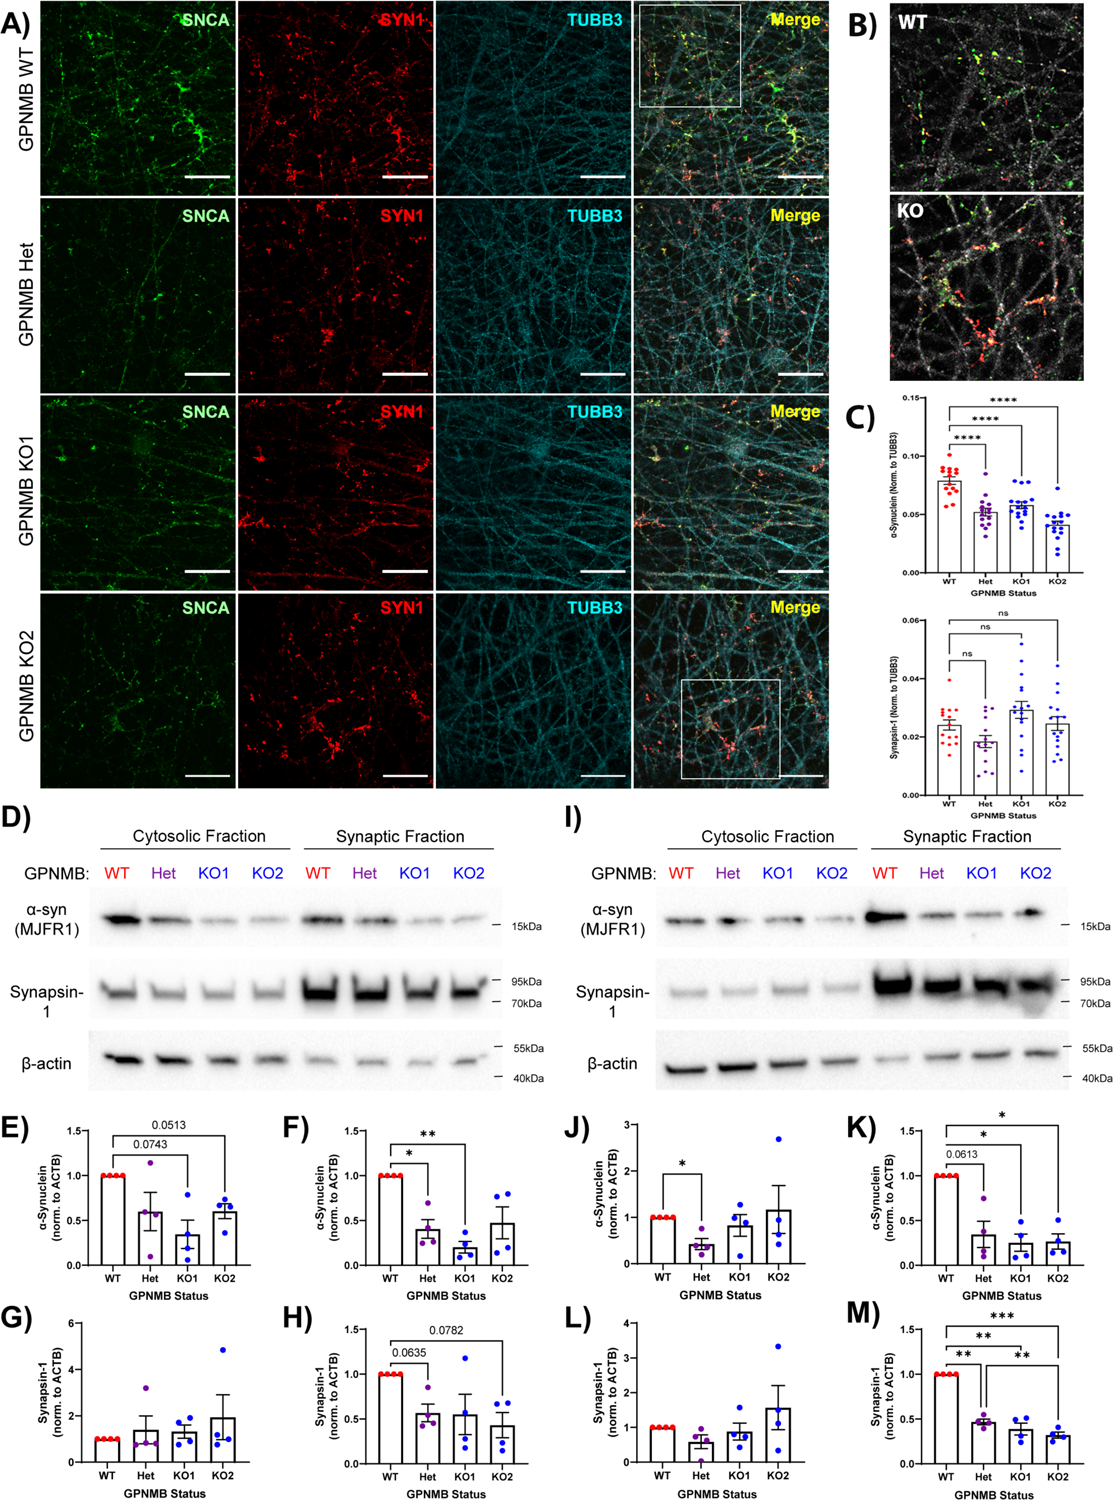
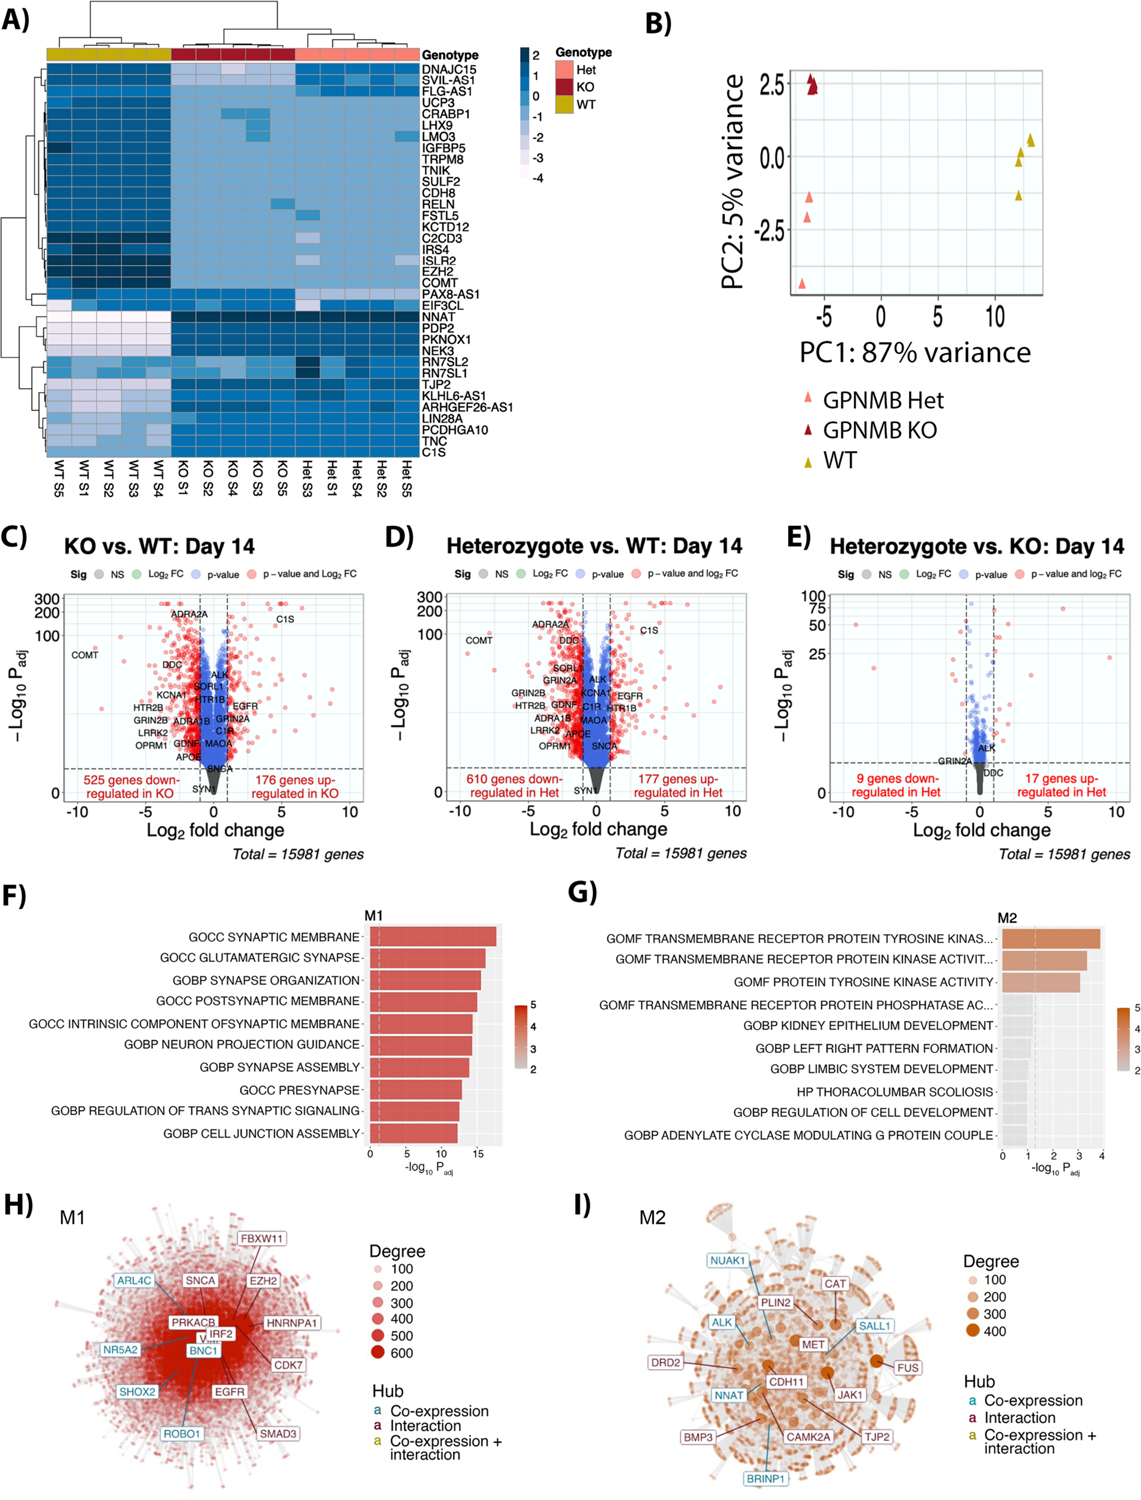
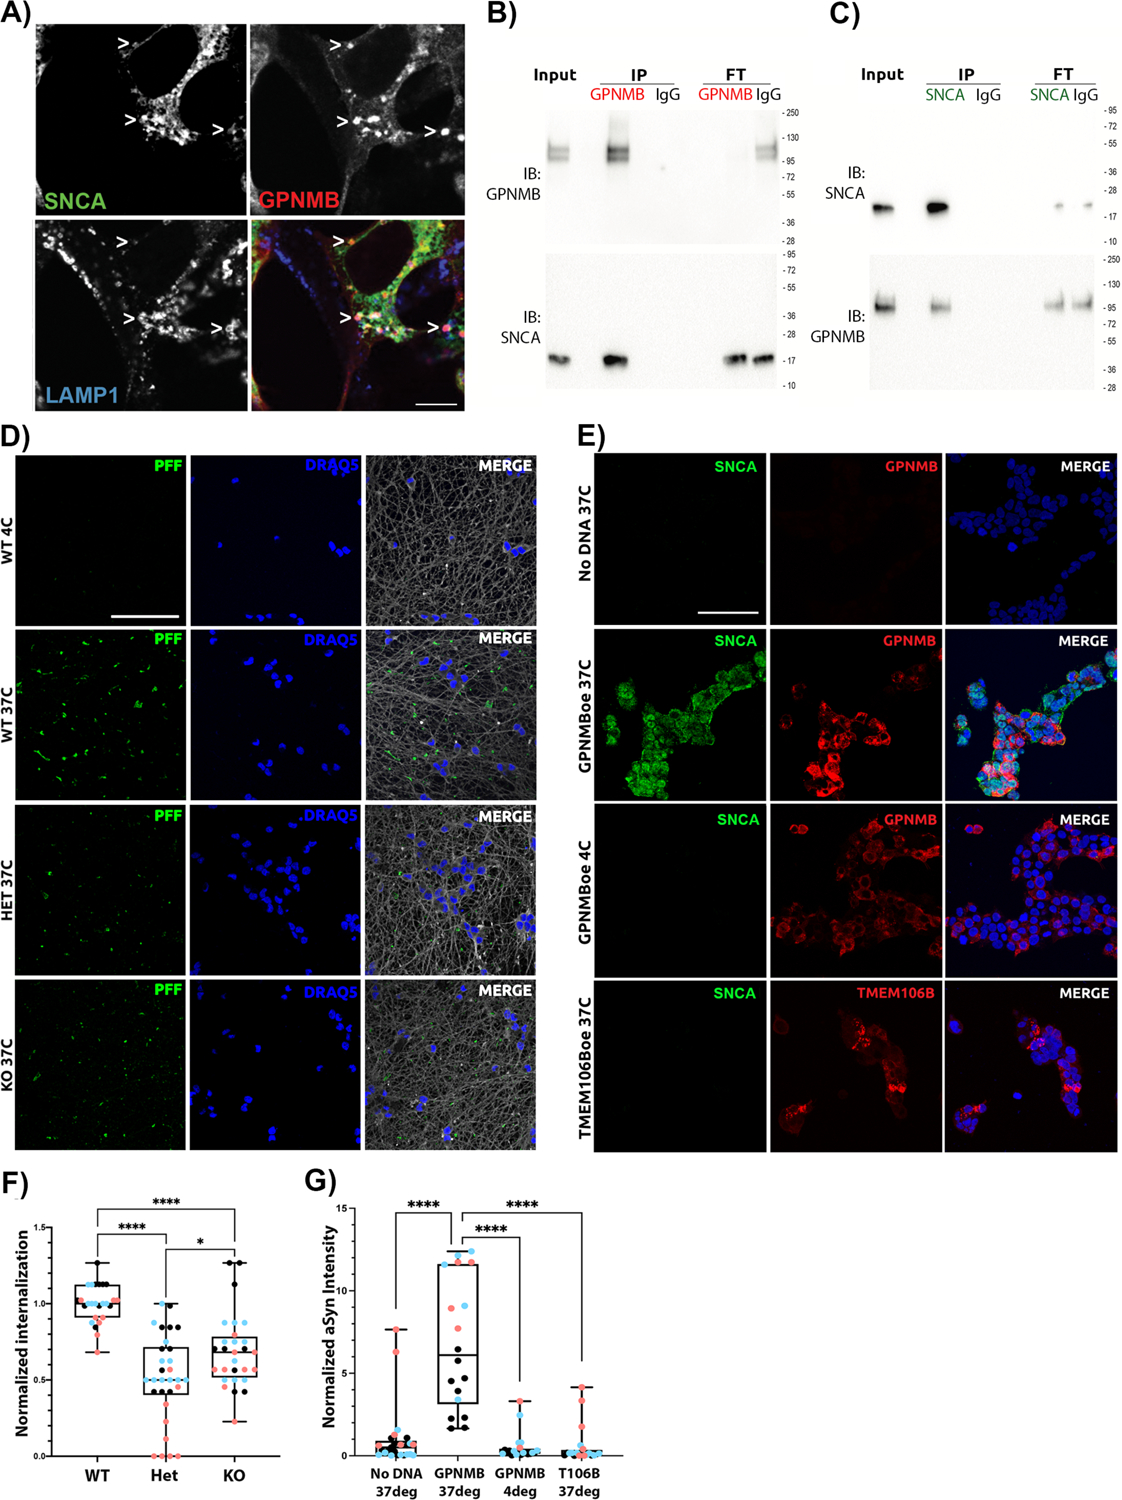
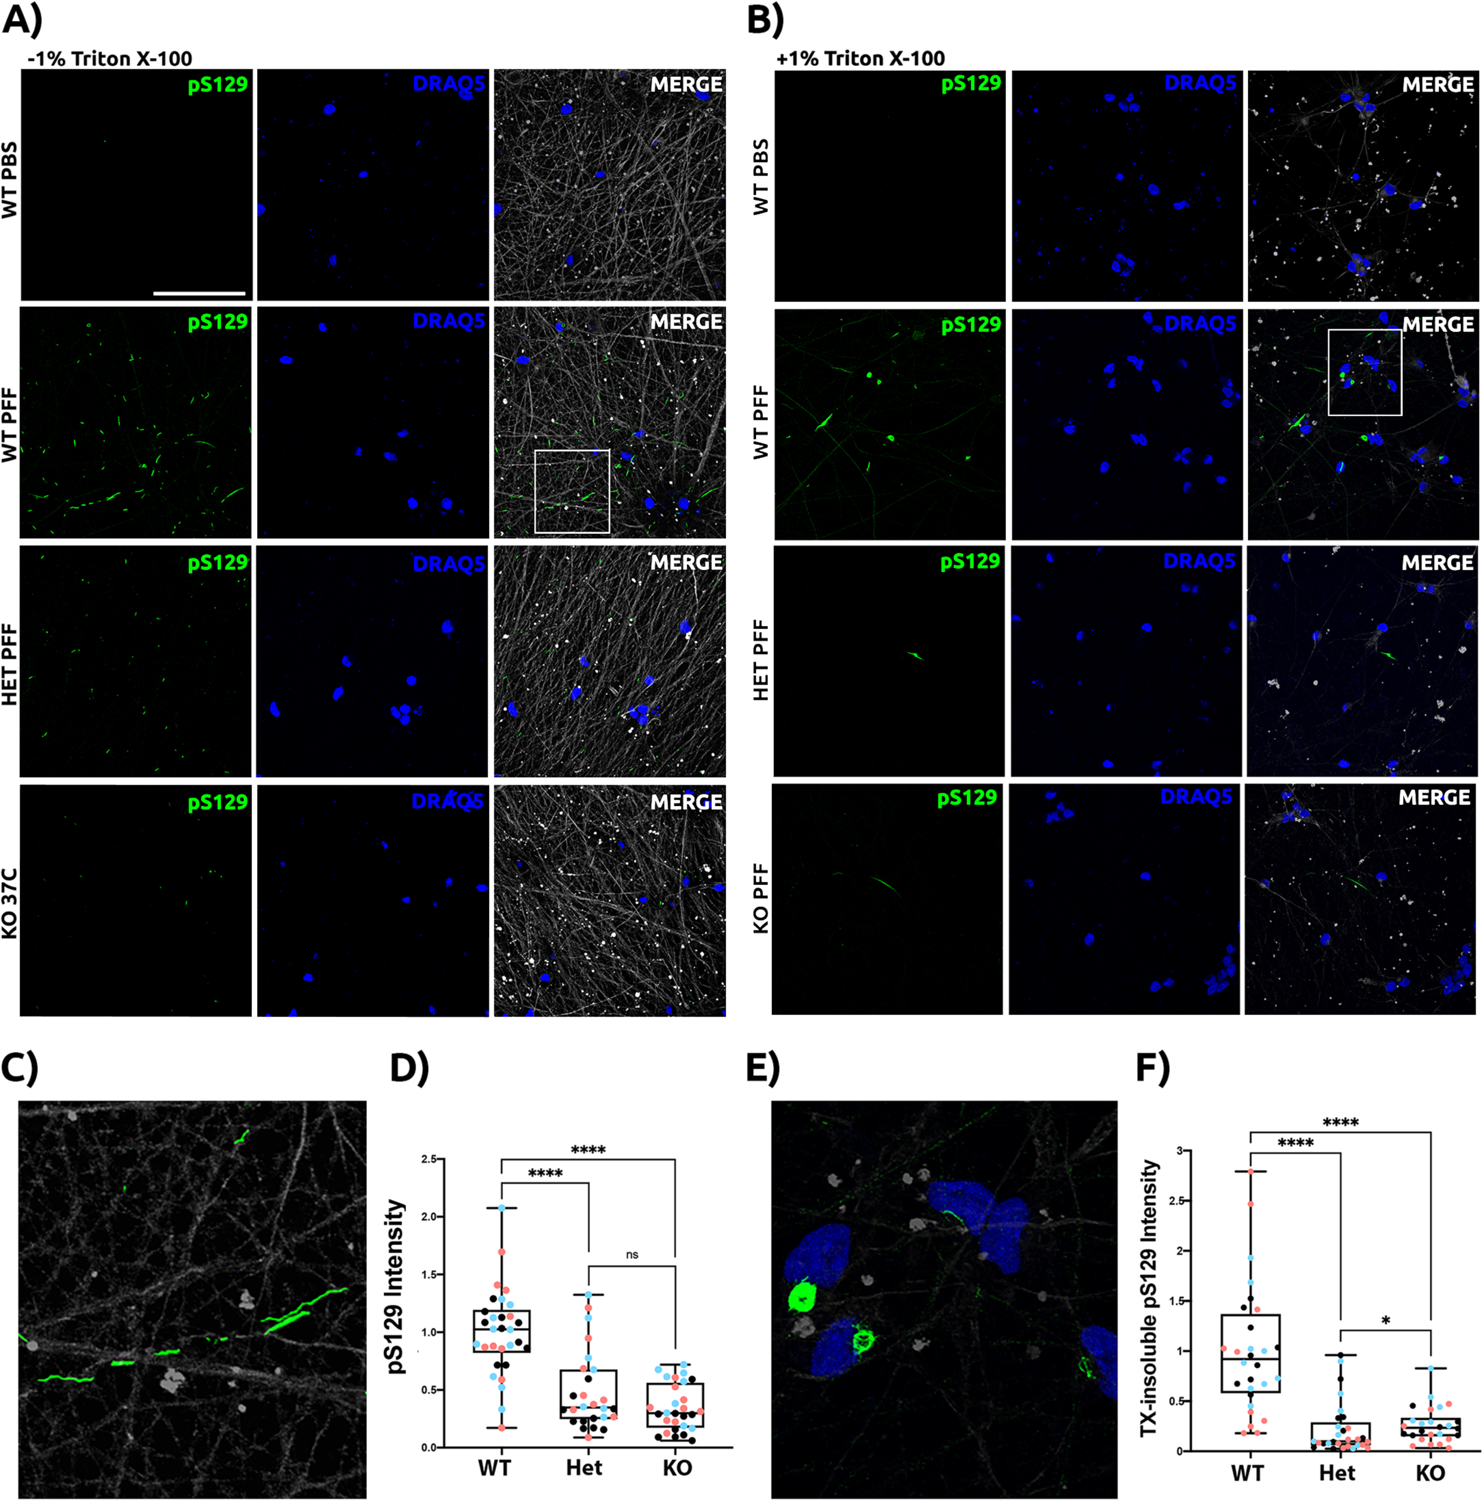
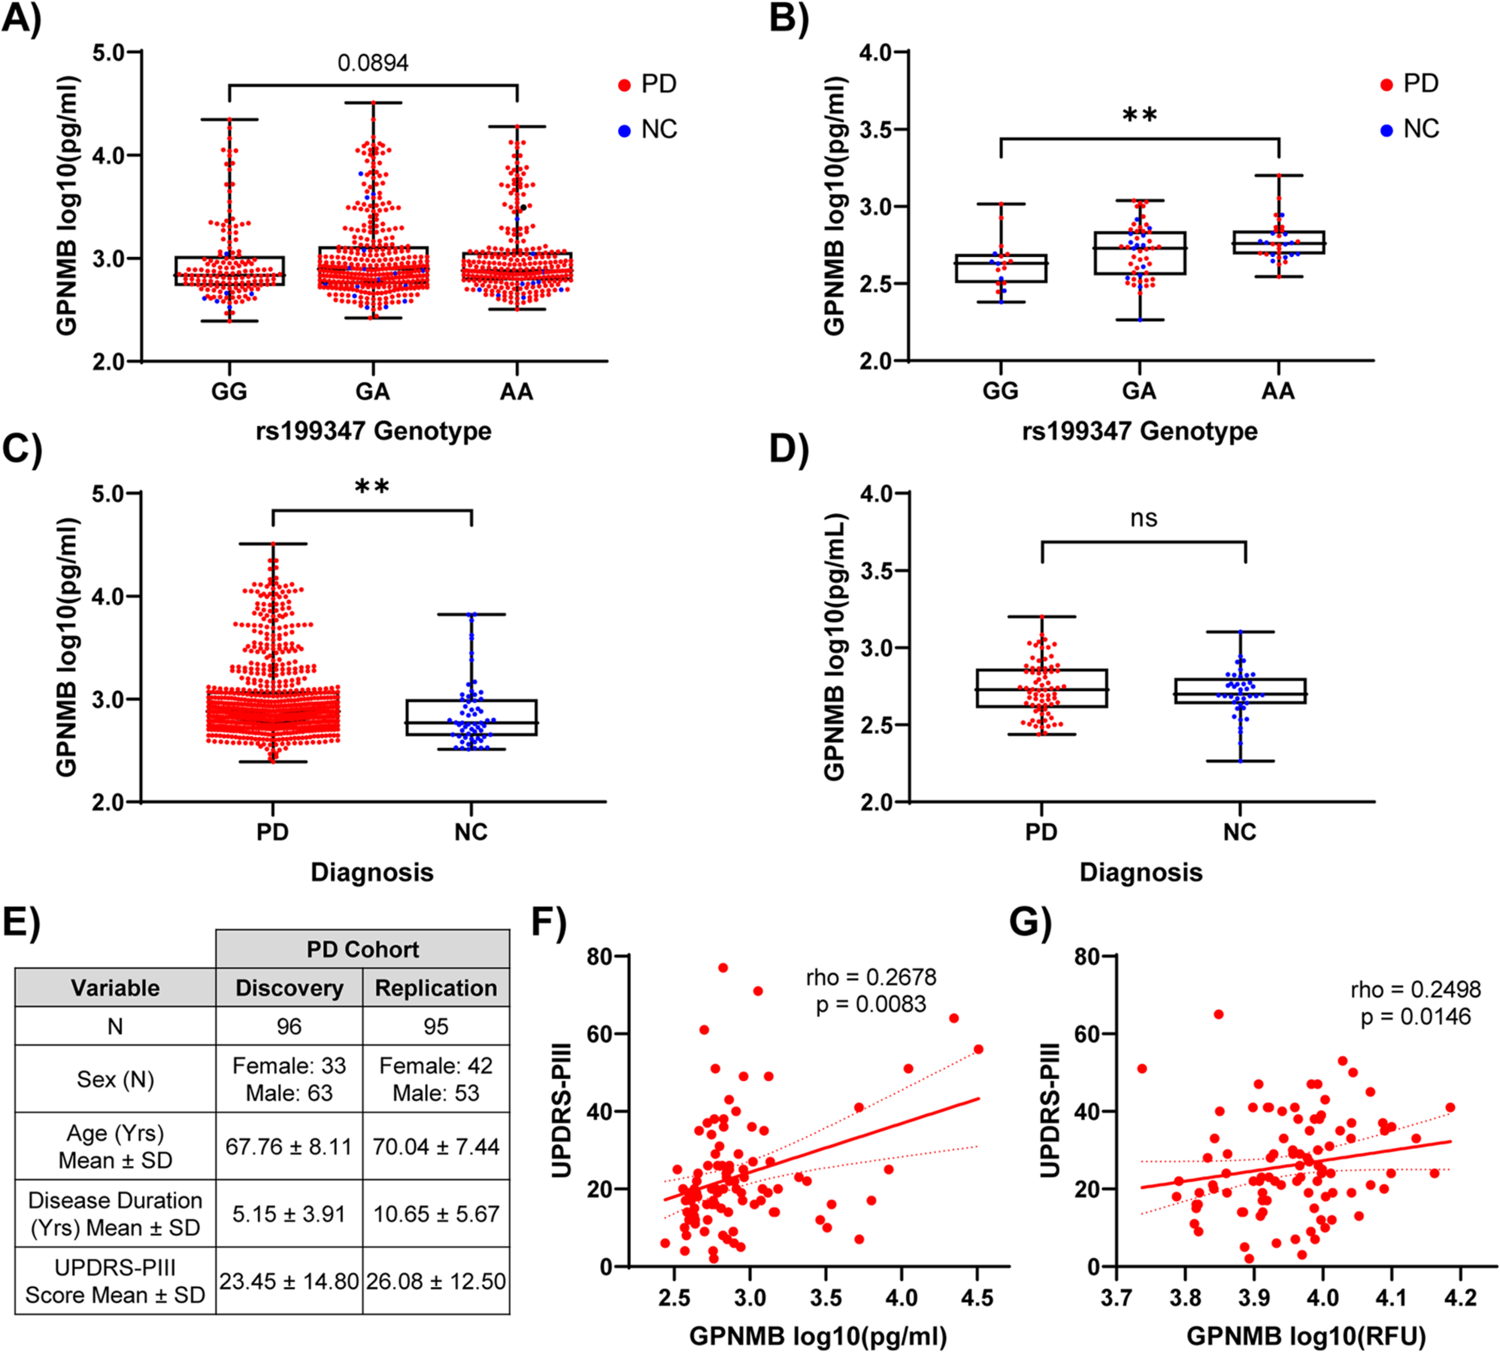
Many risk loci for Parkinson's disease (PD) have been identified by genome-wide association studies (GWASs), but target genes and mechanisms remain largely unknown. We linked the GWAS-derived chromosome 7 locus (sentinel single-nucleotide polymorphism rs199347) to GPNMB through colocalization analyses of expression quantitative trait locus and PD risk signals, confirmed by allele-specific expression studies in the human brain. In cells, glycoprotein nonmetastatic melanoma protein B (GPNMB) coimmunoprecipitated and colocalized with α-synuclein (aSyn). In induced pluripotent stem cell-derived neurons, loss of GPNMB resulted in loss of ability to internalize aSyn fibrils and develop aSyn pathology. In 731 PD and 59 control biosamples, GPNMB was elevated in PD plasma, associating with disease severity. Thus, GPNMB represents a PD risk gene with potential for biomarker development and therapeutic targeting.


Conflict of interest statement

Competing interests:

MDO, YS, and ACP are the inventors of a provisional patent submitted by the University of Pennsylvania that relates to targeting GPNMB as a potential therapeutic in Parkinson’s disease.

Figures

Fig. 1.
Fig. 1.. Chromosome 7 PD risk locus is a multi-tissue GPNMB eQTL and shows allele-specific expression (ASE).
(A) GTEx normalized expression size (NES) coefficients for rs199347’s effect on GPNMB expression in various tissues (10). Red indicates whole blood, yellow and orange indicate brain regions. Orange bars correspond to brain regions analyzed for ASE. The PD risk allele at rs199347 (allele = A) is uniformly associated with higher GPNMB mRNA expression. (B) Workflow for ASE experiment in brain samples from PD patients (n = 4) and neurologically normal controls (NC, n = 2). (C) ASE analysis for rs199347 target gene candidates GPNMB and KLHL7 in caudate, cerebellum, and cingulate cortex brain samples of PD (red) and NC (blue) individuals heterozygous at this locus. Shaded dots indicate significant (BH-adjusted p-value < 0.05) ASE, whereas empty dots do not show significant ASE. In the absence of ASE, the allelic ratio would be 0.5. For GPNMB, the allelic ratio approached 0.8, with higher expression for the GPNMB allele carrying the PD risk haplotype. (D) Immunoblots showing GPNMB expression in caudate brain lysates from NC (n=5) and PD (n=5) individuals. A 72kD band was detected by the E1Y7J antibody in all cases, with variable expression of a higher-molecular weight glycosylated form. A GAPDH loading control is also shown. (E) Representative immunohistochemical staining of GPNMB in NC and PD brain demonstrates expression in multiple cell types. Scale bar = 50um.
Fig. 2.
Fig. 2.. Heterozygous and homozygous loss of GPNMB results in altered α-synuclein expression and localization.
(A) Immunofluorescence imaging of α-synuclein (SNCA, green, stained with MJFR1 antibody), synapsin-1 (SYN1, red), and β-tubulin (TUBB3, cyan) in GPNMB WT, Het, KO1, and KO2 iPSC-N acquired 14 days after induction of neuronal differentiation. Scale bar = 20μm. (B) 2x magnified images of merged insets from (A) demonstrate greatly reduced localization of α-synuclein (SNCA, green) to synapses (labeled with SYN1, red) in GPNMB KO iPSC-N, compared to WT. TUBB3 converted to grey. (C) Quantification of α-synuclein (top) and synapsin-1 (bottom). N = 15 images (5 images from each of 3 wells) per condition. Mean +/− SEM, as well as individual data points, shown. Statistics = one-way ANOVA followed by post-hoc Dunnett’s test comparing all other groups to WT. ns = p > 0.05, **** p < 0.0001. (D,I) Western blots showing cytosolic and synaptosomal expression of α-synuclein, synapsin-1, and β-actin in iPSC-N lysates isolated at day 14 (D) and day 21 (I) after neuronal induction. (E-H) Quantification of D14 immunoblots for either α-synuclein (E-F) or synapsin-1 (G-H) expression in the cytosolic (E,G) or synaptosomal (F,H) fractions. (J-M) Quantification of D21 immunoblots for α-synuclein (J-K) or synapsin-1 (L-M) expression in the cytosolic (J,L) or synaptosomal (K,M) fractions. N = 4 blots per timepoint from 4 independent differentiations. Means +/− SEM, as well as individual data points, shown. Statistics = one-way ANOVA with repeated measures, followed by post-hoc Tukey test. * p < 0.05, ** p < 0.01, *** p < 0.001.
Fig. 3.
Fig. 3.. Transcriptomic profiling of iPSC-N with heterozygous or homozygous loss of GPNMB reveals altered synaptic biology.
(A) Heatmap showing clustering of iPSC-N (day 14 after neuronal induction) based on the top 35 genes. N=5 replicate samples from 3 independent neuronal differentiations per GPNMB genotype. (B) Principal component analysis (PCA) using all expressed genes. (C-E) Volcano plots for pairwise comparison of GPNMB KO cells compared to WT (C); GPNMB Het cells compared to WT (D); and GPNMB KO cells compared to Het (E). The horizontal axis indicates the log2 fold-change (log2FC) in gene expression. The vertical axis indicates the −log10 of BH-adjusted p-value (Padj), with dotted line indicating a Padj = 0.01 significance threshold. (F,G) Two co-expression modules (M1 and M2) differentiated WT iPSC-N from GPNMB Het and KO iPSC-N. The top 10 enriched pathways for M1 (F), decreased in GPNMB Het and KO iPSC-N, and M2 (G), increased in GPNMB Het and KO iPSC-N, are listed. (H,I) Network analysis of genes in modules M1 (H) and M2 (I) constructed using the GeneMANIA (25) protein-protein interaction dataset. Each point represents a gene, with edges showing protein-protein interactions or co-expression. The most connected genes, or hubs, are labeled, with teal representing co-expression hubs and maroon representing protein-protein interaction hubs.
Figure 4:
Figure 4:. GPNMB is necessary and sufficient for internalization of fibrillar alpha-synuclein.
(A) Immunofluorescence images of HeLa cells transfected with GPNMB and α-synuclein (SNCA, stained with MJFR1) expression constructs shows colocalization between GPNMB (AF2550 antibody) and SNCA in LAMP1+ vesicles. Scale bar = 7.5μm. (B) HeLa cells over-expressing GPNMB and SNCA were IP’d for GPNMB, showing co-IP of SNCA (bottom, MJFR1); or (C) IP’d for SNCA, showing co-IP of GPNMB (bottom, AF2550). Bi-directional co-IP of GPNMB and SNCA was confirmed 8 times total (4 replicate IP experiments from each direction). GPNMB appears as 1–2 bands that collapse to the predicted molecular weight upon deglycosylation (see Figure S2). 1:10:1 Input:IP:FT (Flow-through) for protein loading on immunoblots. (D) Representative images of Alexa Fluor 594 (AF594)-labeled human α-synuclein pre-formed fibrils (PFFs) internalized in iPSC-N (DIV14). All experiments were started at 4°C to allow for addition of PFF in the absence of active uptake. Cells were then maintained at 4°C (top row: negative control) or warmed to 37°C for 90 min to permit uptake (WT, GPNMB Het, and GPNMB KO shown in rows 2, 3, and 4, respectively). Monochrome images were captured by confocal microscopy, then converted to color for visualization using FIJI software. In each case, PFFs are shown in green, nuclei are shown in blue, and β-tubulin (neuronal structural marker) is shown in grey. Scale bar = 50μm. Only wild-type (WT) iPSC-N demonstrate definite uptake of α-synuclein PFF. (E) Representative images of HEK293 cells, a human cell line that does not internalize α-synuclein PFF at baseline (top row: negative control). Over-expression of GPNMB (red, stained with D9 antibody) enables internalization of human WT PFFs (SNCA, green, stained with MJFR1 antibody) at 37°C (row 2). However, no internalization is observed when GPNMB-over-expressing cells are maintained at 4°C (row 3), or at 37°C when another protein (TMEM106B) is over-expressed in HEK293 cells (row 4, TMEM106B is shown in red for this row only, FLAG tag stained). Monochrome images were captured by confocal microscopy, then processed using FIJI imaging software. Nuclei are shown in blue. Scale bar = 50μm. (F) Quantification of α-synuclein PFF uptake in iPSC-N lines. N=30 images from 3 independent differentiations (blue, pink, and black dots) per iPSC-N line. Groups compared by Mann-Whitney test. * p < 0.05, **** p < 0.0001. (G) Quantification of α-synuclein PFF uptake in HEK293 cells. N=30 images from 3 independent transfections (blue, pink, and black dots) per condition. Groups compared by Mann-Whitney test. **** p < 0.0001. For F and G, boxplot depicts median, 25th, 75th quartiles, while whiskers are full range.
Figure 5:
Figure 5:. GPNMB is necessary for development of a-Syn pathology in iPSC-N.
Untagged human aSyn PFF were added to iPSC-N at DIV14. Neuronal cultures were maintained for 14 additional days to allow for development of aSyn pathology before cells were washed, fixed, and stained under conditions without 1% Triton X-100 (TX) extraction (A) or after extraction of soluble proteins with 1% TX (B). 81a antibody against aSyn phospho-Ser129 (pS129) was used to stain pathology (green). Neurons were also stained for nuclear DNA (blue) and tubulin (grey), although this structural protein was largely removed under 1% TX extraction conditions. Scale bar = 50um. For each set, a negative control condition without addition of aSyn PFF is shown in the top row, followed by addition of aSyn PFF in WT (row 2), GPNMB Het (row 3), and GPNMB KO (row 4) iPSC-N. Only the WT iPSC-N demonstrate abundant pS129 staining. Moreover, the pS129 staining shows a neuritic pattern (C, inset from panel A) in the absence of 1% TX extraction and a dense perinuclear aggregate pattern (E, inset from panel B) after extraction of soluble proteins, only in the WT iPSC-N. Quantification of pS129 pathology scores is shown under conditions without 1% TX (D) and after extraction of soluble proteins with 1% TX (F). N=30 images from 3 independent differentiations (shown as blue, pink, and black dots) per line. Boxplots depict median, 25th, 75th quartiles, while whiskers are full range. Groups were compared by Mann-Whitney test. **** p < 0.0001, * p > 0.05.
Fig. 6.
Fig. 6.. Biofluid GPNMB protein levels associate with rs199347 genotype, PD diagnosis, and disease severity.
(A) Plasma and (B) CSF GPNMB levels grouped by rs199347 genotype. Genotypes compared with Kruskal-Wallis test, followed by post-hoc Dunn’s test. ** p < 0.01. (C) Plasma and (D) CSF GPNMB levels grouped by diagnosis. PD (red) vs. neurologically normal controls (NC, blue) compared by Mann-Whitney test. Boxplots depict median, 25th, 75th quartiles, while whiskers are full range. ** p < 0.01. (E) Demographics for discovery and replication cohorts used for UPDRS-PIII analysis. (F-G) Scatterplots showing positive correlation between UPDRS-PIII scores and plasma GPNMB values in discovery (F) and replication (G) cohorts. Spearman’s rho and p-value displayed in text.

Comment in

References

    1. Dorsey ER, Constantinescu R, Thompson JP, Biglan KM, Holloway RG, Kieburtz K, Marshall FJ, Ravina BM, Schifitto G, Siderowf A, Tanner CM, Projected number of people with Parkinson disease in the most populous nations, 2005 through 2030. Neurology. 68, 384 (2007). - PubMed
    1. Nalls MA, Blauwendraat C, Vallerga CL, Heilbron K, Bandres-Ciga S, Chang D, Tan M, Kia DA, Noyce AJ, Xue A, Bras J, Young E, von Coelln R, Simón-Sánchez J, Schulte C, Sharma M, Krohn L, Pihlstrøm L, Siitonen A, Iwaki H, Leonard H, Faghri F, Gibbs JR, Hernandez DG, Scholz SW, Botia JA, Martinez M, Corvol J-C, Lesage S, Jankovic J, Shulman LM, Sutherland M, Tienari P, Majamaa K, Toft M, Andreassen OA, Bangale T, Brice A, Yang J, Gan-Or Z, Gasser T, Heutink P, Shulman JM, Wood NW, Hinds DA, Hardy JA, Morris HR, Gratten P. M. Visscher, Graham RR, Singleton AB, 23andMe Research Team, System Genomics of Parkinson’s Disease Consortium, International Parkinson’s Disease Genomics Consortium, Identification of novel risk loci, causal insights, and heritable risk for Parkinson’s disease: a meta-analysis of genome-wide association studies. The Lancet Neurology. 18, 1091–1102 (2019). - PMC - PubMed
    1. McFarthing K, Simuni T, Clinical Trial Highlights: Targeting Alpha-Synuclein. Journal of Parkinson’s Disease. 9, 5–16 (2019). - PubMed
    1. Schneider SA, Alcalay RN, Precision medicine in Parkinson’s disease: emerging treatments for genetic Parkinson’s disease. Journal of Neurology. 267, 860–869 (2020). - PMC - PubMed
    1. Chang D, Nalls MA, Hallgrímsdóttir IB, Hunkapiller J, van der Brug M, Cai F, Kerchner GA, Ayalon G, Bingol B, Sheng M, Hinds D, Behrens TW, Singleton AB, Bhangale TR, Graham RR, I. P. D. G. Consortium, 23andMe Research Team, A meta-analysis of genome-wide association studies identifies 17 new Parkinson’s disease risk loci. Nature Genetics. 49, 1511–1516 (2017). - PMC - PubMed

Supplementary References for Materials and Methods:

    1. Chen-Plotkin AS, Geser F, Plotkin JB, Clark CM, Kwong LK, Yuan W, Grossman M, van Deerlin VM, Trojanowski JQ, Lee VM-Y, Variations in the progranulin gene affect global gene expression in frontotemporal lobar degeneration. Human Molecular Genetics. 17, 1349–1362 (2008). - PMC - PubMed
    1. Toledo JB, van Deerlin VM, Lee EB, Suh E, Baek Y, Robinson JL, Xie SX, McBride J, Wood EM, Schuck T, Irwin DJ, Gross RG, Hurtig H, McCluskey L, Elman L, Karlawish J, Schellenberg G, Chen-Plotkin A, Wolk D, Grossman M, Arnold SE, Shaw LM, Lee VM-Y, Trojanowski JQ, A platform for discovery: The University of Pennsylvania Integrated Neurodegenerative Disease Biobank. Alzheimer’s & Dementia. 10, 477–484.e1 (2014). - PMC - PubMed
    1. Andrews S, FastQC: A Quality Control Tool for High Throughput Sequence Data [online] (2010), (available at http://www.bioinformatics.babraham.ac.uk/projects/fastqc/).
    1. Bolger AM, Lohse M, Usadel B, Trimmomatic: a flexible trimmer for Illumina sequence data. Bioinformatics. 30, 2114–2120 (2014). - PMC - PubMed
    1. Dobin A, Gingeras TR, in Data Mining Techniques for the Life Sciences, Carugo O, Eisenhaber F, Eds. (Springer New York, New York, NY, 2016; 10.1007/978-1-4939-3572-7_13), pp. 245–262. - DOI

MeSH terms