. 2022 Sep 9;377(6611):1180-1191.
doi: 10.1126/science.abn0478. Epub 2022 Aug 18.

Lineage plasticity in prostate cancer depends on JAK/STAT inflammatory signaling

Affiliations

Lineage plasticity in prostate cancer depends on JAK/STAT inflammatory signaling

Joseph M Chan et al. Science. .

Abstract

Drug resistance in cancer is often linked to changes in tumor cell state or lineage, but the molecular mechanisms driving this plasticity remain unclear. Using murine organoid and genetically engineered mouse models, we investigated the causes of lineage plasticity in prostate cancer and its relationship to antiandrogen resistance. We found that plasticity initiates in an epithelial population defined by mixed luminal-basal phenotype and that it depends on increased Janus kinase (JAK) and fibroblast growth factor receptor (FGFR) activity. Organoid cultures from patients with castration-resistant disease harboring mixed-lineage cells reproduce the dependency observed in mice by up-regulating luminal gene expression upon JAK and FGFR inhibitor treatment. Single-cell analysis confirms the presence of mixed-lineage cells with increased JAK/STAT (signal transducer and activator of transcription) and FGFR signaling in a subset of patients with metastatic disease, with implications for stratifying patients for clinical trials.


Figures
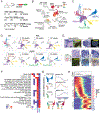
Figure 1.
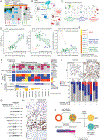
Figure 1.. Inflammatory JAK/STAT Signals Emerge in Adenocarcinoma Prior to Transition to NEPC in GEMMs.
A) Experimental design includes WT (9 mice), PtR (7 mice, PbCre:Rosa26mT/mGPtenfl/flRb1fl/fl), and PtRP (13 mice, PbCre: Rosa26mT/mGPtenfl/flRb1fl/flTp53fl/fl) at labeled time points. Timepoints for WT included 8 (1 mouse), 12 (2 mice), 24 (3 mice) and 32 (3 mice) weeks; for PtR were 24 (3 mice), 30 (2 mice), and 47 (2 mice) weeks; and for PtRP were 8 (1 mouse), 9 (1 mouse), 12 (4 mice), and 16 (1 mice) weeks relevant to the adenocarcinoma to neuroendocrine transition (4-6). Furthermore, six PtRP mice were castrated at 8 weeks of age for either a total of 4 weeks (3 mice, ‘Cas’), or 2 weeks followed by 2 weeks of dihydrotestosterone (DHT, ‘Cas/Reg’) addback (3 mice). B) UMAP of GEMMs (N=67,622 cells) shown for all cell types based on imputed Gfp expression (restricted to non–immune cells) as a marker for mutant cells (Methods). Abbreviations include B (basal), L1 (luminal 1), L2 (luminal 2), SV (seminal vesicles), Adeno (adenocarcinoma), Vim-Gfp (Vimentin-Gfp), NEPC (neuroendocrine prostate cancer). C) Force–directed layout (FDL) of mutant Gfp–positive and wild–type (WT) cells (N=28,934) colored by cell type. WT includes luminal 1 (L1), luminal 2 (L2), and basal (B). Mutant cell types include adenocarcinoma (Adeno), Tff3-Gfp, Pou2f3-Gfp, Vimentin-Gfp (Vim-Gfp), neuroendocrine prostate cancer (NEPC). D) FDLs separated by genotype and timepoint, colored by cell type. Top left: WT with N=7,435 cells. Top: PtRP 24/30/47 weeks with N=2,565/662/1,441 cells. Bottom: PtRP 8/9/12/16 weeks with N=981/353/4,984/569 cells. E) Hematoxylin/eosin and multiplex immunofluorescence (mIF) (40x) of mutant subtypes, including adenocarcinoma to NEPC transition, NEPC, and VIM. mIF channels include GFP (mG, green), DAPI (nuclei, blue), VIM (mesenchymal, red), SYP (synaptophysin, purple), and E–CAD (e–cadherin, white). Also shown are hematoxylin/eosin and immunohistochemistry (IHC) of TFF3– and POU2F3–positive cells in mutant tissue. Scale bars represent 100 μm or 50 μm as noted. F) Heatmap of significantly enriched gene sets per cell type, restricted to wildtype epithelial (Basal/B, Luminal 1/L1, Luminal 2/L2), adenocarcinoma (Adeno), and neuroendocrine (NEPC) cells (FDR<0.01, abs(NES) > 1 where NES is the normalized enrichment score, see Methods). G) Dissecting the adenocarcinoma to NEPC transition. Left: FDL of mutant adenocarcinoma (subsetted to adeno–B and adeno–L2) and NEPCs cells from the PtR model (N=16,593 cells) colored by genotype and time. Bottom: FDLs colored by normalized log2(X+1) expression of Cdkn2a or pseudotime scaled from 0 to 1. Right: Gene trends for TF DEGs across the adenocarcinoma to NEPC branch probability were calculated using a generalized additive model, with cubic splines across 500 equally sized bins (solid = mean, dashed = standard deviation) (25). Gene trends were grouped by Phenograph cluster (k=30) (Methods). H) Transcription factors (TFs) groups include adenocarcinoma (purple), putative transition (red), and NEPC (blue). Heatmap of gene trends of select TF DEGs (Phenograph cluster versus rest within PtRP, refer to Methods: ‘Identifying DEGs’) from each category are ordered by the putative transition from adenocarcinoma to NEPC, with gene labels colored by aforementioned groups (scale gene trends of imputed expression, −0.5 to 1.5). Top panel shows a spline fit of the average Z-score of JAK/STAT and androgen signaling (NELSON_ANDROGEN_SIGNALING_UP) (Methods).
Figure 2.
Figure 2.. Establishment of an organoid model of spontaneous lineage plasticity
A) Upper: Representative brightfield pictures of the various organoid phenotypes prior to and 4,6,8 and 10 weeks post Tp53 and Rb1 loss. Lower: Schematic representation of lineage plasticity development in Tp53Δ/Δ Rb1Δ/Δ organoids. Scale bar represents 50 μm. B) Left: Representative H&E staining of LentiCre Tp53Δ/Δ Rb1Δ/Δ organoids ~10 weeks post deletion with cystic (A, blue), Hyperplastic (B, red) and slithering (C, silver) phenotypes. Right: Bargraph with percentage of organoids with given phenotypes during the time course. Scale bar represents 100 μm. C) Westernblot verification of differentially expressed genes identified in RNA-seq data in wild-type (Tp53loxP/loxP Rb1loxP/loxP organoids, left) and ~10 weeks post deletion (LentiCre Tp53Δ/Δ Rb1Δ/Δ organoids, right). Proteins as marked. Actin was used as loading control. Fold change in protein level determined with ImageJ is given on the right. D) Representative IHC of basal markers (p63, Ck5), luminal marker (Ck8) and Ar in wild-type (Tp53loxP/loxP Rb1loxP/loxP organoids, left) and ~10 weeks post deletion (LentiCre Tp53Δ/Δ Rb1Δ/Δ organoids, right). Scale bars represent 100 μm. E) Volcano plot showing differentially expressed genes (DEGs) in the mutant organoid compared to wild-type. Blue lines indicate thresholds for significant DEGs (Bonferroni-adjusted p-value < 0.001, abs(log2 fold change) > 1). Red labels: significant DEGs of interest. F) Lollipop plot showing significantly enriched pathways in RB1/TP53-deleted organoids vs wild-type using bulk RNA-seq based on GSEA (Benjamini-Hochberg adjusted p-value < 0.15; abs(NES) > 1)), where NES is normalized enrichment score (red = enriched in mutant; blue = enriched in wildtype). Lollipop size corresponds to significance, or −log2(p-value). G) Westernblot of total Stat1 and Stat 3 levels and phosphorylated (p-) Stat1 and p-Stat3 in LentiCre Tp53Δ/Δ Rb1Δ/Δ organoids treated with increasing doses of the JAK1/JAK2 inhibitor Ruxolitinib for 48 hours. Actin was used as loading control. H) Schematic representation of single cell cloning experiment of Basal (CD49f+) and Luminal (CD24+) cells. Organoids harboring a Cre recombinase inducible Cas9 (Rosa26 lsl-Cas9 (32)) were transduced with guide RNA’s targeting Tp53 and Rb1 (LentiGuide Puro, guide sequences, Table S23). Basal and luminal cells were sorted based on CD49f+ (Basal) and CD24+ (Luminal) expression and subsequently Cas9 was activated by transduction with adenovirus expressing Cre. Approximately 1000 single cells were seeded and grown out. Nutlin-3 and Palbociclib were added 3 days post Cas9 activation to select for Tp53 and Rb1 mutant cells. 24 basal and 24 luminal clones were randomly chosen and expanded for 4 weeks. I) Quantification whole culture phenotypes (Cystic or Hyperplastic) of single-cell derived (CD49f+ or CD24+ FACS sorted) organoids after 4 weeks of culture. Left bargraph absolute number of cultures, right bargraph percentage of single-cell derived cultures in cystic or hyperplastic state.
Figure 3.
Figure 3.. Single-cell analysis of organoids reveals basal-luminal mixing, used as a proxy measure for plasticity to identify associated inflammation, JAK/STAT, and FGFR pathway activation.
A) Experimental design of organoid sequencing time-course. Samples collected at weeks 0, 2, 4, and 8 are enzymatically digested and subjected to scRNA-seq. Samples from weeks 4 and 8 are collected with or without enzalutamide (ENZ) treatment. B) Force-directed layout (FDL) of wild-type basal and luminal SEACell metacells (N=142), labeled by wild-type subpopulations determined by Phenograph clusters. Edges between metacells indicate the k-nearest neighbors (k = 6) (Methods). C) Mean log2(X+1) expression of differentially expressed genes in each basal and luminal subpopulation in the wild-type organoid. D) FDL (k=10) of metacells in the prostate organoid before and after RB1/TP53 deletion (N=884), annotated by either wild-type subpopulations or by time and treatment following mutation. E) Contour plots of basal and luminal cell densities at each timepoint, depicting a convergence of cell identities after mutation (Methods). Single cells are plotted using mean Z-scores of the set of basal genes that are gained in mutant luminal cells (y-axis), and the set of luminal genes that are gained in mutant basal cells (x-axis). Basal cell, red; luminal cells, blue; wild-type (WT), light colors; RB1/TP53-mutant (MUT), dark colors. Samples were collected at Week 0 (N=2,629), 2 (N=1,904), 4 (N=2,554), 8 (N=2,690), 4+ENZ (N=2,850), and 8+ENZ (N=3,050). Gene imputation is performed using MAGIC (k=30; t=3) prior to Z-score. See Fig S9A for a corresponding version without gene imputation. F) Mean Euclidean distance between matched basal and luminal cells, based on the Linear Sum Assignment Problem (LSAP). Mean distances within each timepoint are an inverse measure of plasticity, which increases with time and treatment. G) Top pathways significantly enriched for plasticity across timepoints (using GSEA, Bonferroni-adjusted p<0.01, NES > 1; see Fig S10C, Table S14). Each pathway score is measured as the average Z-score of gene expression in each pathway among metacells. Rows (pathways) are ordered by increasing pathway score from bottom to top in the early timepoint at week 2. Red asterisks indicate pathways also enriched in ENZ-treated compared to untreated samples (Methods). H) Cellular plasticity increases as a function of JAK/STAT signaling. Plasticity is measured as the average entropy of cell-type classification probabilities per metacell. JAK/STAT score is the average Z-score of the leading-edge gene subset of KEGG_JAK_STAT_SIGNALING_PATHWAY and HALLMARK_IL6_JAK_STAT3_SIGNALING. The entropy of classification probabilities was first calculated for each single cell and then averaged per metacell for visualization. A linear fit is shown with Pearson’s correlation of 0.76. I) Top scoring ligand-receptor (L-R) interactions known to activate JAK/STAT signaling, based on adjusted R2 (Radj2) of the regression JAK_STAT ~ L + R + L:R, where JAK_STAT is the JAK/STAT signaling score, and L and R represent scaled imputed ligand and receptor expression (Methods). Only L-R pairs with non-zero Radj2 are shown. J) Mean expression (rows) by sample timepoint (columns) for candidate receptors activating downstream JAK/STAT signaling in metacells. Receptor genes are ordered by increasing expression in the early timepoint at week 2 from bottom to top.
Figure 4.
Figure 4.. Pharmacological inhibition of JAK-STAT signaling and FGFR signaling resensitizes prostate cancer organoids to ARSI.
A) Representative brightfield pictures, H&E staining and IHC of CK8, Ck5 and Vimentin of Tp53Δ/Δ Rb1Δ/Δ organoids treated for 14 days with indicated drugs. Scale bars represent 100 μm. B) Quantification of phenotypes cystic (Blue), Hyperplastic (Red) and slithering (Silver) of Tp53Δ/Δ Rb1Δ/Δ organoids treated for 14 days with indicated drugs, see methods for exact medium composition. C) Quantification of vimentin positivity of organoids in A. Total number of organoids positive for marker were quantified and normalized. D) Left: Western blot of lineage markers and JAK-STAT signaling components in Tp53Δ/Δ Rb1Δ/Δ organoids treated for 14 days with indicated drugs, see methods for exact medium composition. Proteins probed as indicated. Actin was used as a loading control. Right: Protein fold change or Ar, Ck8 and Vimentin as determined by ImageJ analysis in Tp53Δ/Δ Rb1Δ/Δ organoids treated for 14 days with indicated drugs. E) Top: Schematic overview of resensitization drug experiments. Organoids are treated with Erdafitinib 100 nM and Ruxolitinib 10 μM for 14 days in low Egf organoid medium (ENR+A83+DHT), control organoids were cultured in low EGF organoid medium for 14 days. Subsequently organoids (10000 cells per well, triplicate) are reseeded in organoid culture medium without EGF (NR+A83), containing an AR agonist (DHT 1 nM) or antagonist (Enzalutamide 10 μM). Viability was measured by CellTiterGlo after 7 days of Enzalutamide treatment of Tp53Δ/Δ Rb1Δ/Δ organoids treated for 14 days with indicated drugs (Lower). Results were normalized to control culture condition. See Methods for exact medium composition.
Figure 5.
Figure 5.. Activation of JAK/STAT and FGFR signaling arises in CRPC patient biopsies and patient-derived organoids.
A) Treatment–refractory metastatic castrate resistant prostate cancer (CRPC) patients underwent IR–guided biopsies. High-risk index lesions were guided by advanced molecular imaging. Mutational oncoprint labeled by sample ID (HMP; human metastatic prostate), histology (adenocarcinoma, orange; and neuroendocrine prostate cancer, yellow), and mutational status (deletion, blue; amplification, red; missense, green; stop or frameshift, black). B) UMAPs of tumor cells from patient-derived metastatic CRPC (N=27,338 cells) colored by tumor ID and grouped by tumor type. C) UMAPs of tumor cells from patient-derived metastatic CRPC, annotated by Phenograph clusters (k=30), divided into three groups defined by Z–score of JAK/STAT and FGFR, or NEPC signatures: 1) AR high and JAK/STAT+FGFR low adenocarcinoma (JAK and FGFR signature, Z-score ≤ 1, green), 2) AR low and JAK/STAT+FGFR high adenocarcinoma (JAK and FGFR signature, Z-score>1, blue), and 3) NEPC (neuroendocrine signature, Z-score>1) (Methods). D) Scatterplot of Phenograph clusters (points) based on Z-score of a combined JAK/STAT+FGFR signature (x-axis) versus EMT, AR, and NEPC signatures (y-axis), respectively. Linear fits were calculated for adenocarcinoma clusters only, with corresponding Pearson’s correlation denoted. Clusters annotated by groups definIin (C): NEPC (red), AR high and JAK/FGFR low adeno (green), and AR low and JAK/FGFR high adeno (blue) E) Proposed classification of metastatic CRPC samples based on JAK/STAT+FGFR and NEPC signatures. HMP13 is assigned to the JAK/STAT+FGFR high group, as this sample harbors a well-demarcated JAK/FGFR and EMT-high subpopulation, described in Figure S14D. F) Schema of baseline attributes and functional change in human organoids with null to low AR expression following treatment with combined Rux/Erda treatment, with hold-out sample MSKPCA2 used as reference level for AR-high subtype. 1) Baseline attributes including an oncoprint of TP53/RB1/PTEN genotype, transcriptional subtypes based on Tang, et al. (36), and low versus null AR protein expression. 2) Heatmap of baseline gene signatures in the human organoids using publicly available bulk RNA sequencing based on mean Z-scored expression of JAK/STAT signaling, FGFR signaling, and EMT gene sets (see Methods). 3) Functional changes in human organoids with null to low AR expression following treatment with Rux/Erda, including cell viability, and log2 fold change (FC) in AR and VIM protein expression. G) Western blot of lineage markers and JAK-STAT signaling components in MSKPCA3 organoid after 14 days treatment with Erdafitinib 100 nM, Ruxolitinib 10 μM or with Erdafitinib 100 nM & Ruxolitinib 10 μM combination. Proteins probed as indicated. Actin was used as loading control. H) Representative histology and IHC (CK8, CK5 and Vimentin) of MSKPCA3 organoids after 14 days treatment with Erdafitinib (100 nM) & Ruxolitinib (10 μM) combination in full organoid medium (ENRFFPN, A83-01, Nicotinamide, DHT). See methods for exact medium composition. Scale bars represent 100 μm. I) Upper: Representative staining or AR in MSKPCA11 in control treated and treatment with Erdafitinib 100 nM & Ruxolitinib 10 μM. Lower: Bar graph of AR IHC staining patterns in patient derived organoids MSKPCA3, LuCAP176, MSKPCA8, MSKPCA11 and MSKPCA12. Organoids were control treated or treated with Erdafitinib 100 nM & Ruxolitinib 10 μM. AR staining was classified as negative (Grey), Low intensity (Blue) and high intensity (Red). J) Proposed model system of lineage plasticity. JAK-STAT signaling activation and FGFR signaling activation leads to a ARlow, ARSI insensitive state that can be reprogrammed back to an ARSI sensitive state. Potentially the JAK-STAThigh, ARlow, ARSI insensitive state is a cellular state preceding AR negative ARSI insensitive CRPC. Mechanisms leading to AR-negative CRPC are unknown.

Comment in

References

    1. V Sequist L, Waltman BA, Dias-Santagata D, Digumarthy S, Turke AB, Fidias P, Bergethon K, Shaw AT, Gettinger S, Cosper AK, Akhavanfard S, Heist RS, Temel J, Christensen JG, Wain JC, Lynch TJ, Vernovsky K, Mark EJ, Lanuti M, Iafrate AJ, Mino-Kenudson M, Engelman JA, Genotypic and histological evolution of lung cancers acquiring resistance to EGFR inhibitors. Sci Transl Med. 3, 75ra26 (2011). - PMC - PubMed
    1. Awad MM, Liu S, Rybkin II, Arbour KC, Dilly J, Zhu VW, Johnson ML, Heist RS, Patil T, Riely GJ, Jacobson JO, Yang X, Persky NS, Root DE, Lowder KE, Feng H, Zhang SS, Haigis KM, Hung YP, Sholl LM, Wolpin BM, Wiese J, Christiansen J, Lee J, Schrock AB, Lim LP, Garg K, Li M, Engstrom LD, Waters L, Lawson JD, Olson P, Lito P, Ou S-HI, Christensen JG, Jänne PA, Aguirre AJ, Acquired Resistance to KRAS G12C Inhibition in Cancer . New England Journal of Medicine. 384, 2382–2393 (2021). - PMC - PubMed
    1. Watson PA, Arora VK, Sawyers CL, Emerging mechanisms of resistance to androgen receptor inhibitors in prostate cancer. Nature Reviews Cancer. 15, 701–711 (2015). - PMC - PubMed
    1. Bluemn EG, Coleman IM, Lucas JM, Coleman RT, Hernandez-Lopez S, Tharakan R, Bianchi-Frias D, Dumpit RF, Kaipainen A, Corella AN, Yang YC, Nyquist MD, Mostaghel E, Hsieh AC, Zhang X, Corey E, Brown LG, Nguyen HM, Pienta K, Ittmann M, Schweizer M, True LD, Wise D, Rennie PS, Vessella RL, Morrissey C, Nelson PS, Androgen Receptor Pathway-Independent Prostate Cancer Is Sustained through FGF Signaling. Cancer Cell. 32, 474–489.e6 (2017). - PMC - PubMed
    1. Quintanal-Villalonga Á, Chan JM, Yu HA, Pe’er D, Sawyers CL, Sen T, Rudin CM, Lineage plasticity in cancer: a shared pathway of therapeutic resistance. Nature Reviews Clinical Oncology. 17, 360–371 (2020). - PMC - PubMed