. 2022 Sep 21;13(9):690-710.e17.
doi: 10.1016/j.cels.2022.07.006. Epub 2022 Aug 17.

Archetype tasks link intratumoral heterogeneity to plasticity and cancer hallmarks in small cell lung cancer

Affiliations

Archetype tasks link intratumoral heterogeneity to plasticity and cancer hallmarks in small cell lung cancer

Sarah M Groves et al. Cell Syst. .

Abstract

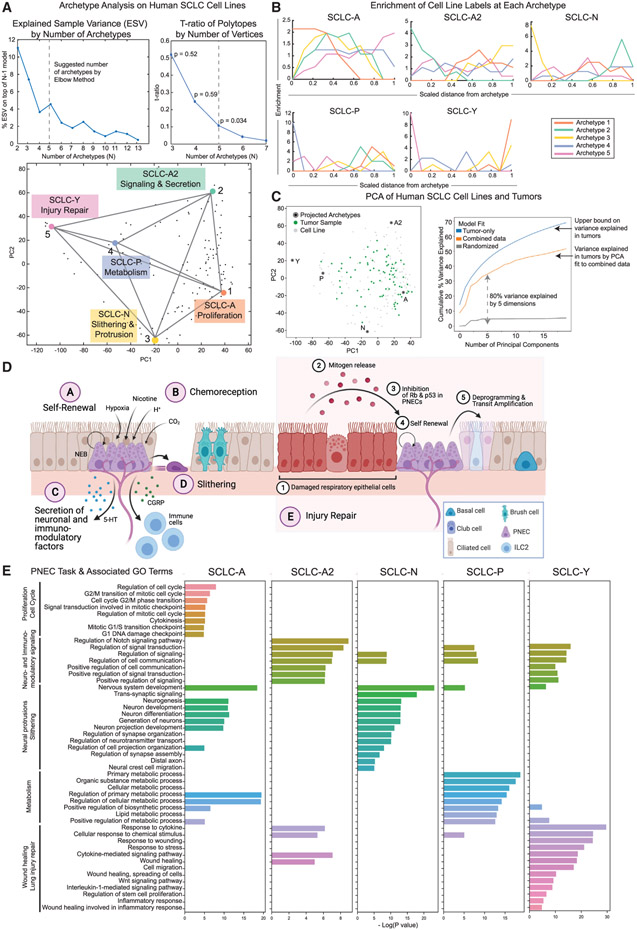
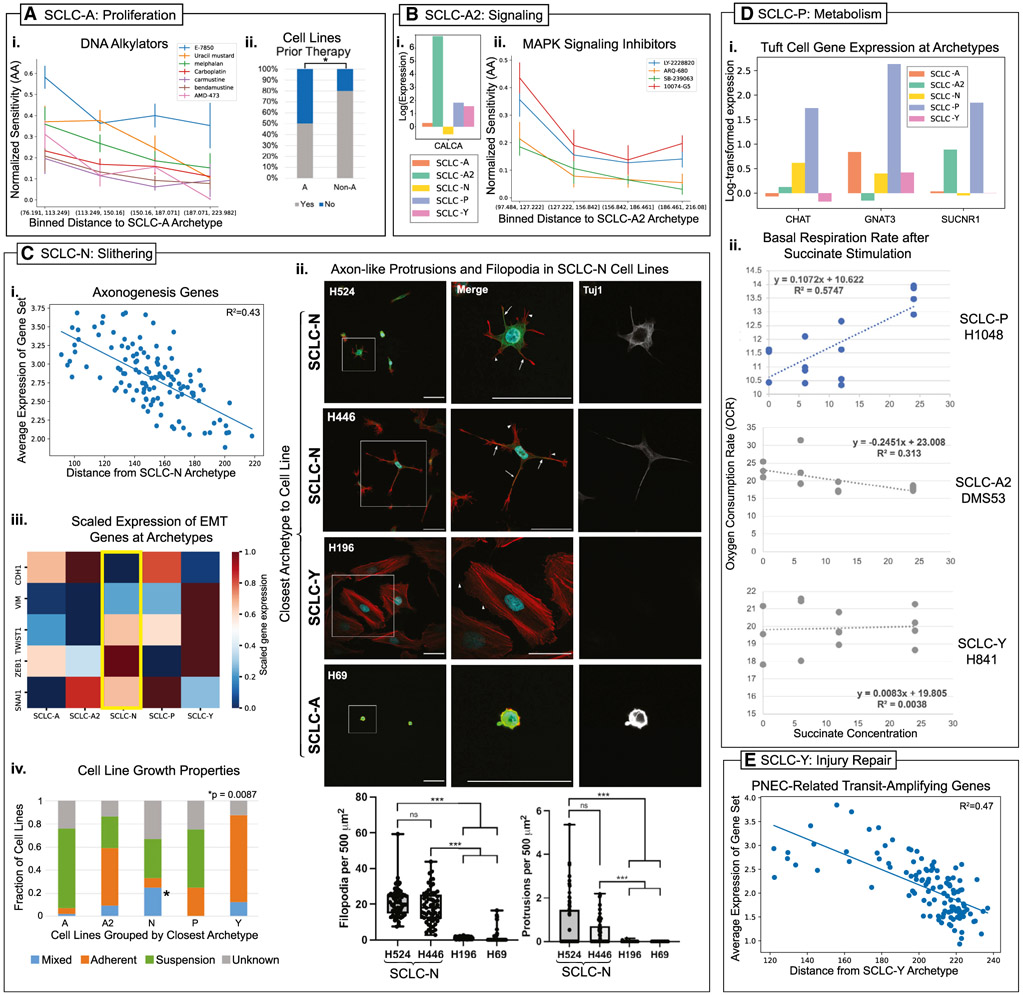
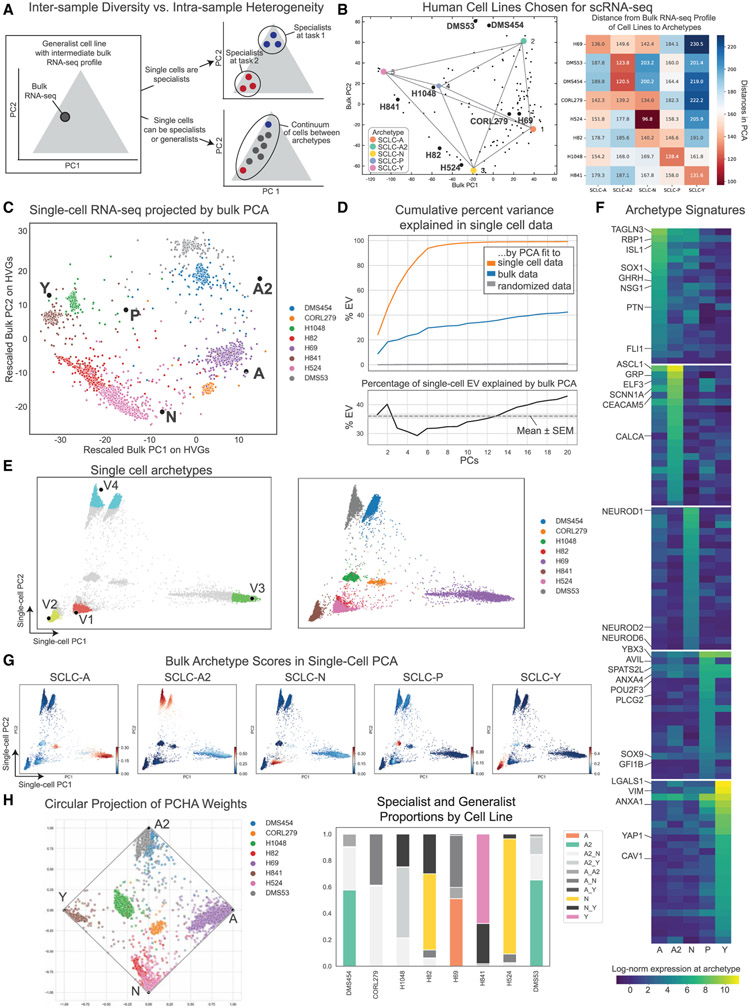
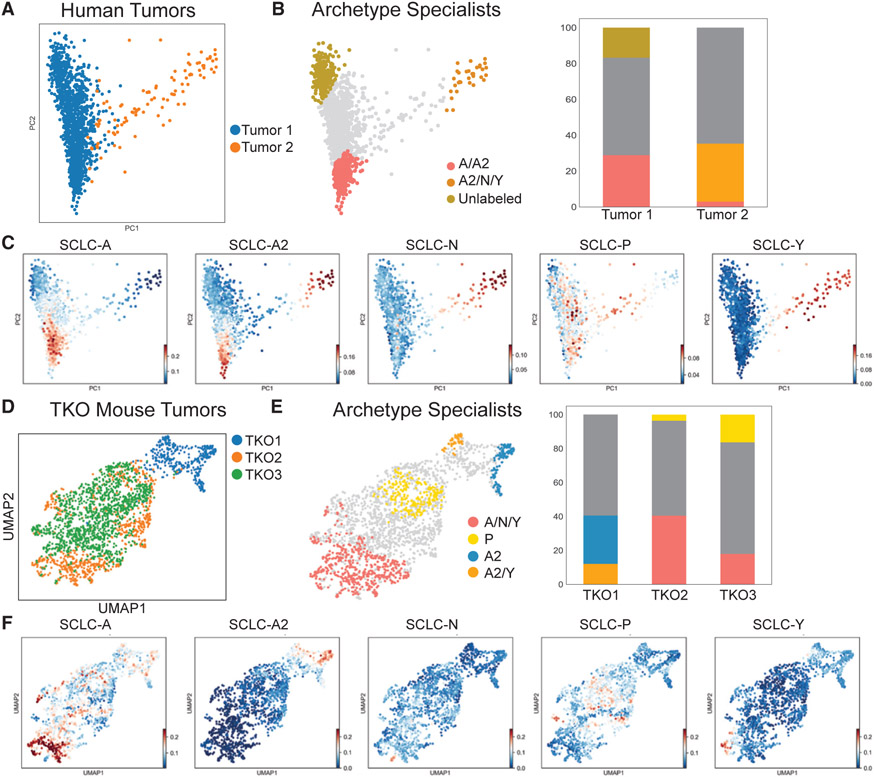
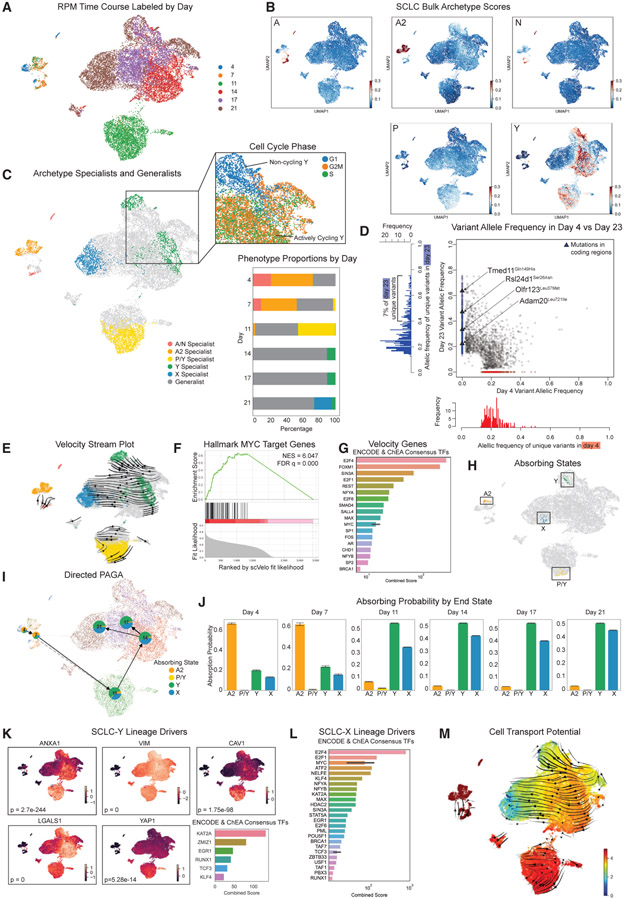
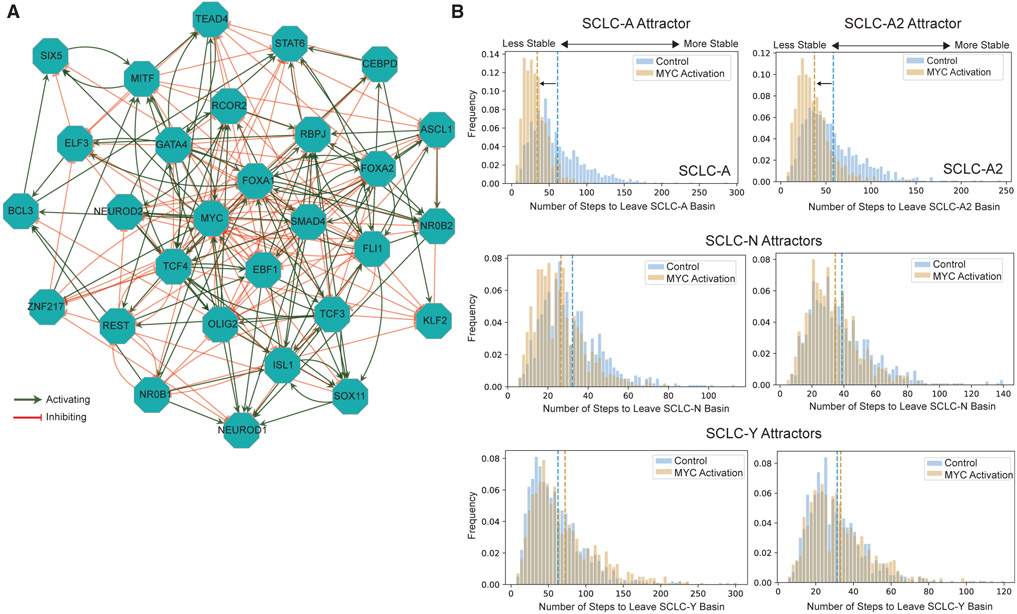
Small cell lung cancer (SCLC) tumors comprise heterogeneous mixtures of cell states, categorized into neuroendocrine (NE) and non-neuroendocrine (non-NE) transcriptional subtypes. NE to non-NE state transitions, fueled by plasticity, likely underlie adaptability to treatment and dismal survival rates. Here, we apply an archetypal analysis to model plasticity by recasting SCLC phenotypic heterogeneity through multi-task evolutionary theory. Cell line and tumor transcriptomics data fit well in a five-dimensional convex polytope whose vertices optimize tasks reminiscent of pulmonary NE cells, the SCLC normal counterparts. These tasks, supported by knowledge and experimental data, include proliferation, slithering, metabolism, secretion, and injury repair, reflecting cancer hallmarks. SCLC subtypes, either at the population or single-cell level, can be positioned in archetypal space by bulk or single-cell transcriptomics, respectively, and characterized as task specialists or multi-task generalists by the distance from archetype vertex signatures. In the archetype space, modeling single-cell plasticity as a Markovian process along an underlying state manifold indicates that task trade-offs, in response to microenvironmental perturbations or treatment, may drive cell plasticity. Stifling phenotypic transitions and plasticity may provide new targets for much-needed translational advances in SCLC. A record of this paper's Transparent Peer Review process is included in the supplemental information.

Keywords: RNA velocity; dynamical systems; gene regulatory networks; heterogeneity; phenotypic plasticity; single cell; small cell lung cancer.


Conflict of interest statement

Declaration of interests C.M.L. is a consultant/advisory board member for Pfizer, Novartis, Astra Zeneca, Genoptix, Sequenom, Ariad, Takeda, Blueprints Medicine, Cepheid, Foundation Medicine, Roche, Achilles Therapeutics, Genentech, Syros, Amgen, EMD Serono, and Eli Lilly and reports receiving commercial research grants from Xcovery, Astra Zeneca, and Novartis. W.T.I. is a consultant/advisory board member for Genentech, Jazz Pharma, G1 Therapeutics, Mirati, OncLive, Clinical Care Options, Chardan, Outcomes Insights, Cello Health, and Curio Science. T.G.O. is a consultant/advisory board member for Known Medicine. J.S. receives research funding from Pfizer. V.Q. is an Academic co-Founder and equity holder for Parthenon Therapeutics, Inc. and Duet BioSystems, Inc.

Figures

Figure 1.
Figure 1.. Archetype analysis on bulk RNA-seq data from human SCLC cell lines shows archetypes are enriched for PNEC-related gene programs
(A) Archetype analysis of bulk RNA-seq from 120 human cell lines shows that 5 archetypes fit the cell line data well (p = 0.034). Explained sample variance increases for 5 archetypes compared with 4, and 5 archetypes is the lowest number with a significant p value by a t-ratio test. (B) Subtype label enrichment. Data were binned by distance from archetype (x axis), and enrichment of each subtype label (y axis) was computed. Enriched subtypes are highest at x = 0, in the bin closest to one of the archetypes, and lowest near all other archetypes. Each archetype shows enrichment in one of the five SCLC subtypes from the literature. (C) PCA of full human RNA-seq dataset (tumors and cell lines). Projection of 5 archetypes by this PCA shows that tumors are mainly contained within the same archetype space as cell lines. Variance explained by this combined-data PCA, a tumor-data PCA, and a randomized model shows that the top 5 components of the combined-data PCA explain a large percentage, around 80%, of the variance explained by the tumor-only PCA. (D) Pulmonary neuroendocrine cell (PNEC) related tasks. PNECs can trade-off between these tasks to regenerate injured lung epithelium, respond to chemical signals in the microenvironment, affect the nervous and immune systems, and migrate to new regions of the lung airways. (i) A subset of PNECs has been shown to act like stem cells that can proliferate under lung injury (Ouadah et al., 2019). (ii) PNECs and brush cells both respond to chemicals and cytokines in the lung (Van Lommel, 2001). (iii) PNECs are innervated and can send neuronal signals by releasing neurotransmitters and peptides such as serotonin (5-HT) (Van Lommel, 2001). They also have been shown to interact with the immune system by releasing proteins such as CGRP, which can activate IL2 cells (Branchfield et al., 2016). (iv) A subset of PNECs can “slither,” or migrate, by transiently downregulating epithelial genes to move toward and form neuroendocrine bodies (NEBs), or clusters of PNECs (Kuo and Krasnow, 2015). (v) After injury to the lung epithelium (ablation of club cells), PNEC stem cells can deprogram into a transit-amplifying cell type that can then differentiate into other lung types to regenerate the epithelium (Ouadah et al., 2019). (E) Each archetype is enriched in gene ontology terms related to PNEC tasks.
Figure 2.
Figure 2.. SCLC cell line archetypes optimize PNEC-related tasks
(A) SCLC-A is enriched for proliferation. (i) Normalized activity area (AA, a measure of sensitivity) to DNA alkylators. Cell lines in the bin closest to the SCLC-A archetype are more sensitive (p < 0.05). Error bars show standard error of the mean (SEM) of AA for cell lines in each bin by distance. (ii) Cell lines closest to A are less likely to have had prior therapy (p = 0.019, hypergeometric test). (B) SCLC-A2 is enriched for signaling. (i) CALCA expression is highest at the SCLC-A2 archetype. (ii) Cell lines closest to SCLC-A2 are most sensitive to MAPK signaling inhibitors (p < 0.05). Error bars show SEM for cell lines in bin. (C) SCLC-N is enriched for slithering-related tasks. (i) Average expression of an axonogenesis gene set from Yang et al. (2019) as a function of distance from the SCLC-N archetype, showing a correlation between expression and closeness to the SCLC-N archetype. (ii) Axon-like (Tuj1+) protrusions and filopodia are more prevalent in SCLC-N cell lines, as shown by arrows (Tuj1+ protrusions) and arrowheads (filopodia) and quantified using a one-way ANOVA (***p < 0.001, n = 3 replicates, 20 cells quantified per replicate). All scale bars are 50 mm. A representative of 6, 9, 9, and 2 individual cells are shown for four cell lines (left column), with a higher resolution image of a single representative cell shown for each cell line (middle and right column). DAPI channel for H69, H524, and H196 is brightened in the final images and no other digital adjustments were made. (iii) EMT gene expression rescaled by gene (rescaled log-normalized expression) is shown by color in a heat map across archetypes. SCLC-N cells express some mesenchymal markers (ZEB1, SNAI1, and TWIST1) at intermediate levels and downregulate CDH1. (iv) SCLC-N cell lines are more likely to be mixed (3/12 cell line) than non-N cell lines (3/80 cell lines) with p = 0.0087 (hypergeometric test). (D) SCLC-P is enriched for tuft cell-like features and metabolism tasks. (i) Genes upregulated in the SCLC-P archetype that is expressed in tuft cells. CHAT, GNAT3, and SUCNR1 are part of the pathway by which succinate stimulation affects the metabolism of intestinal tuft cells and the stimulation of type 2 immunity (Banerjee et al., 2020). (ii) Basal respiration rate (OCR) after overnight (12 h) stimulation by succinate. H1048, which is closest to the SCLC-P archetype, increases OCR after stimulation, whereas SCLC-A2 and SCLC-Y cell lines do not. (E) SCLC-Y is enriched in injury repair tasks. The average expression of genes related to the transit-amplifying subpopulation of PNEC stem cells from Ouadah et al. (2019) under lung injury is correlated with closeness to the SCLC-Y archetype.
Figure 3.
Figure 3.. SCLC archetype gene signatures reveal generalists and specialists in cell lines at the single-cell level
(A) Inter-sample diversity is supported by intra-sample heterogeneity. Generalist cell lines may comprise several specialist subpopulations or both specialists and generalists in a continuum of single cells. (B) To investigate intra-sample heterogeneity, human cell lines for scRNA-seq were chosen to span the phenotypic space of SCLC. Two cell lines from each neuroendocrine subtype (A, A2, and N) were chosen, and one from each non-neuroendocrine subtype (P and Y) was chosen. Left: chosen cell lines in bulk PCA space. Right: the distance of each bulk cell line gene expression profile to each archetype in PCA. (C) Single-cell RNA-seq on sampled human SCLC cell lines projected by PCA fit to bulk RNA-seq on cell lines in (A). Each sample occupies a distinct region in this space, and many samples fall in between archetypes. (D) Top: variance explained in single-cell data by PCA fit to bulk cell line data. Orange: upper bound of variance explained for each number of components is given by PCA fit to single-cell data. Blue: the variance explained by the bulk PCA is a large proportion of this, as compared with a randomized model (gray). Bottom: inter-sample diversity explains a large percentage of the intra-sample variance, around 36%. This fraction stays relatively constant for varying numbers of PCs. Black line: intra-sample variance explained by inter-sample diversity as a percentage of upper bound. Gray dotted line: mean ± SEM (gray box). (E) Left: single-cell archetypes from PCHA on imputed cell line scRNA-seq data for human cell lines in single-cell PCA. The 5% of cells closest to each archetype are colored; generalists are shown in gray. Right: cell lines labeled in single-cell PCA. (F) Gene signature used for single-cell subtyping. Expression of genes at archetype location is shown by color (log-normalized expression), with genes of interest highlighted. A full list of genes and numerical values can be found in Table S6. (G) Using least-squares approximation, we score single cells by 5 bulk archetype signatures in (F). The color shows archetype signature scores on human cell line scRNA-seq data (linear scale, arbitrary units). (H) Left: using a permutation test (see STAR Methods), we compare average archetype scores of each single-cell specialist subpopulation with background distributions from non-specialists to label archetypes. Circular a posteriori (CAP) plot of single-cell archetype weights for each cell, with archetypes labeled by enriched bulk signature. Right: specialist and generalist proportions shown for each cell line in bar plots.
Figure 4.
Figure 4.. Archetype analysis of human tumors and triple knockout (TKO) mouse models
(A) PCA of imputed scRNA-seq from two human tumors. (B) Two human tumors shown in PCA with archetype specialists labeled. Three archetypes best fit the data. Specialists with scores > 0.9 are shown on the PCA projection. Bar plots show the proportions of specialists and generalists in each tumor. (C) Bulk archetype scores used to label specialists in (B). (D) Three TKO mouse tumors in a UMAP projection (GSE137749). TKO2 and TKO3 are from the same mouse, contributing to their overlap in the UMAP. (E) Four archetypes fit the three TKO tumors. Archetype specialists are shown by color; generalists are shown in gray. Bar plots show the proportions of specialists and generalists in each tumor. (F) Bulk archetype scores used to label specialists in (E). Archetype signature scores shown by color (linear scale, arbitrary units).
Figure 5.
Figure 5.. MYC increases the plasticity of NE specialists (SCLC-A, A2, and N) in GEMM tumor progression
(A) UMAP of the RPM time course (GSE149180) with time points labeled. Days 4 and 7 fall in the same region of the UMAP; day 11 is mostly distinct; and days 14–21 fall in the same large cluster. (B) Bulk archetype signature scores (linear scale, arbitrary units) shown as color for single cells in RPM time course. Days 4 and 7 are enriched in the NE SCLC-A, -A2, and -N archetype signatures; day 11 is slightly enriched for the non-NE SCLC-P and -Y signatures; and a subpopulation of days 14–21 is enriched in the SCLC-Y signature. (C) Left: specialists for 6 archetypes are shown by color on UMAP, with generalists in gray. The 5 of 6 archetypes are enriched in SCLC signatures; the sixth archetype (blue) is labeled as X. Top right: two archetypes are enriched for the SCLC-Y signature. One of these archetypes is actively cycling, with cells in the G2M and S phases of the cell cycle. The other is non-cycling. Bottom right: stacked bar plots show overall subtype composition change. (D) Variant allele frequency for beginning (day 4) and end (day 23) of an independent RPM time course. Only 4 variants unique to day 23 are in coding regions (triangles), and less than 7% of variants are high frequency, suggesting minimal clonal evolution. This supports the notion that phenotype transitions, rather than clonal selection, drive movement from NE to non-NE archetypes. (E) RNA velocity shows transition across the time course in UMAP projection. (F) Hallmark gene set of MYC targets is enriched in gene set with high fit likelihoods for dynamical RNA velocity model. (G) ENCODE and ChEA consensus TFs from EnrichR analysis of top fit likelihood genes (likelihood > 0.3). The consensus score from EnrichR shown. For genes from both sources (i.e., ENCODE and ChEA both have the TF), a black bar shows 95% confidence interval on the mean consensus score. E2F family genes and MYC are key drivers of the transition. (H) Using CellRank, we fit a Markov transition matrix to these dynamics using a weighted kernel of the RNA velocity (weight = 0.8) and diffusion pseudotime (DPT) calculated in Ireland et al. (2020) (weight = 0.2). Using the CellRank implementation of a GPCCA estimator, we find end states for the Markov chain model and display the top 30 most likely cells for each absorbing (end) state. (I) PAGA plot shows transitions between time points. Pie plots overlaid on PAGA show aggregate lineage probabilities by time point. (J) Aggregate lineage probabilities by time point shown as a bar plot, with absorption probability on the y axis. (K) Lineage drivers of the SCLC-Y lineage. Genes correlated to absorption probabilities for the SCLC-Y lineage are considered drivers of that lineage. UMAP of select lineage drivers from the SCLC-Y archetype signature is shown, with normalized gene expression shown by color (rescaled log-normalized expression). EnrichR analysis shows TF regulators, ranked by consensus score, of the top 40 significant lineage drivers sorted by correlation with lineage (p < 0.05). TCF3 is in the SCLC network described in Wooten et al. (2019); RUNX1 was predicted to regulate an intermediate osteogenic state in an RPM mouse model with inactivated ASCL1 (Olsen et al., 2021). (L) TF regulators of lineage drivers for the X absorbing state. As in (K), EnrichR was used to rank regulators by consensus score. E2F family genes, MYC, and RUNX1 are regulators of the X lineage. For genes found in both sources (ENCODE and ChEA), 95% confidence interval shown as black bar around mean of scores from each source. (M) Cell transport potential (shown by color, linear scale, arbitrary units) shows most plastic subtypes across the time course. Cells closer to the NE archetypes SCLC-A and -A2 have higher plasticity in earlier time points. CTrP decreases over time, consistent with cells that transition from NE phenotypes to non-NE phenotypes with lower plasticity.
Figure 6.
Figure 6.. MYC activation destabilizes NE states
(A) Transcription factor network adapted from Wooten et al. to incorporate MYC activity. (B) In silico destabilization of NE specialists by MYC activation. Using BooleaBayes simulations (Wooten et al., 2019), we performed random walks with activated MYC and found that SCLC-A and SCLC-A2 states are destabilized; i.e., MYC activation is capable of increasing plasticity of these subtypes in RPM tumors. SCLC-N and SCLC-Y attractors were not destabilized.

Comment in

References

    1. Agaimy A, Erlenbach-Wünsch K, Konukiewitz B, Schmitt AM, Rieker RJ, Vieth M, Kiesewetter F, Hartmann A, Zamboni G, Perren A, and Klöppel G (2013). ISL1 expression is not restricted to pancreatic well-differentiated neuroendocrine neoplasms, but is also commonly found in well and poorly differentiated neuroendocrine neoplasms of extrapancreatic origin. Mod. Pathol 26, 995–1003. - PubMed
    1. Alam Sk.K., Wang L, Ren Y, Hernandez CE, Kosari F, Roden AC, Yang R, and Hoeppner LH (2020). ASCL1-regulated DARPP-32 and t-DARPP stimulate small cell lung cancer growth and neuroendocrine tumour cell proliferation. Br. J. Cancer 123, 819–832. - PMC - PubMed
    1. Altschuler SJ, and Wu LF (2010). Cellular heterogeneity: do differences make a difference? Cell 141, 559–563. - PMC - PubMed
    1. Baine MK, Hsieh M-S, Lai WV, Egger JV, Jungbluth AA, Daneshbod Y, Beras A, Spencer R, Lopardo J, Bodd F, et al. (2020). SCLC subtypes defined by ASCL1, NEUROD1, POU2F3, and YAP1: a comprehensive immunohistochemical and histopathologic characterization. J. Thorac. Oncol 15, 1823–1835. - PMC - PubMed
    1. Banerjee A, Herring CA, Chen B, Kim H, Simmons AJ, Southard-Smith AN, Allaman MM, White JR, Macedonia MC, Mckinley ET, et al. (2020). Succinate produced by intestinal microbes promotes specification of tuft cells to suppress ileal inflammation. Gastroenterology 159, 2101–2115.e5. - PMC - PubMed

Publication types

MeSH terms