. 2022 Sep 6;34(9):1298-1311.e6.
doi: 10.1016/j.cmet.2022.07.012. Epub 2022 Aug 17.

Carbon source availability drives nutrient utilization in CD8+ T cells

Affiliations

Carbon source availability drives nutrient utilization in CD8+ T cells

Irem Kaymak et al. Cell Metab. .

Abstract

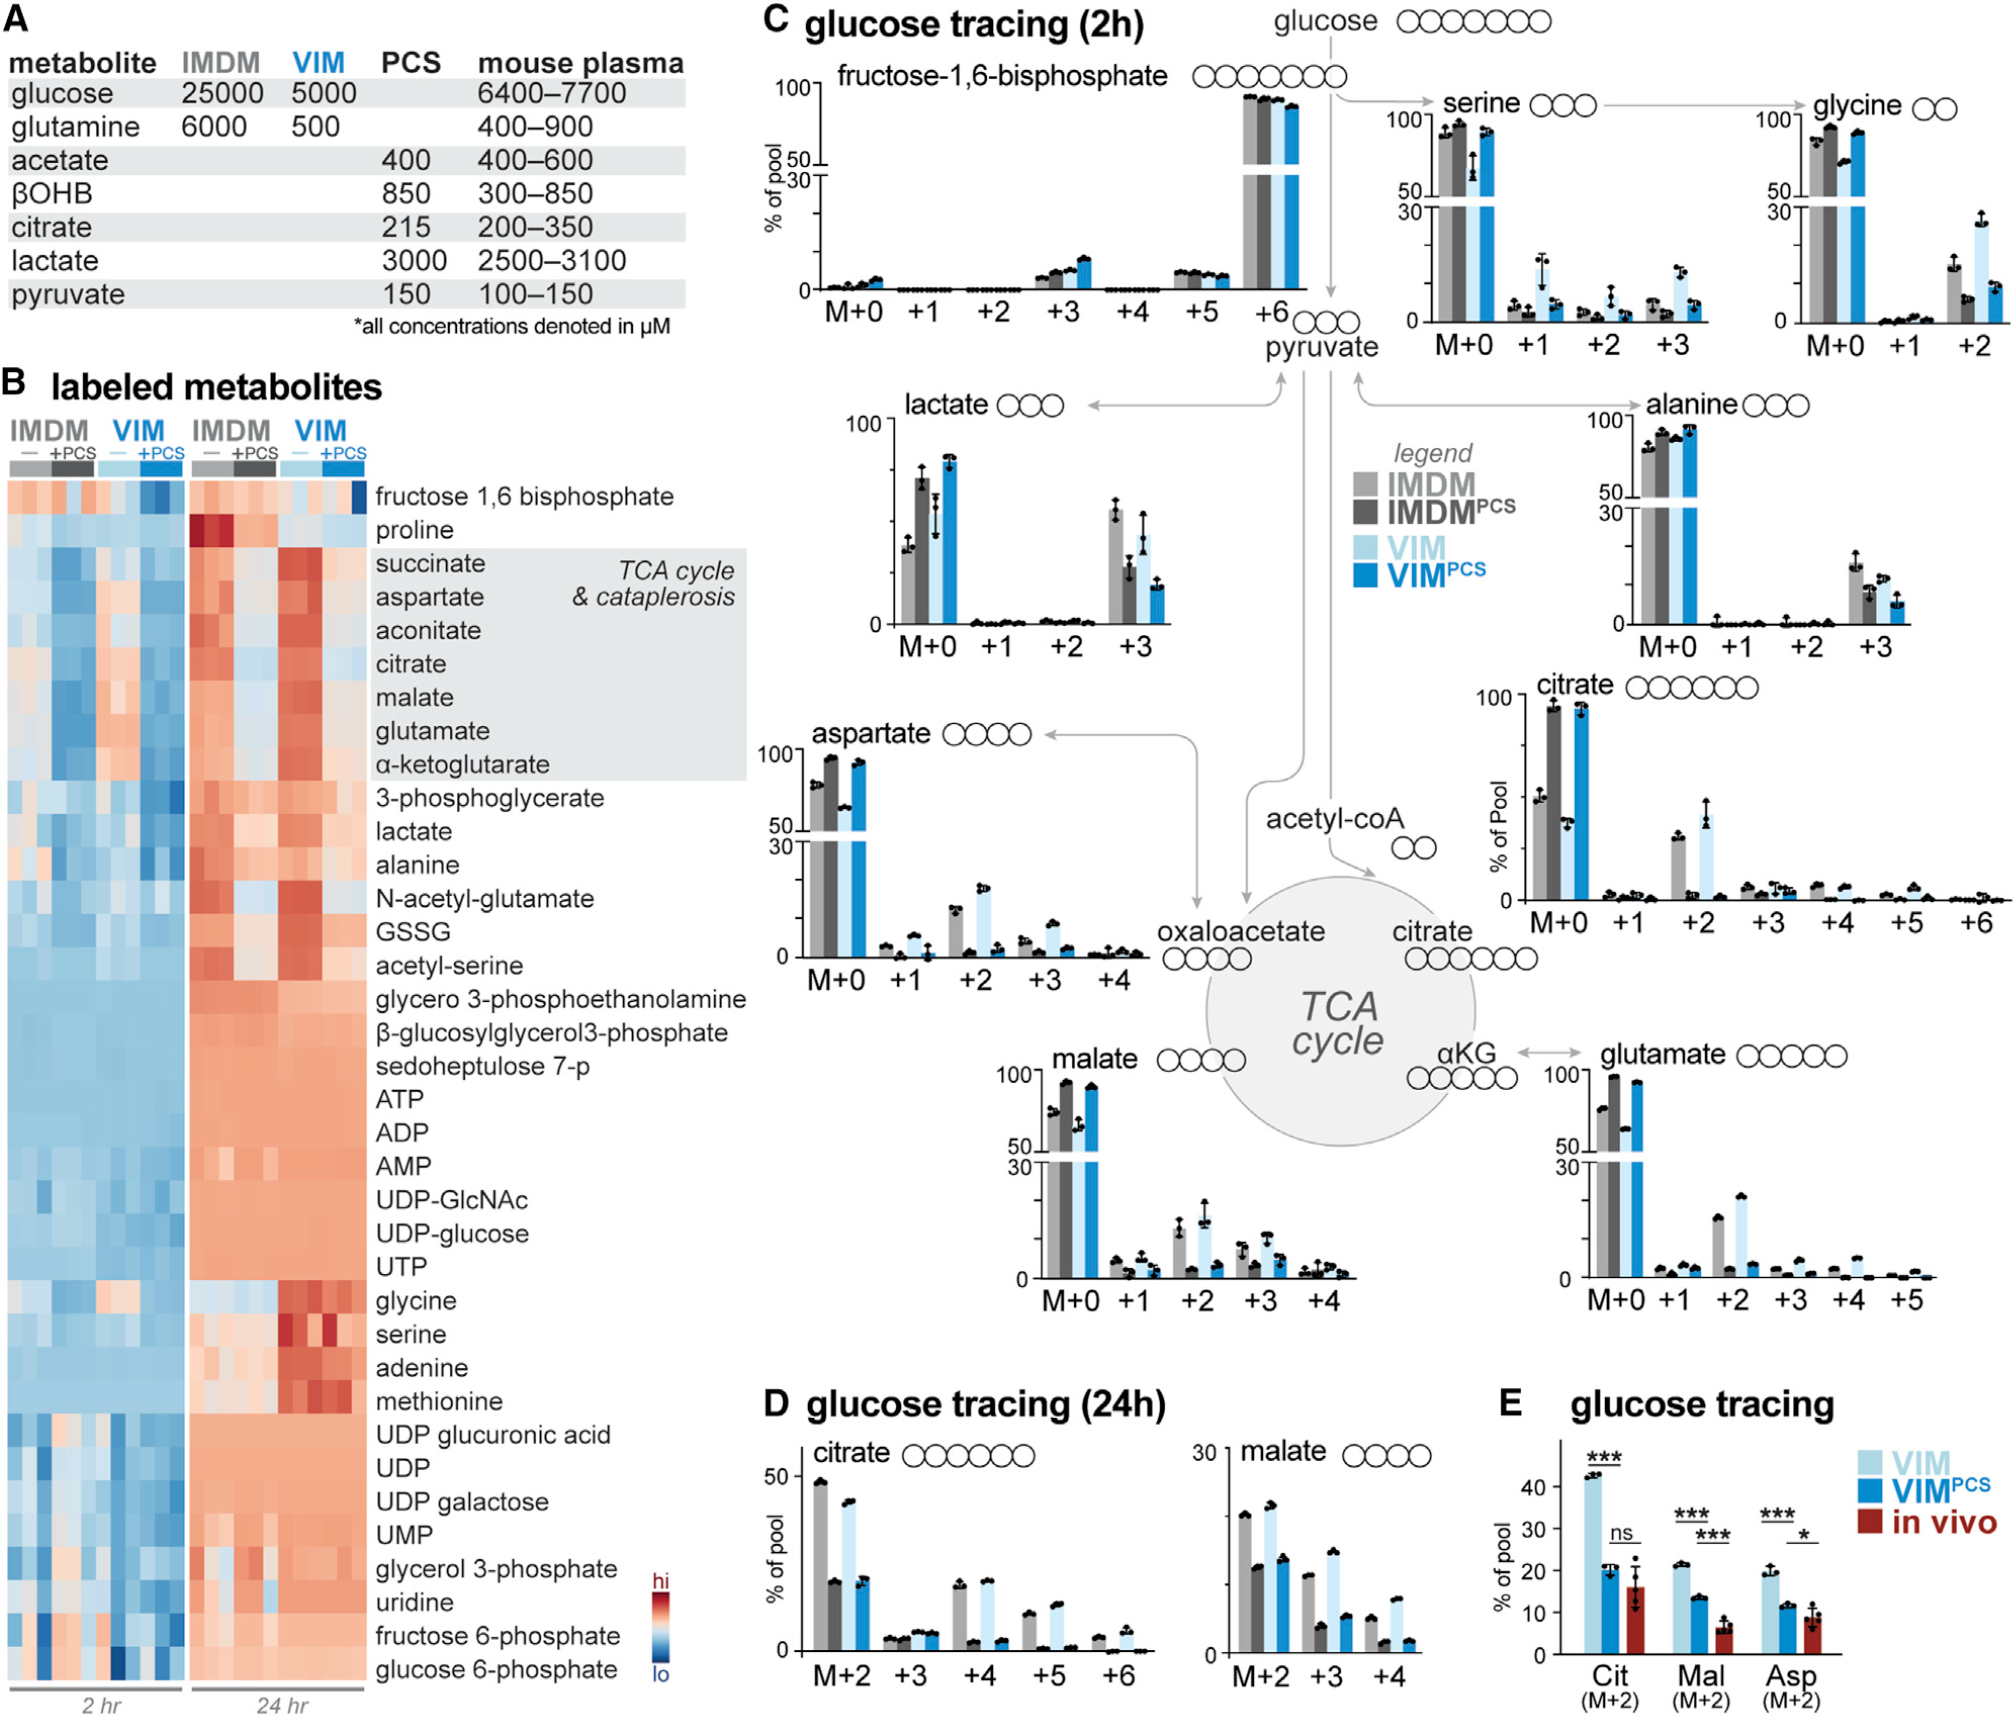
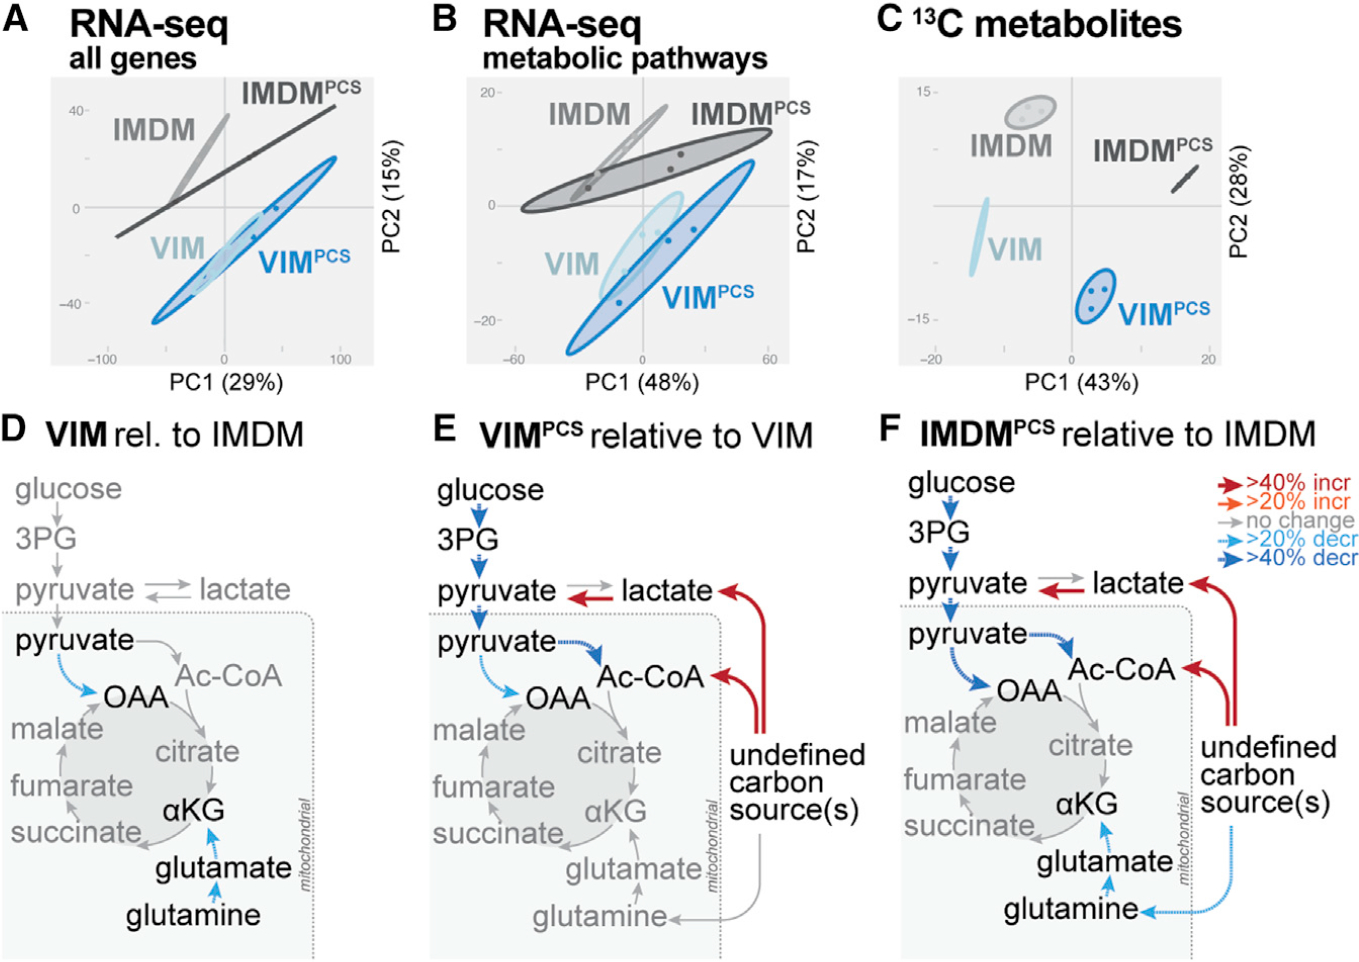
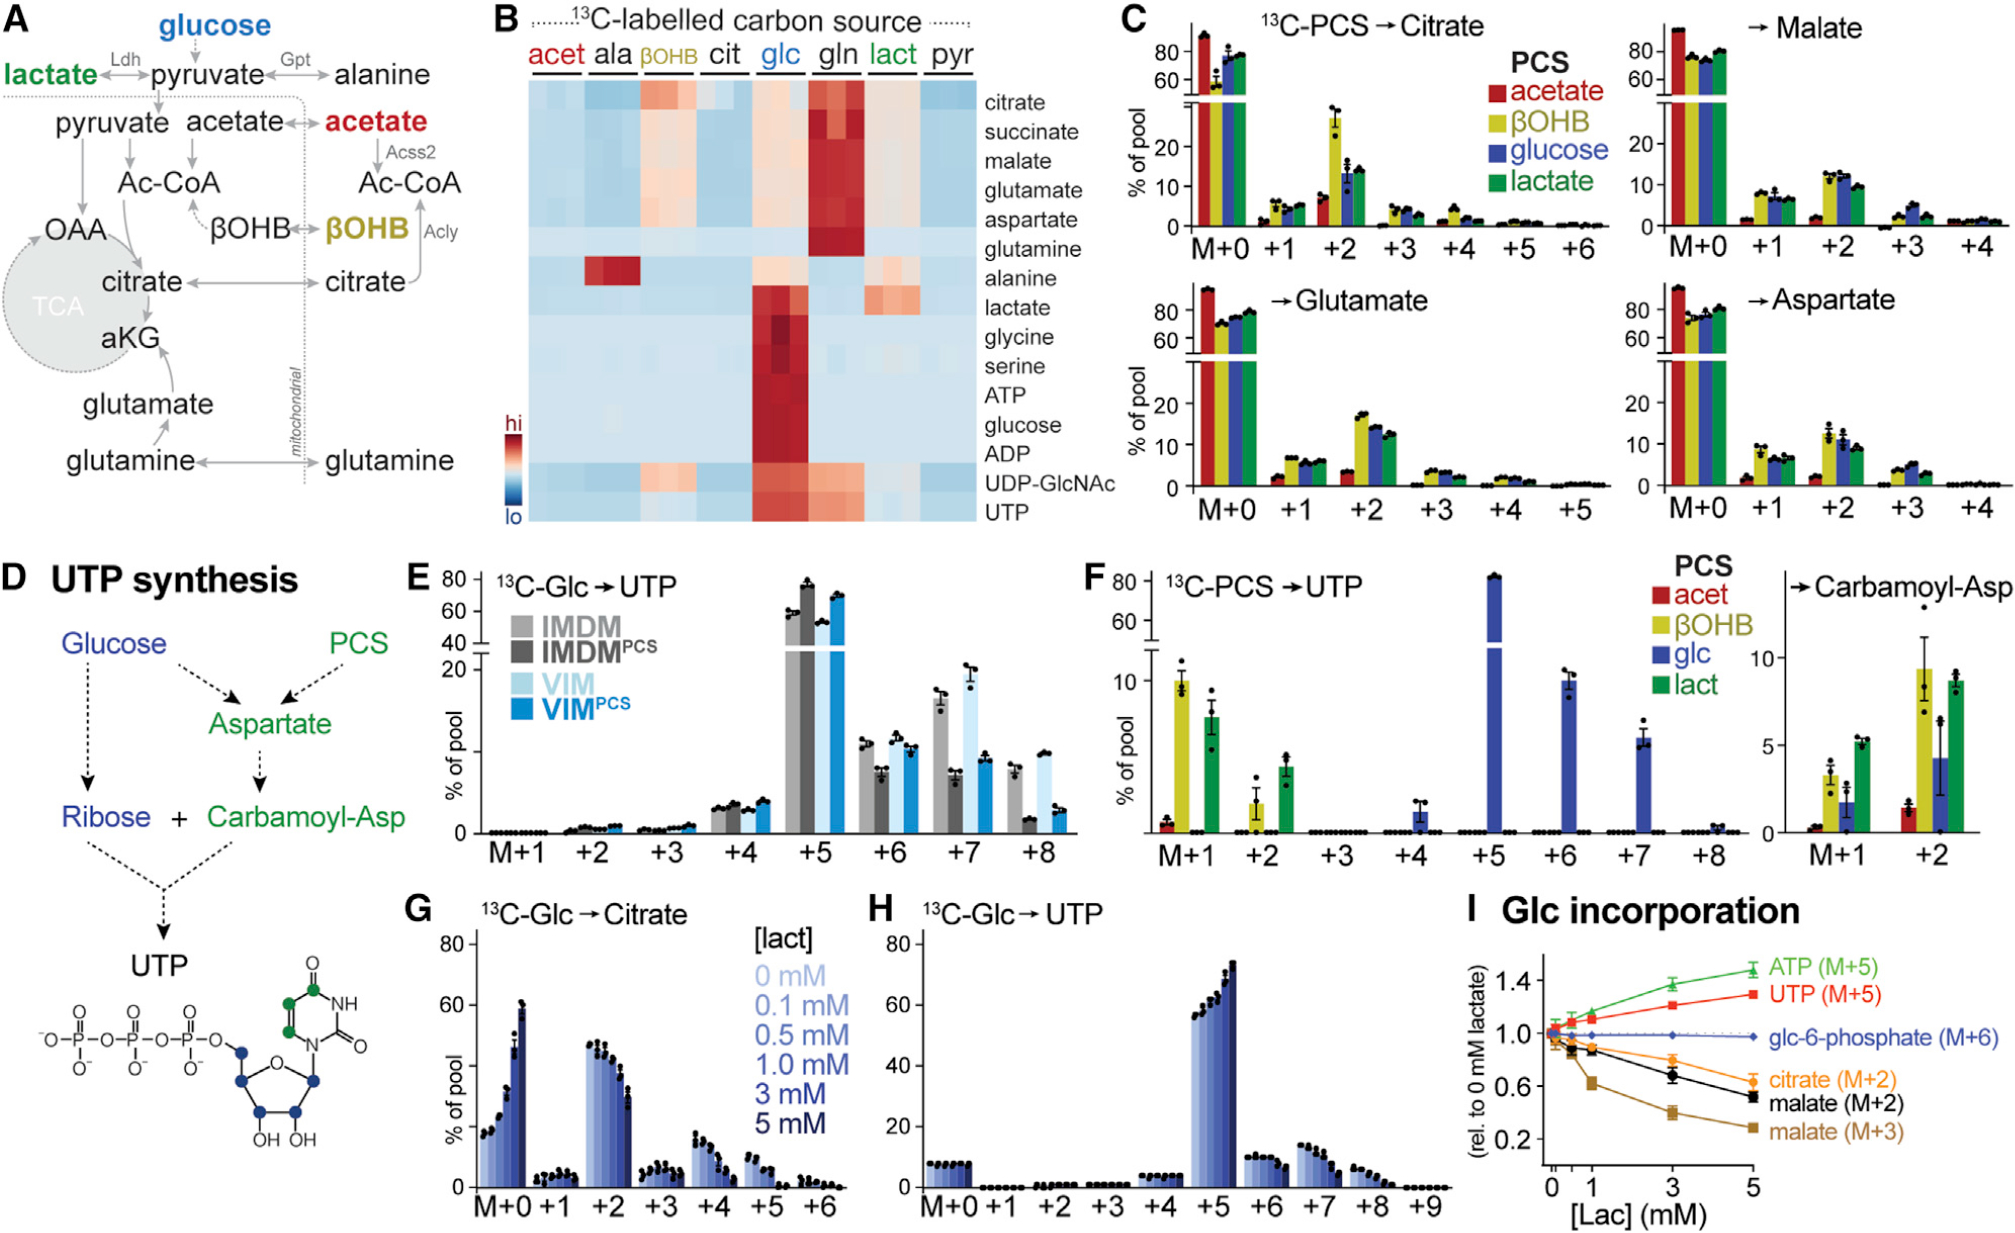
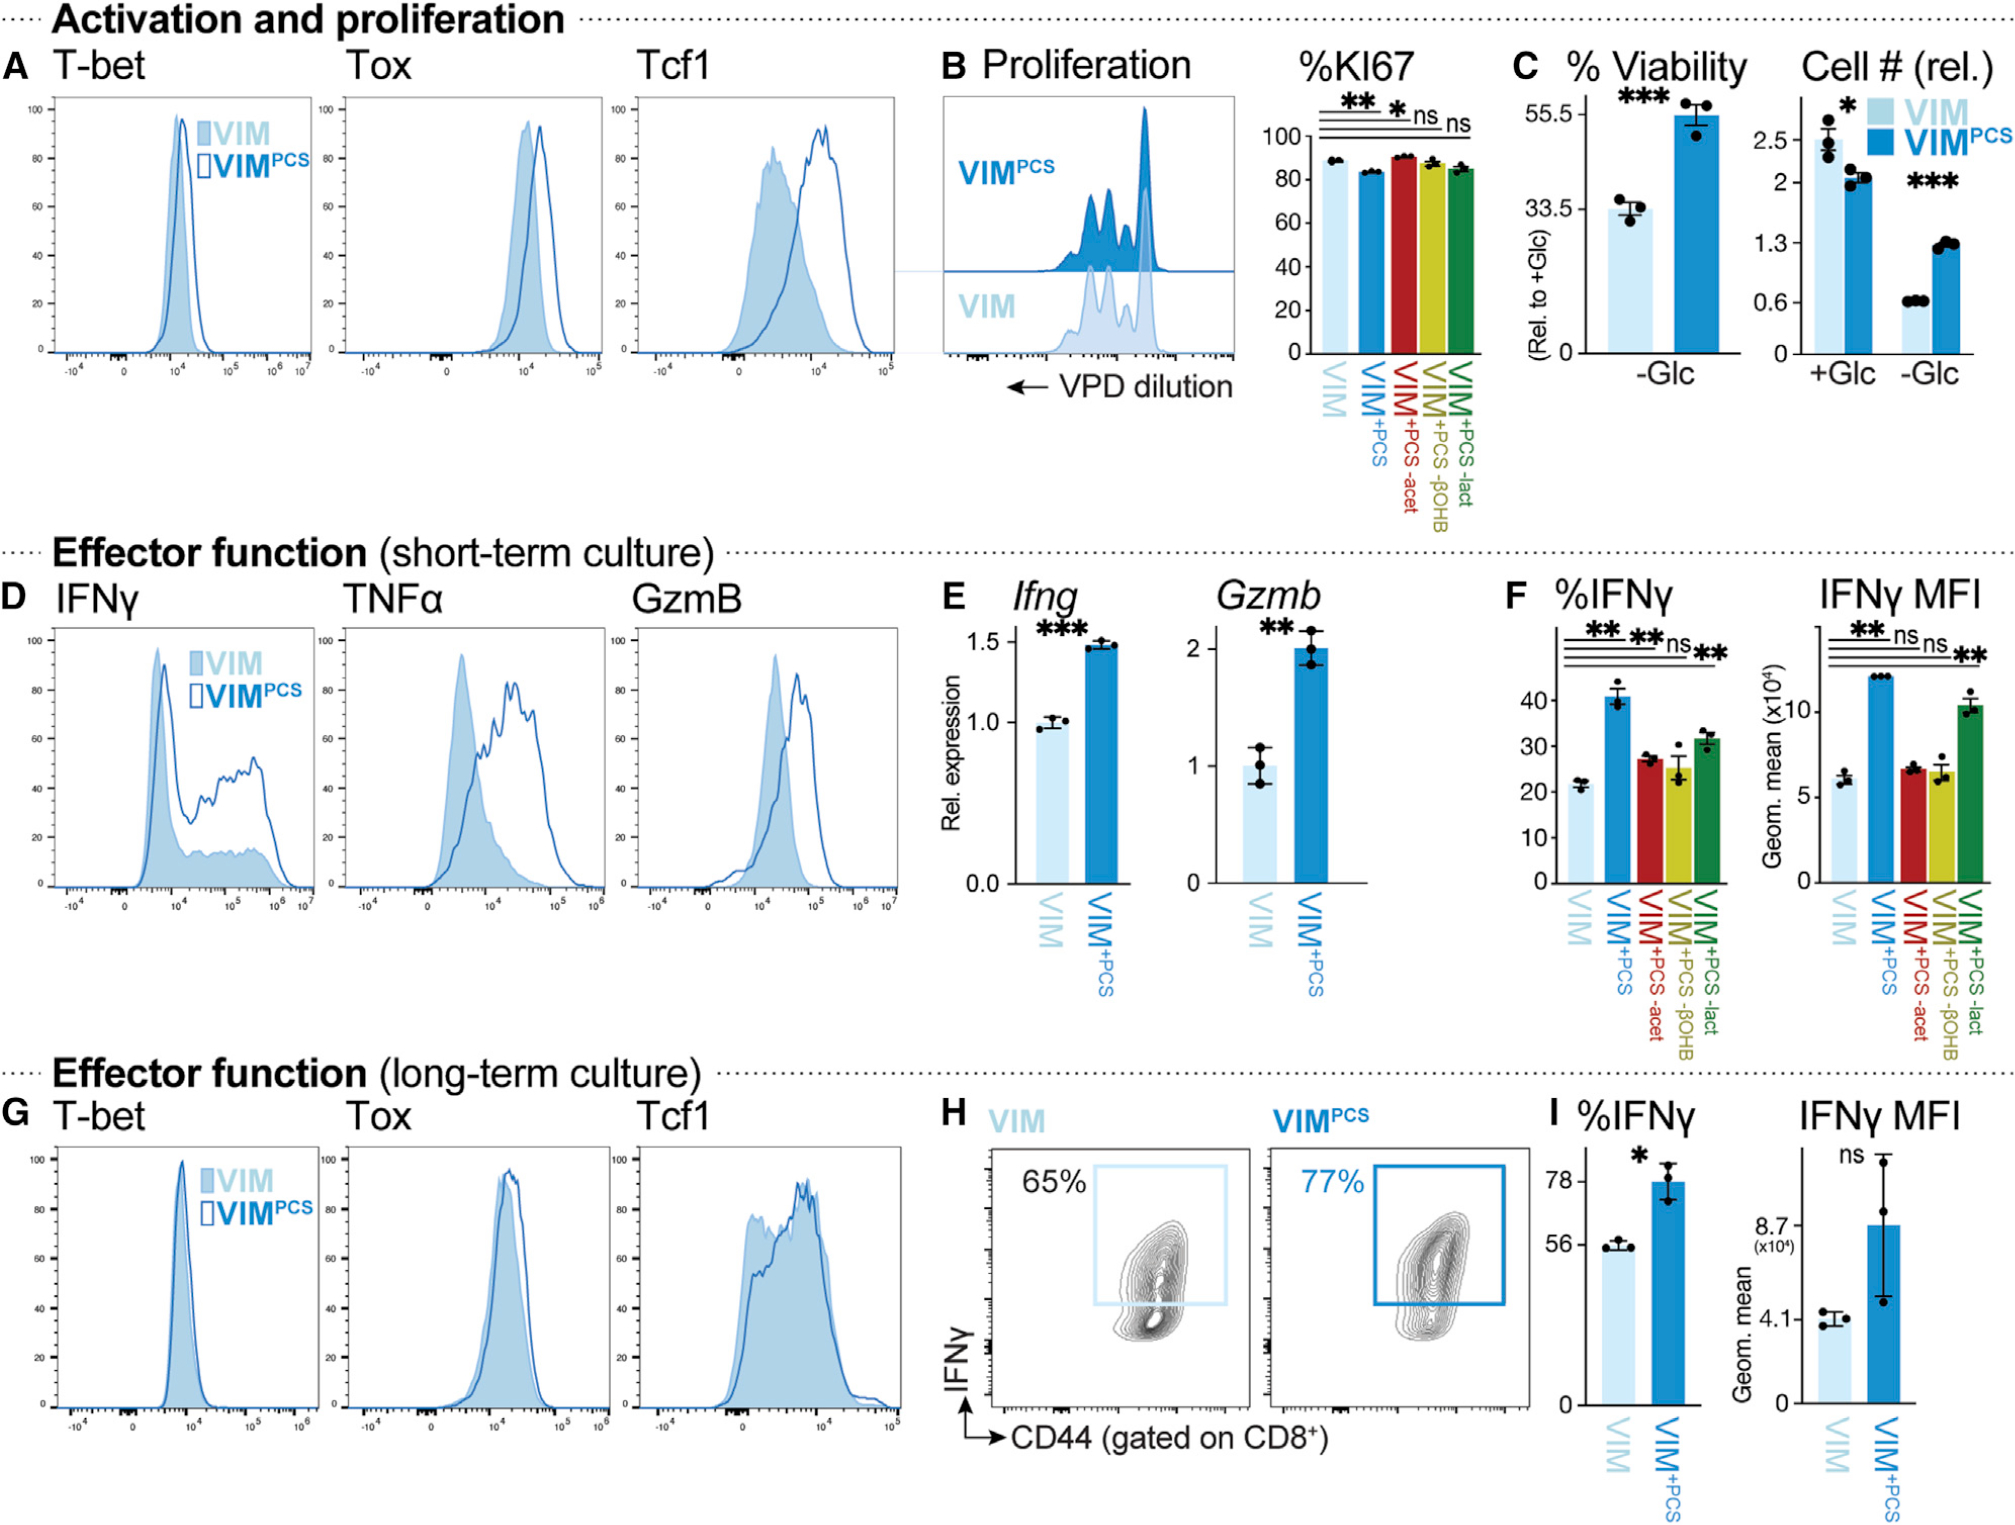
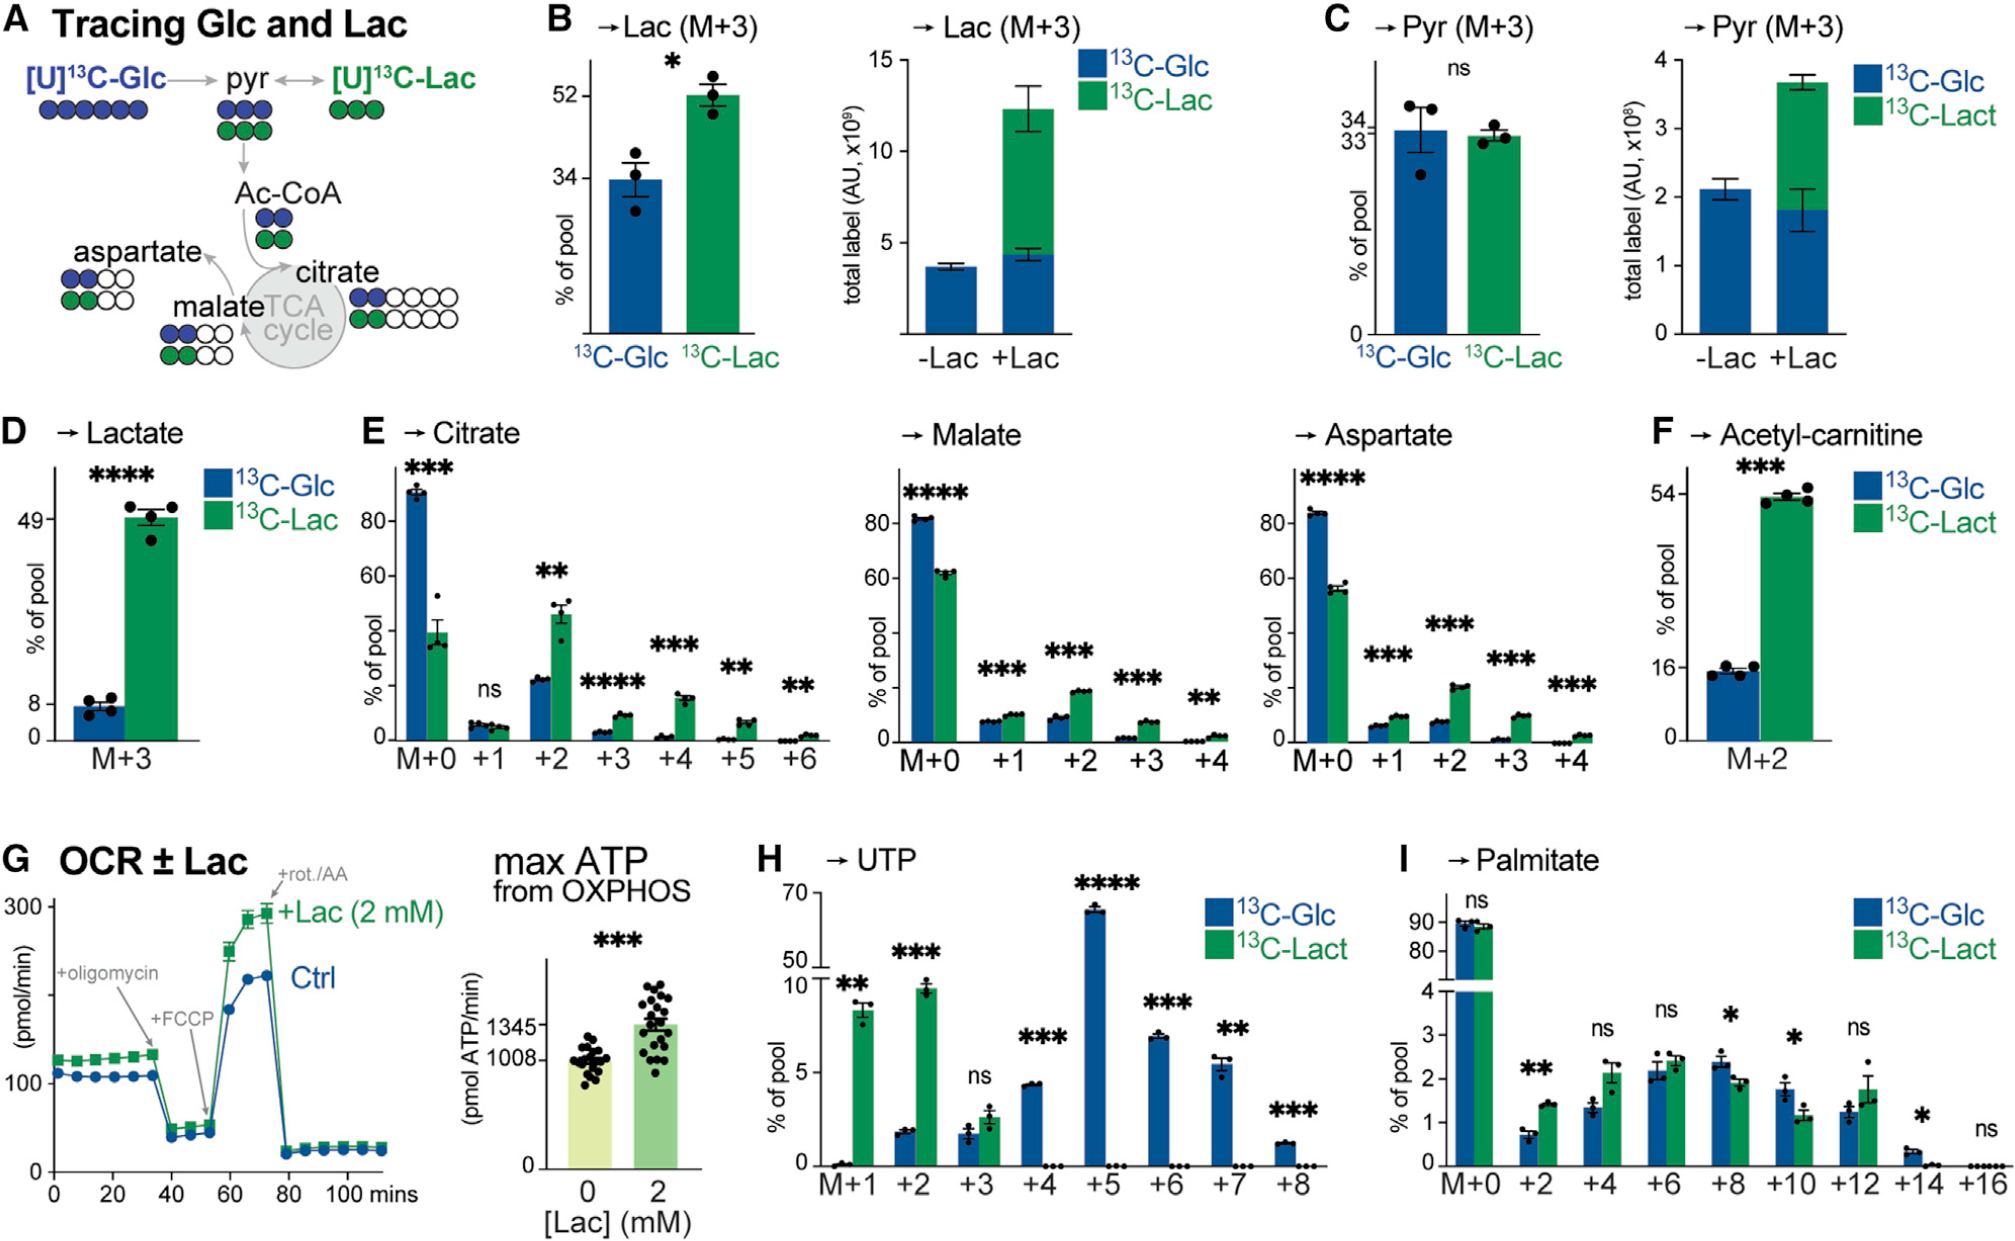
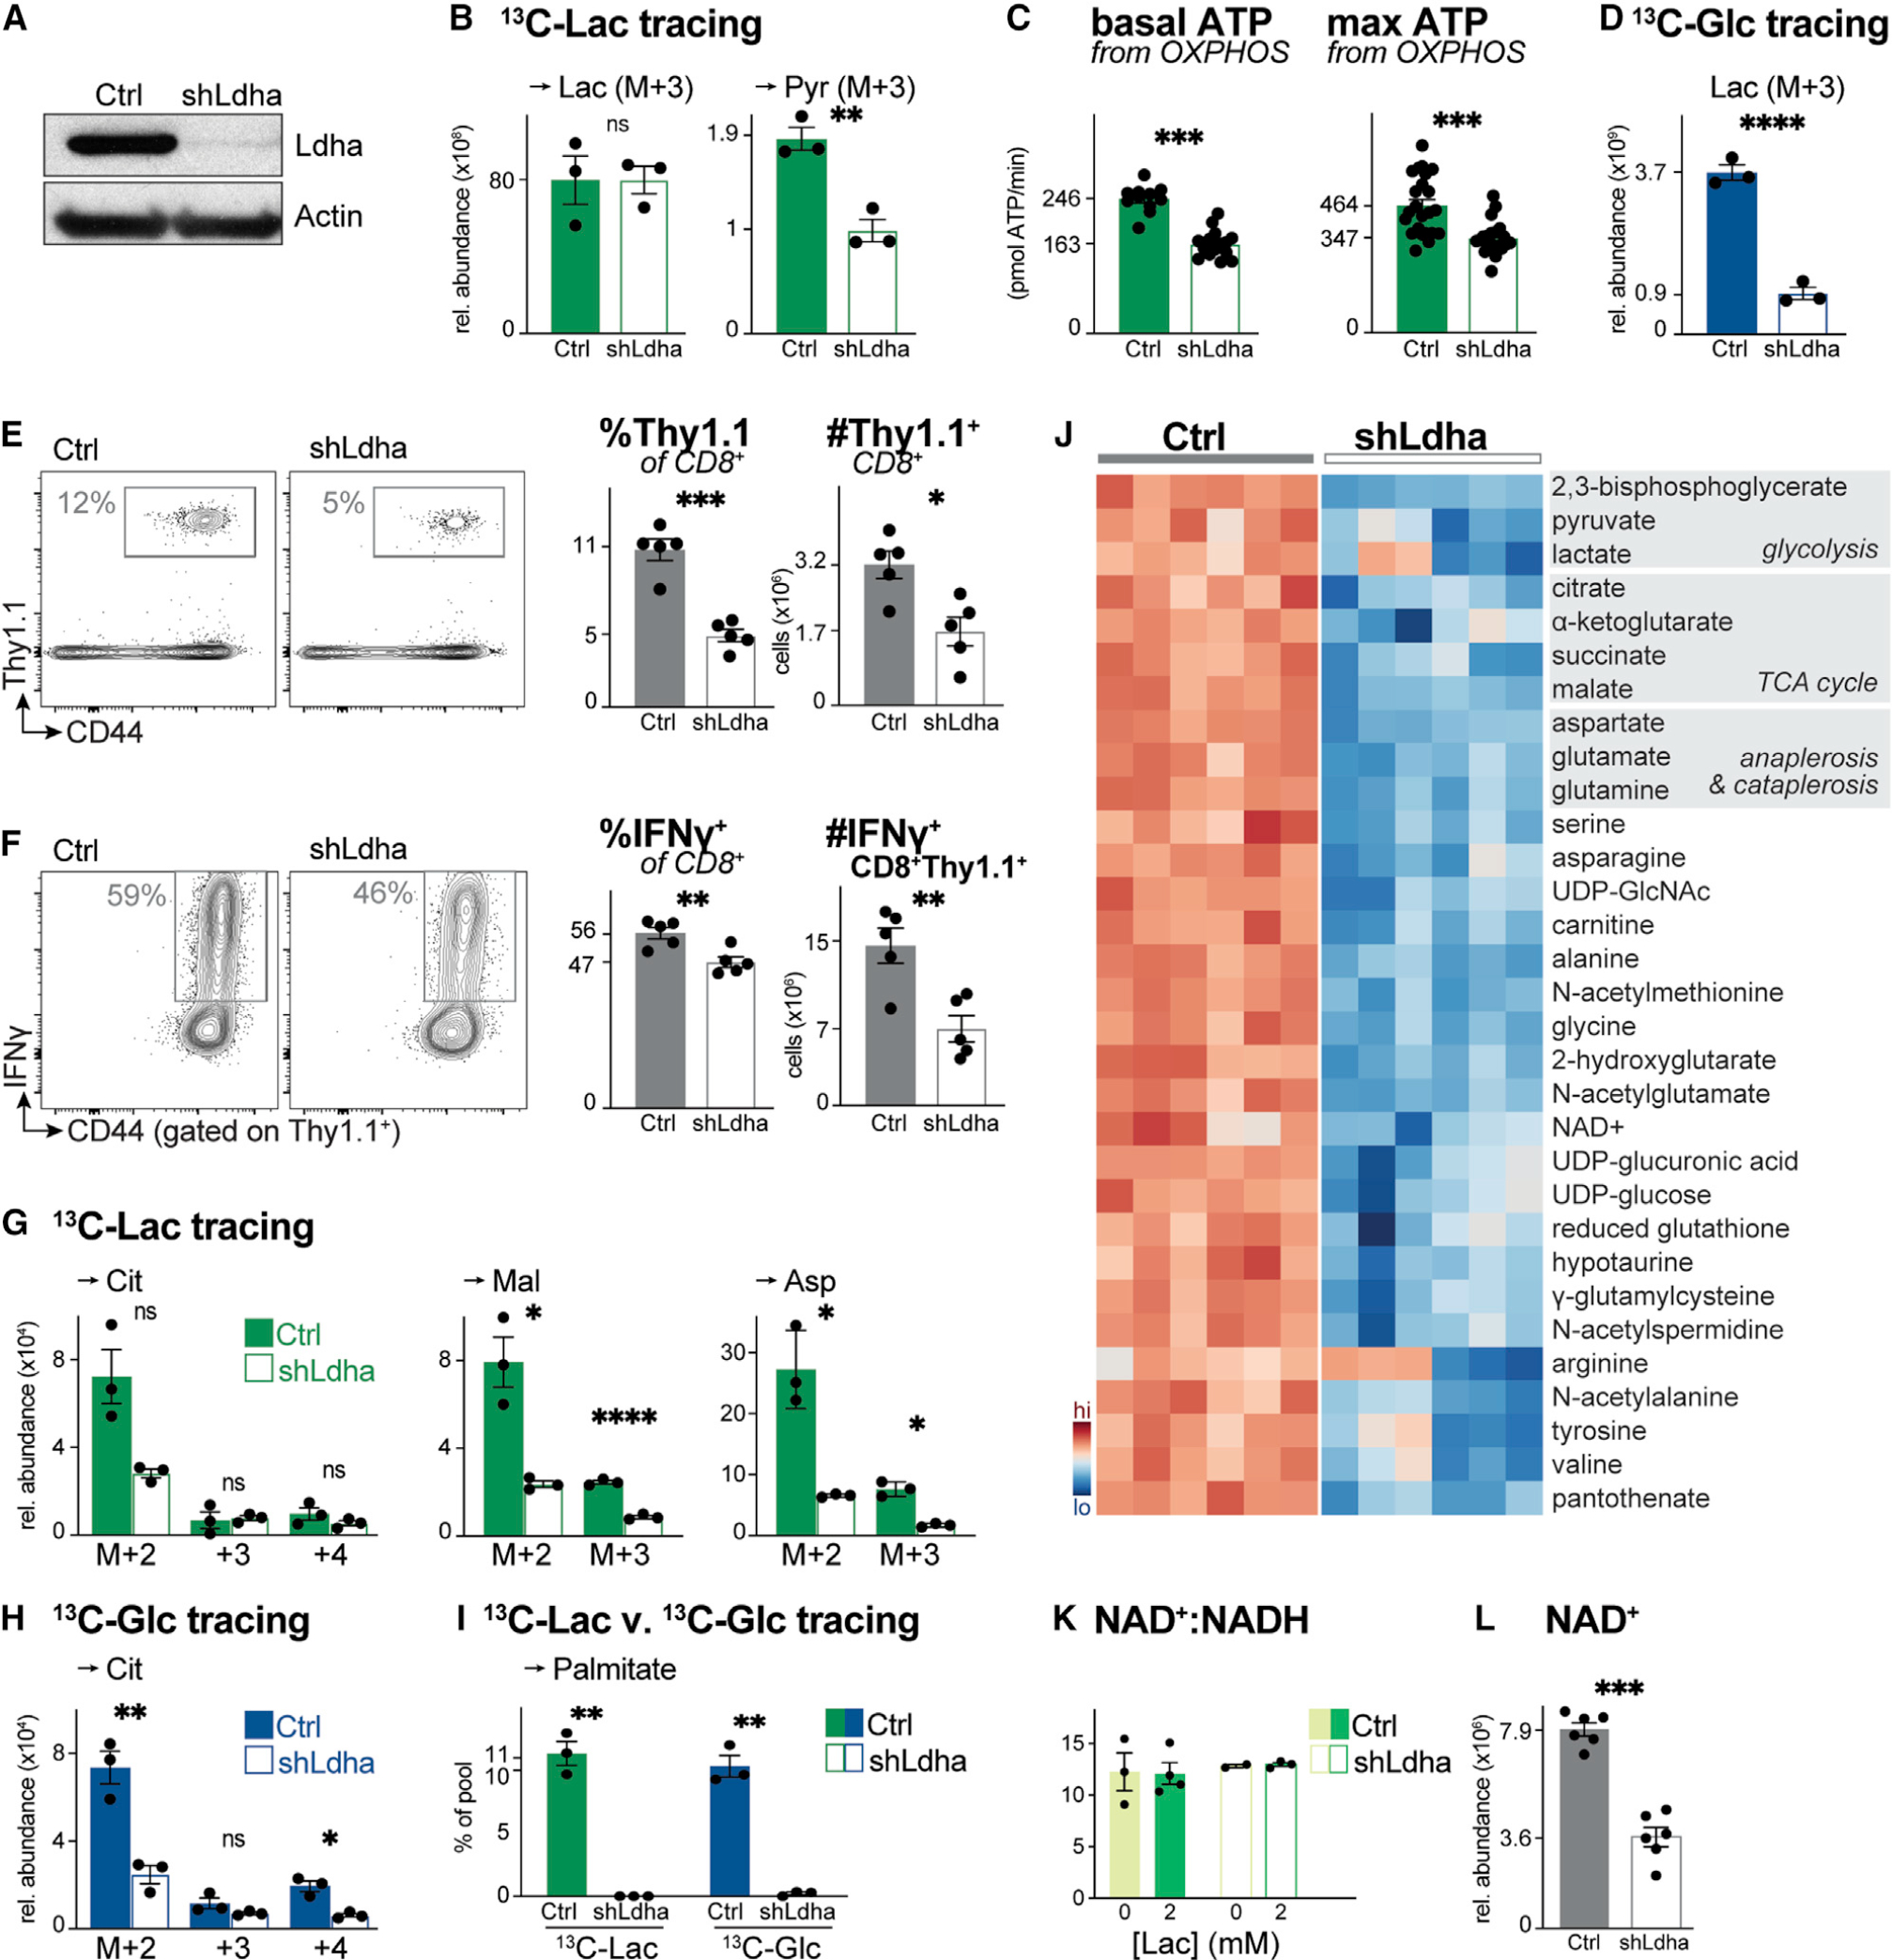
How environmental nutrient availability impacts T cell metabolism and function remains poorly understood. Here, we report that the presence of physiologic carbon sources (PCSs) in cell culture medium broadly impacts glucose utilization by CD8+ T cells, independent of transcriptional changes in metabolic reprogramming. The presence of PCSs reduced glucose contribution to the TCA cycle and increased effector function of CD8+ T cells, with lactate directly fueling the TCA cycle. In fact, CD8+ T cells responding to Listeria infection preferentially consumed lactate over glucose as a TCA cycle substrate in vitro, with lactate enhancing T cell bioenergetic and biosynthetic capacity. Inhibiting lactate-dependent metabolism in CD8+ T cells by silencing lactate dehydrogenase A (Ldha) impaired both T cell metabolic homeostasis and proliferative expansion in vivo. Together, our data indicate that carbon source availability shapes T cell glucose metabolism and identifies lactate as a bioenergetic and biosynthetic fuel for CD8+ effector T cells.

Keywords: (13)C tracing; T cells; TCA cycle; immunometabolism; lactate; metabolic programming; metabolomics.


Conflict of interest statement

Declaration of interests R.J.D. is a founder and consultant for Atavistik Biosciences and an advisor for Agios Pharmaceuticals, Nirogy Therapeutics, and Vida Ventures. R.G.J. is a scientific advisor for Agios Pharmaceuticals and Servier Pharmaceuticals and is a member of the Scientific Advisory Board of Immunomet Therapeutics.

Figures

Figure 1.
Figure 1.. Physiologic carbon sources influence glucose utilization by T cells
(A) Table highlighting major medium components of IMDM and VIM and physiologic carbon sources (PCSs) used in this study. Concentration ranges for metabolites in mouse serum are provided for comparison (Table S1). (B) Heatmap depicting relative incorporation of 13C from [U-13C]-glucose into the indicated intracellular metabolites from activated CD8+ T cells cultured in IMDM or VIM with (+) or without (−) PCSs. Activated (CD44+) T cells were cultured in the indicated medium containing [U-13C]-glucose for 2 or 24 h (n = 3/group). (C) Mass isotopologue distribution (MID) for [U-13C]-glucose-derived metabolites for activated CD8+ T cells cultured in IMDM (gray) or VIM (blue) with or without PCSs. Shown are MID labeling patterns for select metabolites after 2 h of culture as in (B) (mean ± SEM, n = 3/group). (D) MID labeling patterns for [U-13C]-glucose-derived citrate and malate for CD8+ T cells cultured in IMDM (gray) or VIM (blue) with or without PCSs for 24 h as in (B) (mean ± SEM, n = 3/group). (E) Fractional enrichment of [U-13C]-glucose-derived carbon in TCA cycle intermediates in activated CD8+ T cells. T cells activated as in (B) were cultured with [U-13C]-glucose in VIM or VIM plus PCS (VIMPCS) for 24 h. For infusion samples (in vivo), fractional enrichment of [U-13C]-glucose into TCA cycle intermediates was determined relative to [U-13C]-glucose abundance in spleen (mean ± SEM, n = 3–6/sample) (data from Ma et al., 2019). *p < 0.05, **p < 0.01, ***p < 0.001, ****p < 0.0001; ns, not significant.
Figure 2.
Figure 2.. Physiologic carbon sources influence T cell metabolism independent of metabolic programming
A–C) PCA for CD8+ T cells cultured for 24 h in IMDM or VIM with or without PCSs as in Figure 1B. Shown are data for total mRNA expression (A), mRNA expression for KEGG central carbon metabolism genes (B), and [U-13C]-glucose-derived metabolites (C) (mean ± SEM, n = 3/group). (D–F) Metabolic flux modeling of central carbon metabolism in CD8+ T cells as determined using 13C-glucose tracing data from Figure 1B. Significant (p < 0.05) differences in net flux are indicated by color and bar weight (red, increased; blue, decreased). (D) Net fluxes for CD8+ T cells cultured for 24 h in VIM relative to IMDM. (E and F) Net fluxes for CD8+ T cells cultured for 24 h in VIM (E) or IMDM (F) containing or lacking PCSs (i.e., PCSs versus unsupplemented medium). Refer to Table S2 for details of flux analysis.
Figure 3.
Figure 3.. Physiologic carbon sources contribute to TCA cycle metabolism and biosynthesis
(A) Schematic depicting potential contribution of carbon sources to TCA cycle metabolism. Enzyme reactions localized to the cytosol and mitochondrion are indicated, with metabolic enzymes listed in gray. (B) Heatmap depicting relative contribution of 13C from indicated [U-13C]-labeled substrates into metabolites of central carbon metabolism in activated CD8+ T cells after 24 h of culture (n = 3/group). (C) MIDs for [U-13C]-PCS-derived carbon into citrate, malate, glutamate, and aspartate for CD8+ T cells cultured as in Figure 1B. Shown are individual isotopologues derived from acetate, βOHB, glucose, and lactate after 24 h of culture (mean ± SEM, n = 3/group). (D) Schematic showing pathways for UTP synthesis from glucose and PCSs. (E) MIDs for [U-13C]-glucose-derived UTP for activated CD8+ T cells cultured in IMDM or VIM with or without PCSs. Shown are MID labeling patterns from [U-13C]-glucose into UTP after 24 h of culture (mean ± SEM, n = 3/group). (F) MID labeling pattens in UTP and carbamoyl-aspartate for in vitro-activated CD8+ T cells cultured in VIMPCS for 24 h. Shown are individual isotopologues derived from specific metabolites as in (C) (mean ± SEM, n = 3/group). (G and H) MIDs for [U-13C]-glucose-derived citrate (G) and UTP (H) for activated CD8+ T cells cultured for 24 h in VIM supplemented with indicated concentrations of lactate (mean ± SEM, n = 3/group). (I) Change in MID from [U-13C]-glucose into indicated metabolite isotopologues in activated CD8+ T cells cultured for 24 h in VIM containing increasing concentrations of lactate. Changes in MID were determined relative to cells cultured in VIM containing no lactate (mean ± SEM, n = 3/group).
Figure 4.
Figure 4.. Physiologic carbon sources influence T cell survival and effector function
(A) Histograms of T-bet, Tox, and Tcf1 expression in CD8+ T cells activated for 3 days with plate-bound anti-CD3 and -CD28 antibodies in VIM (closed) or VIMPCS (open). (B) Proliferation of anti-CD3- and anti-CD28-stimulated CD8+ T cells cultured in VIM or VIMPCS for 3 days (n = 3/group). Left: violet proliferation dye (VPD) dilution. Right: percentage of Ki67+ CD8+ T cells after activation in VIM, VIMPCS, or VIM containing PCSs but lacking acetate (red), βOHB (yellow), or lactate (green). (C) Cell viability (left) or cell number (right) of activated CD8+ T cells after 48 h of culture in VIM plus IL-2 and containing (+Glc) or lacking (−Glc) glucose. Percent viability was calculated relative to cell viability in glucose-replete conditions (5 mM) (mean ± SEM, n = 3/group). Cell number was expressed relative to initial cell number at day 0 (mean ± SEM, n = 3/group). (D) Intracellular IFN-γ, TNF-α, and granzyme B levels in CD8+ T cells activated as in (A) (n = 3/group). (E) Relative expression of Ifng and Gzmb mRNA in CD8+ T cells cultured as in (D) (mean ± SD, n = 3/group). (F) Percentage of IFN-γ+ CD8+ T cells (left) and MFI for IFN-γ expression (right) for CD8+ T cells cultured as in (D) in VIM, VIMPCS, or VIM containing PCSs but lacking acetate, βOHB, or lactate (n = 3/group). (G–I) CD8+ T cells were activated for 3 days with plate-bound anti-CD3 and -CD28 antibodies, followed by culture for an additional 4 days with IL-2, in VIM or VIMPCS. Analysis of CD8+ T cells was conducted on day 7. (G) T-bet, Tox, and Tcf1 expression. (H) Plot of CD44 versus intracellular IFN-γ expression. (I) Percentage of IFN-γ+ CD8+ T cells and MFI for IFN-γ expression (mean ± SEM, n = 3/group).
Figure 5.
Figure 5.. Lactate is a physiologic fuel for CD8+ T cells
(A) Schematic of [U-13C]-glucose (blue) and [U-13C]-lactate (green) tracing into TCA cycle intermediates and TCA cycle-derived metabolites (i.e., aspartate). (B) [U-13C]-glucose (5 mM) and [U-13C]-lactate (2 mM) labeling into lactate in activated CD8+ T cells after 4 h of culture (mean ± SEM, n = 3/group). Left: fractional enrichment of [U-13C]-glucose and [U-13C]-lactate carbon into the lactate pool. Right: total abundance of [U-13C]-glucose- or [U-13C]-lactate-derived lactate in activated CD8+ T cells cultured in VIM lacking (−) or containing (+) 2 mM lactate. (C) [U-13C]-glucose and [U-13C]-lactate labeling into pyruvate for T cells cultured as in (B) (mean ± SEM, n = 3/group). Left: fractional enrichment of [U-13C]-glucose and [U-13C]-lactate carbon into the pyruvate pool. Right: total abundance of [U-13C]-glucose- or [U-13C]-lactate-derived pyruvate in T cells cultured without (−) or with (+) 2 mM lactate. (D–F) Fractional enrichment of [U-13C]-glucose and [U-13C]-lactate in intracellular (D) lactate, (E) TCA cycle intermediates (citrate, malate, and aspartate), and (F) acetyl-carnitine in OT-I CD8+ T cells isolated from LmOVA-infected mice at 3 dpi. Isolated T cells were cultured ex vivo in VIM containing 5 mM glucose and 2 mM lactate (either 12C or 13C) for 4 h (mean ± SEM, n = 4/group). (G) Bioenergetic profile of in vitro-activated CD8+ T cells cultured with no (Ctrl) or 2 mM lactate (+Lac) (mean ± SD, n = 20–22/group). Left: OCR plot for activated CD8+ T cells over time. Time of addition of oligomycin, fluoro-carbonyl cyanide phenylhydrazone (FCCP), and rotenone and antimycin A (rot./AA) are indicated. Right: maximal ATP production rates from OXPHOS. (H and I) MID of [U-13C]-glucose and [U-13C]-lactate carbon in (H) UTP or (I) palmitate for in vitro-activated CD8+ T cells cultured in VIM for 4 h (H) or 24 h (I) (mean ± SEM, n = 3/group).
Figure 6.
Figure 6.. Ldha regulates T cell metabolism and effector cell expansion in vivo
(A) Immunoblot of Ldha and actin protein levels in whole cell lysates from activated CD8+ T cells expressing a control (Ctrl) or Ldha-targeting (shLdha) shRNA. (B) Relative abundance of intracellular [U-13C]-lactate-derived lactate (Lac) and pyruvate (Pyr) in activated CD8+ T cells expressing a control (Ctrl) or Ldha-targeting (shLdha) shRNA. T cells were cultured in VIM containing 5 mM glucose and 2 mM [U-13C]-lactate for 4 h (mean ± SEM, n = 3/group). (C) Basal (left) and maximal (right) ATP production rates from OXPHOS for CD8+ T cells expressing a control (Ctrl) or Ldha-targeting (shLdha) shRNA cultured as in (B) (mean ± SD, n = 10–24/group). (D) Relative abundance of intracellular [U-13C]-glucose-derived lactate (Lac) in control (Ctrl) or shLdha-expressing CD8+ T cells cultured with 5 mM [U-13C]-glucose and 2 mM lactate for 4 h (mean ± SEM, n = 3/group). (E) Flow cytometry plots showing abundance of OVA-specific Thy1.1+ OT-I T cells in the spleen of LmOVA-infected mice 7 dpi. Right: percentage and total number of Thy1.1+ CD8+ OT-I T cells (mean ± SEM, n = 5 mice/shRNA). (F) Flow cytometry plots showing the percentage of IFN-γ+ control (Ctrl) or shLdha-expressing Thy1.1+ CD8+ OT-I T cells in the spleen of LmOVA-infected mice 7 dpi. Right: percentage and total number of IFN-γ+ Thy1.1+ CD8+ T cells (mean ± SEM, n = 5 mice/shRNA). (G and H) MIDs for indicated intracellular metabolites in activated control (Ctrl) or shLdha-expressing CD8+ T cells. Cells were cultured for 4 h in VIM containing (G) 2 mM [U-13C]-lactate and unlabeled 5 mM glucose or (H) 5 mM [U-13C]-glucose and unlabeled 2 mM lactate (mean ± SEM, n = 3/group). (I) [U-13C]-lactate and [U-13C]-glucose labeling into palmitate (in VIM for 24 h) in activated CD8+ T cells expressing a control (Ctrl) or Ldha-targeting (shLdha) shRNA (mean ± SEM, n = 3/group). (J) Heatmap depicting relative abundance of intracellular metabolites in activated control (Ctrl) or shLdha-expressing CD8+ T cells following 4 h culture in VIM. Shown are the top 45 significant metabolites (p < 0.05) based on differential metabolite levels between groups (n = 6/group). (K) NAD+:NADH ratio for control (Ctrl) or shLdha-expressing CD8+ T cells cultured for 2 h in VIM containing 0 or 2 mM sodium lactate (n = 2–4/group). (L) NAD+ abundance in activated CD8+ T cells expressing a control (Ctrl) or Ldha-targeting (shLdha) shRNA following 4 h culture in VIM (mean ± SEM, n = 6/group).

References

    1. Angelin A, Gil-de-Gómez L, Dahiya S, Jiao J, Guo L, Levine MH, Wang Z, Quinn WJ, Kopinski PK, Wang L, et al. (2017). Foxp3 reprograms T cell metabolism to function in low-glucose, high lactate environments. Cell Metab. 25, 1282–1293.e7. - PMC - PubMed
    1. Argüello RJ, Combes AJ, Char R, Gigan JP, Baaziz AI, Bousiquot E, Camosseto V, Samad B, Tsui J, Yan P, et al. (2020). SCENITH: a flow cytometry-based method to functionally profile energy metabolism with single-cell resolution. Cell Metab. 32, 1063–1075.e7. - PMC - PubMed
    1. Badovinac VP, Porter BB, and Harty JT (2004). CD8+ T cell contraction is controlled by early inflammation. Nat. Immunol. 5, 809–817. - PubMed
    1. Balmer ML, Ma EH, Bantug GR, Gärhlert J, Pfister S, Glatter T, Jauch A, Dimeloe S, Slack E, Dehio P, et al. (2016). Memory CD8+ T cells require increased concentrations of acetate induced by stress for optimal function. Immunity 44, 1312–1324. - PubMed
    1. Beltra JC, Manne S, Abdel-Hakeem MS, Kurachi M, Giles JR, Chen Z, Casella V, Ngiow SF, Khan O, Huang YJ, et al. (2020). Developmental relationships of four exhausted CD8 + T cell subsets reveals underlying transcriptional and epigenetic landscape control mechanisms. Immunity 52, 825–841.e8. - PMC - PubMed

Publication types