. 2022 Aug 18;36(13-14):770-789.
doi: 10.1101/gad.349565.122. Online ahead of print.

RNA Pol II pausing facilitates phased pluripotency transitions by buffering transcription

Affiliations

RNA Pol II pausing facilitates phased pluripotency transitions by buffering transcription

Abderhman Abuhashem et al. Genes Dev. .

Abstract

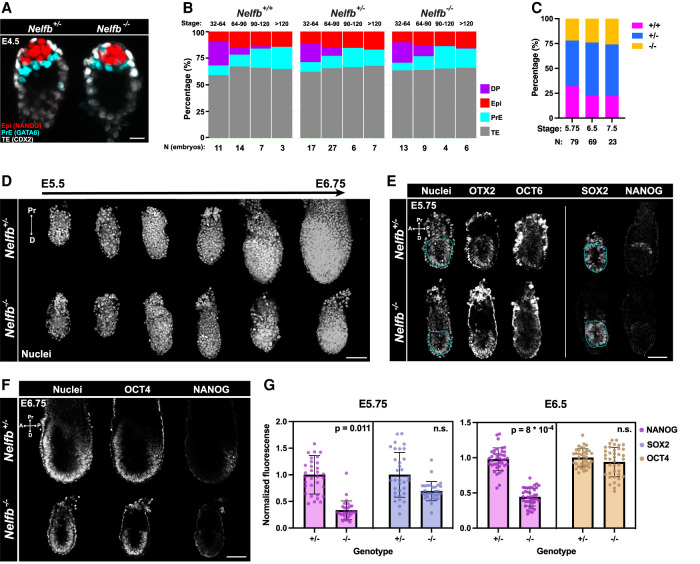
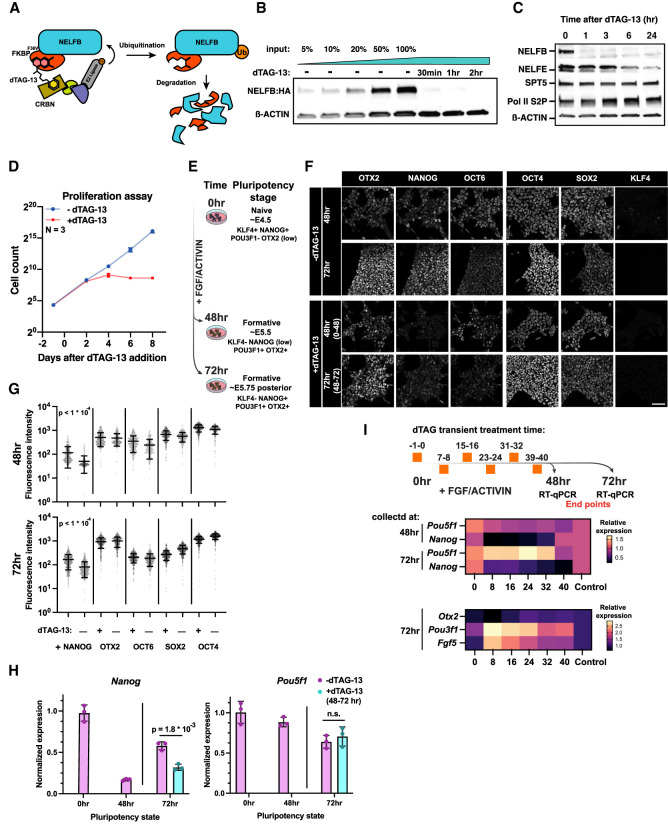
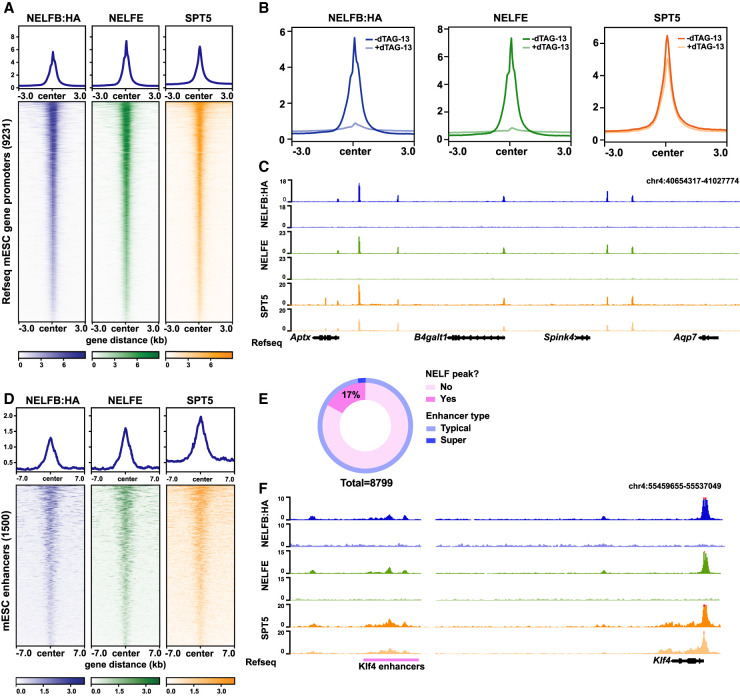
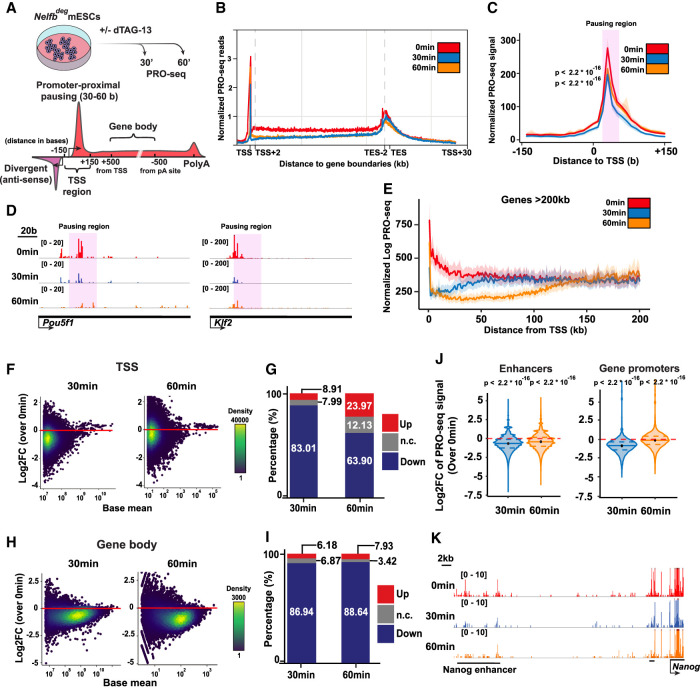
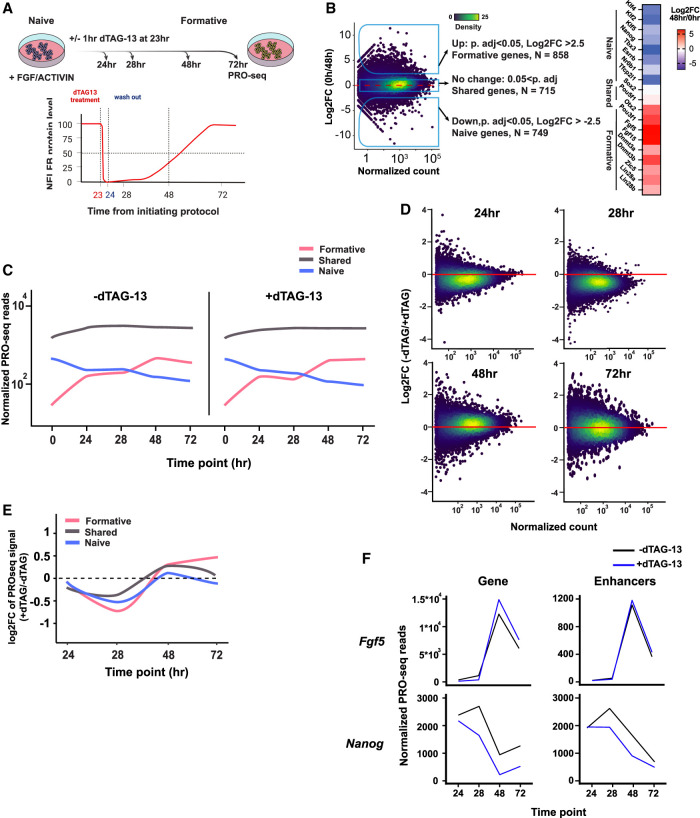
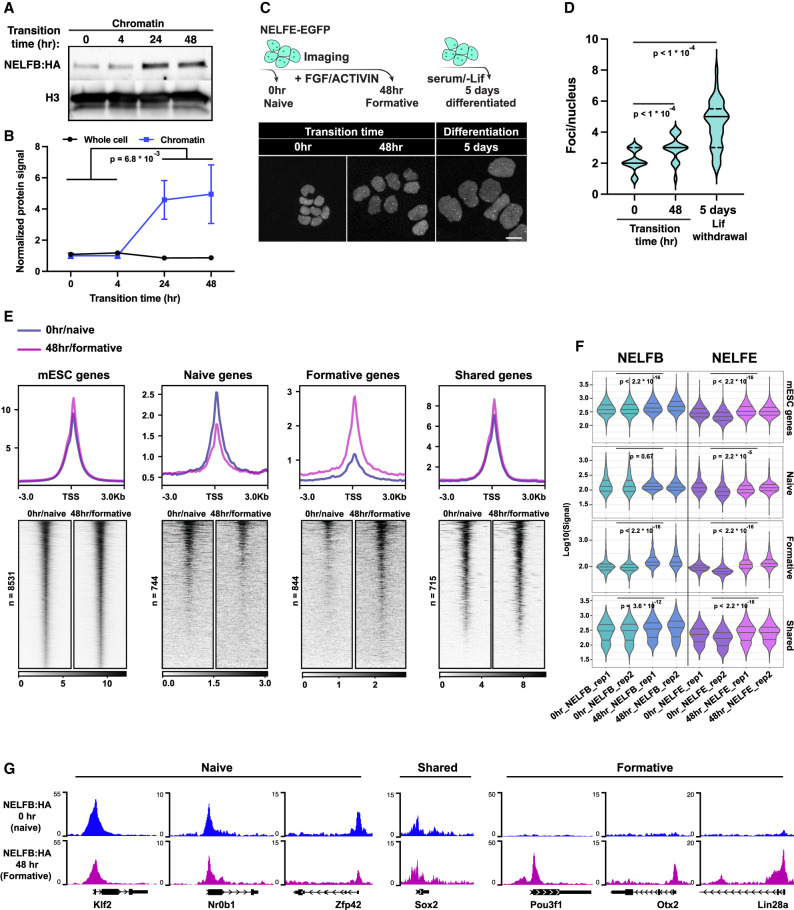
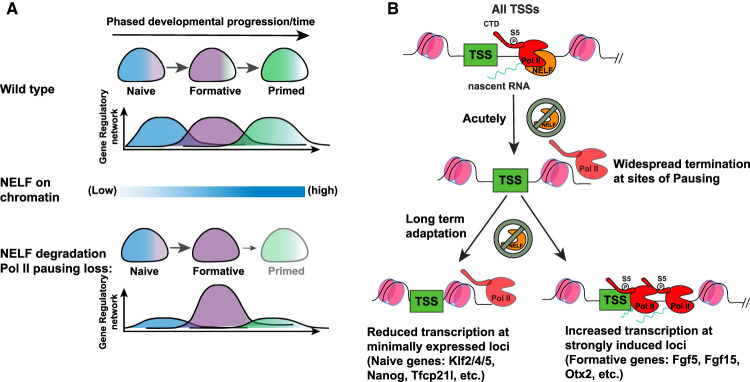
Promoter-proximal RNA Pol II pausing is a critical step in transcriptional control. Pol II pausing has been predominantly studied in tissue culture systems. While Pol II pausing has been shown to be required for mammalian development, the phenotypic and mechanistic details of this requirement are unknown. Here, we found that loss of Pol II pausing stalls pluripotent state transitions within the epiblast of the early mouse embryo. Using Nelfb -/- mice and a NELFB degron mouse pluripotent stem cell model, we show that embryonic stem cells (ESCs) representing the naïve state of pluripotency successfully initiate a transition program but fail to balance levels of induced and repressed genes and enhancers in the absence of NELF. We found an increase in chromatin-associated NELF during transition from the naïve to later pluripotent states. Overall, our work defines the acute and long-term molecular consequences of NELF loss and reveals a role for Pol II pausing in the pluripotency continuum as a modulator of cell state transitions.

Keywords: NELF; dTAG; degron; embryonic stem cells; epiblast; mouse embryo; pausing; pluripotency; transcription.


Figures

Figure 1.
Figure 1.
Nelfb−/− embryos display defects in pluripotent epiblast state transitions. (A) Immunofluorescence of E4.5 blastocysts labeling epiblast (NANOG), primitive endoderm (GATA6), and trophectoderm (CDX2). Several Z slices are shown in maximum intensity projection (MIP) to show the ICM. Scale bar, 15 μm. (B) Stacked bar plot representing the percentage of each lineage in blastocysts sorted by stage, total cell number per blastocyst, and genotype. (C) Stacked bar plot representing percentage of each Nelfb genotype at different postimplantation stages. (D) Maximum intensity projection (MIP) of embryos dissected at stages between E5.5 and E6.75 at 0.25-d increments. Nuclei are shown to reflect whole embryo. Nuclei were labeled with Hoechst. Scale bar, 100 μm. (E) Immunofluorescence of E5.75 embryos of select pluripotency markers. The bordered region highlights the epiblast cup. The vertical line means separate embryos. Single Z slices are shown. Scale bar, 50 μm. (F) Immunofluorescence of E6.75 embryos of select pluripotency markers. Nuclei were labeled with Hoechst. Single Z slices are shown. Scale bar, 100 μm. (G) Normalized immunofluorescence intensity per epiblast nucleus for pluripotency markers. Single dots are single nuclei. Quantifications show four embryos per group. Statistical testing using t-test was performed on embryo averages. Error bars show standard deviation. P < 0.05 was used to determine significance.
Figure 2.
Figure 2.
NELFB-depleted mESCs recapitulate defects in pluripotent state transitions observed in the embryo. (A) Schematic of the dTAG targeted protein degradation system. (B) Western blot of NELFB degradation efficiency and dynamics following 500 nM dTAG-13 treatment. Input refers to relative amount of protein loaded to the gel. (C) Western blot of transcription-associated proteins following NELFB degradation for varying time periods. (D) Proliferation assay of Nelfbdeg mESCs in the presence and absence of 500 nM dTAG-13. Cells were counted and passaged every 2 d. (E) Schematic of the pluripotency transition protocol in vitro. The schematic shows corresponding in vivo stages and marker expression. (F) Immunofluorescence of Nelfbdeg mESCs following pluripotency transitions with and without dTAG-13 at 48 and 72 h. The time interval in parentheses in the treatment panels refers to the time of adding dTAG-13. Scale bar, 50 μm. (G) Quantification of immunofluorescence data in F. The quantification was performed automatically using MINS (see the Materials and Methods). Mean and standard deviation are shown. Statistical testing was performed using a t-test. (H) Normalized RT-qPCR of select factors from the experiment in F. The +dTAG-13 marks the addition of dTAG-13 between hours 48 and 72 of pluripotency transitions. Data were normalized to Actb levels. Statistical testing using t-test was performed on embryo averages. Error bars show standard deviation. P < 0.05 was used to determine significance. (I, top) Schematic of the experiment showing different times of adding dTAG-13 for 1 h followed by washing. Each time point represents one condition. Cells were collected for RT-qPCR at hours 48 and 72 of transitions. (Middle) Heat map of normalized RT-qPCR expression relative to control. Naïve factors are shown. (Bottom) Heat map of normalized RT-qPCR expression relative to control. Formative factors are shown.
Figure 3.
Figure 3.
NELF displays widespread binding at promoters and enhancers, and Nelfbdeg enables acute clearance of the NELF complex from chromatin. (A) Heat map of NELFB, NELFE, and SPT5 ChIP-seq signal at active protein-coding genes’ promoters in mESCs. Active promoters were designated as TSSs that contain an SPT5 peak (Q-value < 0.05). (B) Metaplot of ChIP-seq signals at promoters defined in A with and without 30 min of dTAG-13. (C) Genome browser shot of a representative region for metaplots in B. (D) Heat map of NELFB, NELFE, and SPT5 ChIP-seq signal at mESC-specific enhancers (Whyte et al. 2013). Enhancers with NELF peaks (Q-value < 0.05) are shown. (E) The ratio of enhancers and superenhancers that contain NELF peaks. (F) Genome browser shot of a representative enhancer region showing NELF peaks.
Figure 4.
Figure 4.
NELF stabilizes Pol II pausing and transcription at promoters and enhancers. (A) Schematic of treatments of 30 and 60 min before PRO-seq analysis (top), and regions of each defined DNA element in the following analysis (bottom). (B) Metaplot of scaled protein-coding genes’ PRO-seq signal relative to TSSs and TESs. (C) Metaplot of PRO-seq signal at TSSs. The highlighted region marks the proximal-pausing region. Statistical testing was performed using Wilcoxon and paired t-tests with similar results. (D) Genome browser shot of TSS regions of example pluripotency genes. The highlighted region marks the proximal-pausing region. (E) Metaplot of PRO-seq signal at genes >200 kb. (F) Log2 fold change of PRO-seq signal at TSSs calculated using DEseq2. (G) Bar plot showing the percentage of up, down, and unchanged loci in F. Padj of 0.05 was used as a cutoff. (H) Log2 fold change of PRO-seq signal at gene bodies calculated using DEseq2. (I) Bar plot showing the percentage of up, down, and unchanged loci in H. Padj of 0.05 was used as a cutoff. (J) Violin plot of TSS log2 fold change data in F separated by enhancer versus protein-coding gene TSSs. Plots show mean, 25th percentile, and 75th percentile inside each violin plot. Statistical testing was performed using Wilcoxon and paired t-tests with similar results. (K) Genome browser shot of an example enhancer signal across treatments.
Figure 5.
Figure 5.
NELF balances gene induction and repression during pluripotency transitions. (A, top) Schematic of experiment and analysis time points. (Bottom) Schematic of NELFB protein levels during the experiment following transient depletion. (B, left) Log2 fold change of PRO-seq data for gene expression between 0 and 48 h, which was used to define naïve genes, formative genes, and shared genes. (Right) Heat map of log2 fold change of known naïve and formative markers. (C) Mean normalized PRO-seq reads per gene in each gene class during the transition. Full data range is shown in Supplemental Figure S5A, and heat maps are in Supplemental Figure S5B. (D) Log2 fold change of PRO-seq data for gene expression at each time point of the analysis using DEseq2. (E) Mean log2 fold change of PRO-seq data for gene expression at each time point of the analysis per gene group. Full data range is shown in Supplemental Figure S5C. (F) Normalized gene expression/reads from PRO-seq data at candidate genes and their associated enhancers during the transition protocol. Other genes are shown in Supplemental Figure S5F.
Figure 6.
Figure 6.
NELF is recruited to chromatin during pluripotency transitions. (A) Chromatin fraction Western blot of cells during pluripotency transitions. (B) Quantification of NELFB in chromatin and whole-cell lysates during pluripotency transitions. Statistical testing was performed using a t-test. Each time point includes two biological replicates. (C) Imaging of NELFE-EGFP in naïve, formative, and randomly differentiated mESCs. (Top) Schematic of the experiment. (Bottom) Images of select time points. (D) Violin plot of the number of NELF bodies per nucleus in conditions presented in C. Statistical testing was performed using a t-test. Mean, 25th percentile, and 75th percentile are shown inside each violin plot. (E) Heat map and metaplot of NELFB ChIP-seq signal at the promoters of select gene groups, as defined previously. (F) Quantification of cumulative NELFB and NELFE signal across replicates at each gene group shown in E. Statistical testing was performed using a Wilcoxon test. (G) Genome browser shots of candidate genes representing each group in E and F showing NELFB ChIP-seq signal.
Figure 7.
Figure 7.
Model of Pol II pausing function during fate transitions. (A) Schematic of Pol II pausing function at the cellular level. (B) Schematic of Pol II pausing function at the molecular level.

References

    1. Abuhashem A, Garg V, Hadjantonakis A-K. 2022a. RNA polymerase II pausing in development: orchestrating transcription. Open Biol 12: 210220. 10.1098/rsob.210220 - DOI - PMC - PubMed
    1. Abuhashem A, Lee AS, Joyner AL, Hadjantonakis A-K. 2022b. Rapid and efficient degradation of endogenous proteins in vivo identifies stage-specific roles of RNA Pol II pausing in mammalian development. Dev Cell 57: 1068–1080.e6. 10.1016/j.devcel.2022.03.013 - DOI - PMC - PubMed
    1. Adelman K, Lis JT. 2012. Promoter-proximal pausing of RNA polymerase II: emerging roles in metazoans. Nat Rev Genet 13: 720–731. 10.1038/nrg3293 - DOI - PMC - PubMed
    1. Amleh A, Nair SJ, Sun J, Sutherland A, Hasty P, Li R. 2009. Mouse cofactor of BRCA1 (Cobra1) is required for early embryogenesis. PLoS One 4: e5034. 10.1371/journal.pone.0005034 - DOI - PMC - PubMed
    1. Aoi Y, Smith ER, Shah AP, Rendleman EJ, Marshall SA, Woodfin AR, Chen FX, Shiekhattar R, Shilatifard A. 2020. NELF regulates a promoter-proximal step distinct from RNA Pol II pause-release. Mol Cell 78: 261–274.e5. 10.1016/j.molcel.2020.02.014 - DOI - PMC - PubMed

LinkOut - more resources